

Abstract
AIM: To conduct a meta-analysis to estimate the determinants of the association between erosive esophagitis (EE) and body mass index (BMI).
METHODS: We identified the studies using PubMed. Studies were selected for analysis based on certain inclusion and exclusion criteria. Data were extracted from each study on the basis of predefined items. Meta-analyses were performed to verify the risk factors, such as obesity and gender.
RESULTS: Twenty-one studies were included in this systematic review. These studies demonstrated an association between increasing BMI and the presence of EE [95% confidence interval (CI): 1.35-1.88, overweight, odds ratio (OR) = 1.60, P value homogeneity = 0.003, 95% CI: 1.65-2.55, obese, OR = 2.05, P < 0.01]. The heterogeneity disappeared by stratifying for gender. No publication bias was observed in this meta-analysis by the Egger method.
CONCLUSION: This analysis demonstrates a positive association between BMI and the presence of EE, especially in males. The risk seems to progressively increase with increasing weight.
Keywords: Erosive esophagitis, Gastroesophageal reflux disease, Obesity, Body mass index, Meta-analysis
INTRODUCTION
The symptoms of gastroesophageal reflux disease (GERD) are common health problems in industrialized societies. It is a highly prevalent gastrointestinal disorder encountered in clinical practice[1,2]. Erosive esophagitis (EE) is one of the most common forms of GERD. It occurs when excessive reflux of acid and pepsin results in necrosis of surface layers of the esophageal mucosa, thus causing erosions and ulcers[3]. The etiology of EE may be multifactorial. Esophageal mucosal resistance, gastroesophageal reflux, volume and composition of the gastric contents, contact time for the refluxed material, the degree of incompetence of the intrinsic lower esophageal sphincter, and the presence of a sliding hiatus hernia are likely important determinants[4]. It is a chronic disease that exhausts socioeconomic and medical resources and its symptoms may lower the quality of life of the patients. Additionally, patients with EE are at increasing risk of developing Barrett’s esophagus and esophageal adenocarcinoma[5].
During the past several decades, obesity has emerged as a major health concern in the Western world[6]. Several studies have found an increased risk of esophagitis in overweight patients[7-9]. Excess adiposity is a known risk factor for morbidity, including several cancers[10]. Recently, a relationship between obesity and GERD has been reported[11]. One recent population-based case control study reported a strong association between body mass index (BMI) and esophagitis in females, but not in males[12]. Given these associations, it would seem logical that increasing BMI is associated with EE. However, studies on the association between BMI and reflux esophagitis have yielded inconsistent results[13-16], though a few have found a strong relationship between obesity and EE[17,18].
The aim of this study was to investigate the effect of BMI on risk for EE by performing a meta-analysis of all available literature published in PubMed up to April 2011. By performing a meta-analysis of the studies that met our selection criteria, we hoped to better characterize the association between increased BMI and EE.
MATERIALS AND METHODS
Search strategy
Two investigators independently performed a systematic search of all existing English-language literatures published up to April 2011 using PubMed, an electronic search engine for published manuscripts. Search terms included “obesity”, “BMI”, “overweight” or “BMI”, combined with “reflux or EE”. A total of 268 articles were identified after the preliminary search was reviewed in further details.
Study selection
Studies were included if they met all the following inclusion criteria: (1) Cross-sectional, case control, or cohort studies that permitted assessment of a causal relationship between BMI and EE; (2) Studies with documented and clearly-defined BMI in kg/m2 for all participants; (3) Studies that reported a relative risk or odds ratio (OR) with confidence intervals or provided sufficient data to permit their calculation; and (4) Studies with EE diagnosed by upper endoscopy. The inclusion criteria were not otherwise restricted by study size or publication type. The followings were chosen as the exclusion criteria: (1) Studies not limited to humans or not written in English; (2) Studies that did not report risk estimates or raw data to allow independent calculation of these estimates; and (3) Case reports, case series or studies that lacked a control group.
Data abstraction
The abstracted data included information on the source of the study population, study design (case control, cohort, or cross-sectional), length of the study period, primary aim of the study, exposure definitions (BMI definitions of normal, overweight or obese), exposure measurement method (self-reported vs measured BMI), outcome definitions (diagnosis of EE with endoscopy), total number of subjects with EE, case and control criteria, ORs or risk ratios with and without adjustment for potential confounders and potential confounders used for adjustment.
Exposure definition
We defined body mass categories using the following BMI [weight (in kilograms)/height (in meters)2]: “normal” (BMI between 18.5 and 25 kg/m2), “overweight” (BMI between 25 and 28 kg/m2), and “obese” (BMI ≥ 28 kg/m2). These groupings represented the divisions or quartiles most frequently reported in the literature even though they differed somewhat from BMI categories in common use (overweight, BMI 25-29.9 kg/m2; obese, BMI ≥ 30 kg/m2)[11]. We also created a category that included both overweight and obese (BMI ≥ 25 kg/m2). For each study, we selected the BMI classification that most closely approximated each of these categories. We included more than one estimate from the studies (e.g., if a study reported an OR for persons with a BMI 25-28 kg/m2 and an OR for persons with a BMI ≥ 28 kg/m2, both ORs were included in the summary estimate as BMI ≥ 25 kg/m2)[11]. We then compared the risk of EE among the BMI categories.
We used estimates adjusted for potential confounders whenever they were available; if no adjusted estimates were provided, unadjusted estimates were used or calculated from the data[11].
Outcome definition
An outcome was defined as EE diagnosed with endoscopy. The severity of EE was graded from A to D according to the LA classification[19] or modified Savary-Miller classification (grade I, single or multiple non-confluent erosions; grade II, confluent non-circumferential multiple erosion; grade III, circumferential erosions; and grade IV, ulcer and/or stricture)[20].
Statistical analysis
The BMI data were extracted from each study and analyzed with STATA 11.0 (StataCorp, College Station, TX, United States, www.stata.com). Summary OR estimates were calculated using either relative risks (for cohort studies) or OR (for case control studies). Summary OR estimates were calculated based on the assumption of fixed effects and heterogeneity was tested using the Mantel-Haenszel method[21]. We evaluated heterogeneity by comparing the results between the fixed effects model and a random effects model[21]. Heterogeneity among the studies was analyzed using χ2 test and considered present if P ≤ 0.05 or if there was more than a 20% difference in the summary estimates between the two models. To enhance the confidence of the results of the statistics when the number of combined studies was deficient, we used the I2 metric, which describes the proportion of variability across studies that is due to score heterogeneity. If I2 = 0, there is no heterogeneity. I2 > 50% is considered to be indicative of heterogeneity. Larger values indicate greater heterogeneity. If these tests indicated heterogeneity, we explored possible causes[21-24]. Then, to exclude the excessive influence of any single study, we assessed whether exclusion of any single study substantially altered the magnitude or heterogeneity of the summary estimate. We also stratified analyses by several factors[25-31]. Funnel plots were produced and Egger’s test[32] was conducted to examine publication bias.
RESULTS
We identified 268 published articles or abstracts (Figure 1). After review of titles and abstracts, 31 articles appeared to meet the initial inclusion criteria. The excluded studies were review articles, animal experiments, case series that lacked appropriate control groups and studies that did not report the subject of interest. These 31 studies underwent a complete data abstraction. Ten additional studies were excluded after data abstraction for the following reasons: BMI categories that were inconsistent with the proposed reference ranges[7,33-36], inconsistent outcome definition[37], lack of proper control group[38], and lack of evaluable risk estimates within the proposed categories[39-41].
Figure 1.
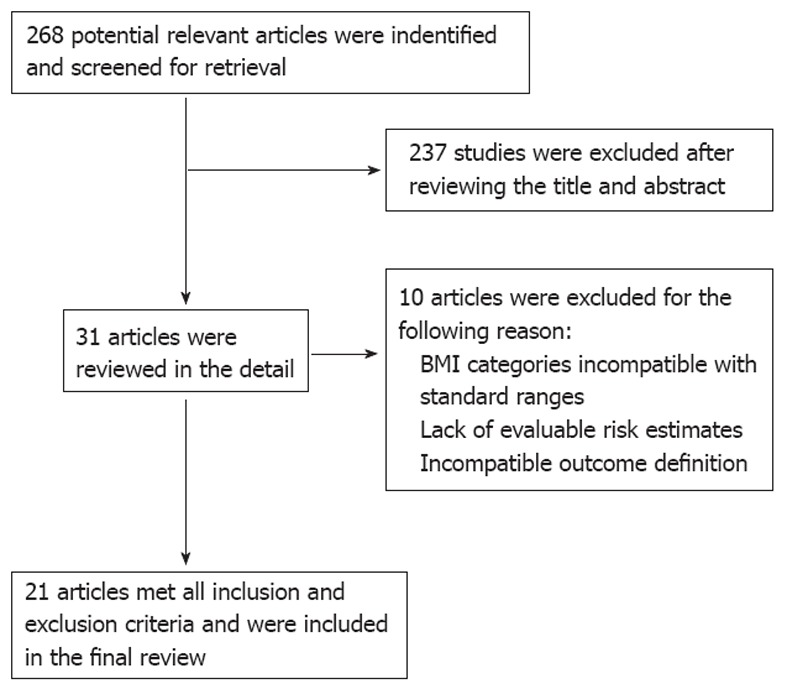
Flow diagram. BMI: Body mass index.
The remaining 21 studies[4,8,12,42-59] (i.e., four cross-sectional, three cohort, 14 case control studies) were included in the primary analysis (Tables 1 and 2). Twelve studies were conducted for the primary purpose of evaluating the relationship between BMI and EE[4,44,45,49-52,54,55,57-59], eight studies were conducted to identify the variety of risk factors for EE, including BMI[8,12,42,46-48,53,56], and one study described the clinical characteristics of EE and non-erosive reflux disease, including BMI[43]. In Table 1, controls and normal groups were composed of general population and healthy volunteers. Eighteen studies were included in Table 3 because of their stratification by gender.
Table 1.
Study characteristics
| Authors | Yr | Design | Region | Population size | Case population | Reference population | Confounders adjusted for |
| Ha et al[43] | 2010 | Case-control | South Korea | n = 292 (EE), n = 500 (NERD) | Single hospital | Hospital controls | G, E, T, J, OD, WHR, TG |
| Nam et al[44] | 2010 | Cohort | South Korea | n = 495 (EE), n = 3779 (normal) | General population | General population | WC , WHR , VAT , SAT |
| Wang et al[46] | 2010 | Case-control | China | n = 70 (EE), n = 502 (non-EE) | General population | General population | A, G, S, B, T, E, C, tea drinking, spicy food consumption, betel nut use |
| Koo et al[45] | 2009 | Case-control | South Korea | n = 42 (EE), n = 987 (control) | General population | General population | G, T, E, TG , |
| Koo et al[45] | 2009 | Case-control | South Korea | n = 42 (EE), n = 1007 (control) | General population | General population | G, T, E, TG , |
| Chua et al[47] | 2009 | Case-control | Taiwan, China | n = 427 (EE), n = 427 (control) | Single hospital | Hospital controls | TG, Glucose intolerance, HDL-C, SBP |
| Song et al[48] | 2009 | Case-control | South Korea | n = 639 (EE), n = 5443 (non-EE) | Single hospital | Hospital controls | A, G, T, E, H, TC, HDL-C, LDL-C, TG, BP, fasting glucose |
| Lien et al[49] | 2009 | Case-control | Taiwan, China | n = 102 (EE), n = 1942 (non-EE) | Single hospital | Hospital controls | A, G, J |
| Lien et al[49] | 2009 | Case-control | Taiwan, China | n = 240 (EE), n = 1662 (non-EE) | Single hospital | Hospital controls | A, G, J |
| Nam et al[50] | 2009 | Cohort | South Korea | n = 552 (EE), n = 8019 (non-EE) | General population | General population | A, WC, E, T |
| Lee et al[51] | 2009 | Case-control | South Korea | n = 100 (EE), n = 100 (control) | Single hospital | Hospital controls | WHR, T, J, VAT, SAT, VAT/SAT |
| Chung et al[52] | 2008 | Case-control | South Korea | n = 3539 (EE), n = 3539 (control ) | Single hospital | Hospital controls | E, T, metabolic syndrome |
| Zagari et al[53] | 2008 | Cross-sectional | Italy | n = 122 (EE), n = 911 (non-EE) | General population | General population | A, G, E, T, H, J, C, medication use, peptic ulcer |
| Lee et al[54] | 2008 | Case-control | South Korea | n = 292 (EE), n = 2896 (control) | Medical center | Medical center | G, TC, TG, WHR, J, T, OD, PBF |
| Kim et al[42] | 2008 | Case-control | South Korea | n = 1810 (EE), n = 20154 (normal) | Multiple hospital | Multiple hospital | G, E, J, H, TC, TG, T, medications for liver/heart disease |
| Moki et al[56] | 2007 | Case-control | Japan | n = 191 (EE), n = 4968 (non-EE) | General population | General population | A, G, BP, TG, FBG |
| Kim et al[58] | 2007 | Case-control | South Korea | n = 1090 (EE), n = 26229 (non-EE) | Single hospital | Hospital controls | A, G, E, T |
| Nocon et al[55] | 2007 | Cohort | Germany | n = 5289 (EE), n = 926 (non-EE) | General population | General population | A, T, E, |
| Kang et al[57] | 2007 | Cross-sectional | South Korea | n = 161 (EE), n = 2281 (non-EE) | Single hospital | Hospital controls | A, G, J, T, B, hypertensive drugs, lifestyle choices, abdominal obesity |
| Labenz et al[8] | 2004 | Cross-sectional | Germany | n = 2455 (EE), n = 2834 (control) | Medical center | Medical center | A, G, R, S, T, E, B, H, concomitant disease, concomitant medicatons |
| Nilsson et al[12] | 2002 | Case-control | Sweden | n = 179 (EE), n = 179 (control) | Multiple hospital | Multiple hospital | T, cholecystectomy, I, drugs use |
| Wilson et al[59] | 1999 | Case-control | United States | n = 189 (EE), n = 1024 (control) | Single hospital | Single hospital | A, G, J, R |
| Stene-Larsen et al[4] | 1988 | Cross-sectional | Sweden | n = 195 (EE), n = 1029 (control) | Single hospital | Single hospital | None |
A: Age; B: Aspirin or NSAID intake; C: Coffee; D: Meal size; E: Alcohol/ethanol; F: Family history; G: Gender; H: Helicobacter pylori infection; I: Asthma or asthma medication; J: Hiatal hernia; K: Hospital visit or hospitalization; M: Marital status; O: Symptom checklist-90 score; P: Physical activity; Q: Psychosomatic symptoms; R: Race; S: Socioeconomic status, education; T: Tobacco; W: Right handedness; V: Comorbidity; X: Case control status; Y: Birthplace; Z: Hormone replacement therapy; VAT: Visceral adipose tissue; SAT: Subcutaneous adipose tissue; BP: Blood pressure; SBP: Systolic; DBP: Diastolic blood pressure; TC: Total cholesterol; HDL-C: High-density lipoprotein cholesterol; LDL-C: Low-density lipoprotein cholesterol; TG: Triglyceride; HbAlc: Hemoglobin Alc; OD: Obesity degree; WHR: Waist-to-hip ratio; WC: Waist circumference; PBF: Percentage of body fat; FBG: Fasting blood glucose; EE: Erosive esophagitis; NERD: Non-erosive reflux disease; NSAID: Nonsteroidal antiinflammatory drugs.
Table 2.
Exposure and outcome definitions
| Authors | Yr | Exposure (source) | BMI reference (kg/m2) |
Exposure (definitions) |
Outcome (source) | Outcome (definitions) | ||
| BMI overweight(kg/m2) | BMI obese(kg/m2) | BMI overweight + obese (kg/m2) | ||||||
| Ha et al[43] | 2010 | Measured BMI | ≤ 25 | ≥ 25 | Endoscopy | Los Angeles classification | ||
| Nam et al[44] | 2010 | Measured BMI | < 20 | 25-29.9 | ≥ 30 | ≥ 25 | Endoscopy | Los Angeles classification |
| Wang et al[46] | 2010 | Measured BMI | < 25 | 25-30 | > 30 | ≥ 25 | Endoscopy | Los Angeles classification |
| Koo et al[45] | 2009 | Measured BMI | < 23 | 23-24.9 | ≥ 25 | ≥ 23 | Endoscopy | Los Angeles classification |
| Koo et al[45] | 2009 | Measured BMI | < 23 | 23-24.9 | ≥ 25 | ≥ 23 | Endoscopy | Los Angeles classification |
| Chua et al[47] | 2009 | Self-report | < 25 | ≥ 25 | ≥ 25 | Endoscopy | Los Angeles classification | |
| Song et al[48] | 2009 | Measured BMI | ≥ 30 | Endoscopy | Los Angeles classification | |||
| Lien et al[49] | 2009 | Self-report | < 24 | 24-26.9 | ≥ 27 | ≥ 24 | Endoscopy | Modified Savary-Miller endoscopic classification |
| Lien et al[49] | 2009 | Self-report | < 24 | 24-26.9 | ≥ 27 | ≥ 24 | Endoscopy | Modified Savary-Miller endoscopic classification |
| Nam et al[50] | 2009 | Self-report | < 20 | 25-29.9 | ≥ 30 | ≥ 25 | Endoscopy | Los Angeles classification |
| Lee et al[51] | 2009 | Measured BMI | 20-25 | 25-30 | ≥ 30 | ≥ 25 | Endoscopy | Los Angeles classification |
| Chung et al[52] | 2008 | Measured BMI | < 23 | 23-24.9 | ≥ 25 | ≥ 23 | Endoscopy | Los Angeles classification |
| Zagari et al[53] | 2008 | Self-report | 20-24.9 | 25-29.9 | ≥ 30 | ≥ 25 | Endoscopy | Modified Savary-Miller endoscopic classification |
| Lee et al[54] | 2008 | Measured BMI | < 20 | 25-30 | > 30 | ≥ 25 | Endoscopy | Los Angeles classification |
| Kim et al[42] | 2008 | Measured BMI | < 23 | ≥ 25 | Endoscopy | Los Angeles classification | ||
| Moki et al[56] | 2007 | Measured BMI | < 25 | ≥ 25 | Endoscopy | Los Angeles classification | ||
| Kim et al[58] | 2007 | Measured BMI | 18.9-24.5 | 25-29.9 | ≥ 30 | ≥ 25 | Endoscopy | Los Angeles classification |
| Nocon et al[55] | 2007 | Measured BMI | 25-30 | > 30 | Endoscopy | Los Angeles classification | ||
| Kang et al[57] | 2006 | Measured BMI | < 25 | 25-30 | > 30 | ≥ 25 | Endoscopy | Los Angeles classification |
| Labenz et al[8] | 2004 | Measured BMI | < 25 | 25-30 | > 30 | Endoscopy | Los Angeles classification | |
| Nilsson et al[12] | 2002 | Self-report | < 25 | 25-30 | > 30 | ≥ 25 | Endoscopy | Modified Savary-Miller endoscopic classification |
| Wilson et al[59] | 1999 | Measured BMI | < 20 | 25-30 | > 30 | ≥ 25 | Endoscopy | NA |
| Stene-Larsen et al[4] | 1988 | Measured BMI | < 25 | 25-28 | > 28 | Endoscopy | NA | |
BMI: Body mass index; NA: Not available.
Table 3.
Meta-analysis results in association between body mass index and erosive esophagitis
| BMI category | OR (95% CI) | Phomogeneity | I2(%) | No. of studies |
| Overall | ||||
| Overweight | 1.60 (1.35-1.88) | 0.003 | 59.8 | 12[4,8,12,44,45,50,51,53,54,57-59] |
| Obese | 2.05 (1.65-2.55) | 0.000 | 74.2 | 15[4,8,12,44-46,50-54,56-59] |
| Overweight + obese | 1.64 (1.45-1.85) | 0.000 | 65.7 | 18[4,8,12,43-47,49,50-54,56-59] |
| Females | ||||
| Overweight | 1.47 (1.15-1.88) | 0.011 | 7.4 | 3[12,44,55] |
| Obese | 3.76 (0.92-15.28) | 0.340 | 78.0 | 3[12,44,55] |
| Overweight + obese | 1.45 (1.26-1.66) | 0.579 | 0.0 | 4[12,44,55,56] |
| Males | ||||
| Overweight | 1.40 (1.11-1.75) | 0.285 | 20.8 | 4[12,44,46,55] |
| Obese | 1.74 (1.02-2.96) | 0.099 | 52.1 | 4[12,44,46,55] |
| Overweight + obese | 1.52 (1.24-1.87) | 0.179 | 36.3 | 5[12,44,46,55,56] |
BMI: Body mass index; OR: Odds ratio.
The pooled OR of EE related to BMI of 25 kg/m2 or higher was 1.64-fold greater than that of EE related to BMI less than 25 kg/m2 (OR, 1.64, 95% CI: 1.45-1.85, test for homogeneity, P = 0.000, I2 = 65.7%) (Figure 2, Table 3).
Figure 2.

Erosive esophagitis and body mass index (overweight and obese) in males and females. The size of the square represents the weight that the corresponding study exerts in the meta-analysis. RR: Relative risk; OR: Odds ratio.
Stratification by gender and BMI category showed a homogeneous positive association between increased BMI and EE, and the strength of the association with increased BMI (Table 3). The risk for overweight males (OR, 1.40, 95% CI: 1.11-1.75, P = 0.285) increased further for obese males (OR, 1.75, 95% CI: 1.02-2.96, P = 0.099) (Figure 3). The pooled OR in females and males for BMI greater than 25 kg/m2 were 1.45 (95% CI: 1.26-1.66) and 1.52 (95% CI: 1.24-1.87), respectively. Therefore, we considered there was a strong positive association between increasing BMI and EE in males, but not in females.
Figure 3.

Erosive esophagitis and body mass index (overweight and obese) in males. The size of the square represents the weight that the corresponding study exerts in the meta-analysis. RR: Relative risk; OR: Odds ratio.
Evaluation of heterogeneity
The initial summary estimates for EE were heterogeneous, as described above. Stratification by BMI category did not substantially resolve the heterogeneity; however, additional stratification by gender provided more homogeneity. Stratification of the entire population by exposure measurement (e.g., self-report vs measured), or study design (case control vs cohort) did not substantially influence the initial heterogeneity (Table 3).
Publication bias
The rank correlation test did not suggest the presence of publication bias for the main summary estimates for either the overweight (P = 0.656) or the obese and overweight (P = 0.804). A review of funnel plots did not demonstrate patterns strongly suggestive of publication bias (Figure 4).
Figure 4.
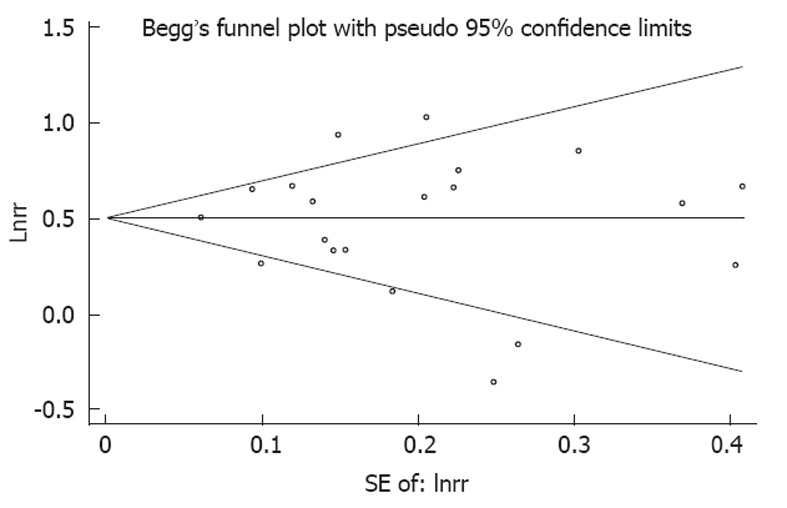
Evaluation of publication bias using a funnel plot. No significant funnel asymmetry was observed which could indicate publication bias. The horizontal line in the funnel plot indicates the random effects summary estimate, while the sloping lines indicate the expected 95% CI for a given standard error, assuming no heterogeneity between studies. Each trial is represented by a circle, the area of which represents the trial’s precision. Larger circles represent trials that offer more information.
DISCUSSION
Our pooled results of observational studies demonstrated a positive association between increased BMI and the risk of EE. The strength of the association increased with increasing BMI and there was a trend towards a stronger association in males than in females. Unlike other non-modifiable risk factors such as age, race and gender, BMI is potentially modifiable. Thus, identifying a relationship between obesity and EE might have significant implications for counseling.
A recent meta-analysis of BMI and GERD complications found heterogeneous results and it was not able to identify strata with homogeneous results[60]. It was possibly due to their methods of stratification, the utilization of estimates with markedly different measures of BMI association, the absence of studies included in the current analysis, and the inclusion of studies that did not set up a non-GERD control group. In contrast, in the current study, after the creation of more categories of BMI among the studies, stratification by gender demonstrated a homogeneous increase in EE with increasing BMI. A study showed a positive correlation between BMI and EE in females, but not in males[12] and a study of reflux patients showed that obese females, but not obese males, had an increased risk of severe esophagitis[55]. The study by Nilsson[12] also found that the association between obesity and EE was further strengthened by the use of oestrogen replacement medication. The prevalence of GERD symptoms as determined in a study investigating a cohort from North America did not differ between males and females[61]. In contrast, in another study, EE was more common in males than in females from Asia[42]. However, in our study, we found a strong positive association between increasing BMI and EE in males, but not in females. This may be because the populations of the included studies were from Asia.
Several hypotheses have been proposed to explain how obesity can cause EE. Abdominal fat may cause reflux through an increase in intrabdominal pressure and subsequent esophageal acid exposure[62,63]. Also, there was a suggestion that hormonal factors related to adiposity are more important than mechanical factors[63]. Obesity is also associated with increased transient lower oesophageal sphincter relaxation[64]. Strengths of this analysis include the use of strict criteria for defining our outcome of interest and the consistency of the BMI-EE association within the males despite different patient populations and different study designs. All the included studies used endoscopy to confirm the diagnosis of EE, which eliminated the possibility of false positive EE cases. Also, we included stratification by study design, location, and source population.
There are potential limitations of this analysis. First, only observational studies were included; study results may be influenced by the presence of measured or unmeasured confounding factors, such as physical activity. Second, bias may also exist in the present study because unpublished data were not included, nor were conference abstracts or articles published in a language other than English. Third, the exposure definitions (i.e., normal, obese or overweight) differed slightly among the studies. We addressed this, however, by creating more comparable and consistent categories, although few differences still remained. Also, the accuracy of the BMI measurement and its reliability as a measure of adiposity are known to be imperfect.
In summary, based on our extensive review and synthesis of the literature, there appears to be a statistically significant association between elevated BMI and EE. Considering the prevalence of obesity and increasing incidence rates of EE, it is important to pay more attention to further studies that evaluate the influence of gender, ethnicity or age on EE to examine this association. Several studies have found abdominal visceral obesity to be an independent risk factor for EE[44,57]. Nam et al[44] demonstrated that association between EE and abdominal visceral adipose tissue volume was consistent among males and females, unlike the association between EE and BMI. However, CT or MRI is needed to test abdominal visceral adipose, which are time consuming and costly. So, measuring BMI may be more feasible. It is also important to determine whether weight loss can decrease the incidence of EE. Further studies are needed to evaluate the relationship between obesity and EE.
COMMENTS
Background
Both obesity and erosive esophagitis (EE) have a high prevalence worldwide. The relationship between them remains controversial.
Research frontiers
Many studies have been performed to evaluate the body mass index (BMI) for gastroesophageal reflux disease risk. It has been found that there was a positive correlation between BMI and EE in females, but not in males.
Innovations and breakthroughs
Findings from this meta-analysis suggested the importance of BMI in EE, especially in males.
Applications
This study provided the potential measurement indicators to identify high-risk groups for EE in obesity population, especially in males.
Terminology
BMI: BMI is a heuristic proxy for human body fat based on an individual’s weight and height. It is defined as the individual’s body mass divided by the square of his or her height; EE: EE is a term used to indicate any inflammation, swelling, or irritation of the esophagus. The esophagus becomes inflamed (swollen, irritated and red).
Peer review
The meta-analysis presents the data on association between obesity and EE. The topic is interesting and the methodology of the meta-analysis is appropriate.
Footnotes
Peer reviewers: Michele Cicala, Professor, MD, Department of Gastroenterology, University Campus Bio Medico, Via Longoni, 83, 00155 Rome, Italy; Wojciech Blonski, MD, PhD, University of Pennsylvania, GI Research-Ground Centrex, 3400 Spruce St, Philadelphia, PA 19104, United States; Kwang Jae Lee, MD, PhD, Professor, Department of Gastroenterology, Ajou University School of Medicine, San5, Woncheondong, Yeongtongku, Suwon 443-721, South Korea
S- Editor Shi ZF L- Editor Ma JY E- Editor Zheng XM
References
- 1.Dent J, El-Serag HB, Wallander MA, Johansson S. Epidemiology of gastro-oesophageal reflux disease: a systematic review. Gut. 2005;54:710–717. doi: 10.1136/gut.2004.051821. [DOI] [PMC free article] [PubMed] [Google Scholar]
- 2.Holtmann G. Reflux disease: the disorder of the third millennium. Eur J Gastroenterol Hepatol. 2001;13 Suppl 1:S5–S11. [PubMed] [Google Scholar]
- 3.Kahrilas PJ. Clinical practice. Gastroesophageal reflux disease. N Engl J Med. 2008;359:1700–1707. doi: 10.1056/NEJMcp0804684. [DOI] [PMC free article] [PubMed] [Google Scholar]
- 4.Stene-Larsen G, Weberg R, Frøyshov Larsen I, Bjørtuft O, Hoel B, Berstad A. Relationship of overweight to hiatus hernia and reflux oesophagitis. Scand J Gastroenterol. 1988;23:427–432. doi: 10.3109/00365528809093890. [DOI] [PubMed] [Google Scholar]
- 5.Pisegna J, Holtmann G, Howden CW, Katelaris PH, Sharma P, Spechler S, Triadafilopoulos G, Tytgat G. Review article: oesophageal complications and consequences of persistent gastro-oesophageal reflux disease. Aliment Pharmacol Ther. 2004;20 Suppl 9:47–56. doi: 10.1111/j.1365-2036.2004.02240.x. [DOI] [PMC free article] [PubMed] [Google Scholar]
- 6.Rennie KL, Jebb SA. Prevalence of obesity in Great Britain. Obes Rev. 2005;6:11–12. doi: 10.1111/j.1467-789X.2005.00164.x. [DOI] [PubMed] [Google Scholar]
- 7.Fujiwara Y, Higuchi K, Shiba M, Yamamori K, Watanabe Y, Sasaki E, Tominaga K, Watanabe T, Oshitani N, Arakawa T. Differences in clinical characteristics between patients with endoscopy-negative reflux disease and erosive esophagitis in Japan. Am J Gastroenterol. 2005;100:754–758. doi: 10.1111/j.1572-0241.2005.40966.x. [DOI] [PubMed] [Google Scholar]
- 8.Labenz J, Jaspersen D, Kulig M, Leodolter A, Lind T, Meyer-Sabellek W, Stolte M, Vieth M, Willich S, Malfertheiner P. Risk factors for erosive esophagitis: a multivariate analysis based on the ProGERD study initiative. Am J Gastroenterol. 2004;99:1652–1656. doi: 10.1111/j.1572-0241.2004.30390.x. [DOI] [PubMed] [Google Scholar]
- 9.Butany VJ, Singh SH, Lal SK. Study of urinary volume and creatinine excretion in women medical students. Indian J Physiol Pharmacol. 1975;19:193–198. [PubMed] [Google Scholar]
- 10.Vainio H, Bianchini F. Evaluation of cancer-preventive agents and strategies a new program at the International Agency for Research on Cancer. Ann N Y Acad Sci. 2001;952:177–180. doi: 10.1111/j.1749-6632.2001.tb02740.x. [DOI] [PubMed] [Google Scholar]
- 11.Corley DA, Kubo A. Body mass index and gastroesophageal reflux disease: a systematic review and meta-analysis. Am J Gastroenterol. 2006;101:2619–2628. doi: 10.1111/j.1572-0241.2006.00849.x. [DOI] [PubMed] [Google Scholar]
- 12.Nilsson M, Lundegårdh G, Carling L, Ye W, Lagergren J. Body mass and reflux oesophagitis: an oestrogen-dependent association? Scand J Gastroenterol. 2002;37:626–630. doi: 10.1080/00365520212502. [DOI] [PubMed] [Google Scholar]
- 13.Nandurkar S, Locke GR, Fett S, Zinsmeister AR, Cameron AJ, Talley NJ. Relationship between body mass index, diet, exercise and gastro-oesophageal reflux symptoms in a community. Aliment Pharmacol Ther. 2004;20:497–505. doi: 10.1111/j.1365-2036.2004.02156.x. [DOI] [PubMed] [Google Scholar]
- 14.Ruigómez A, García Rodríguez LA, Wallander MA, Johansson S, Graffner H, Dent J. Natural history of gastro-oesophageal reflux disease diagnosed in general practice. Aliment Pharmacol Ther. 2004;20:751–760. doi: 10.1111/j.1365-2036.2004.02169.x. [DOI] [PubMed] [Google Scholar]
- 15.Locke GR, Talley NJ, Weaver AL, Zinsmeister AR. A new questionnaire for gastroesophageal reflux disease. Mayo Clin Proc. 1994;69:539–547. doi: 10.1016/s0025-6196(12)62245-9. [DOI] [PubMed] [Google Scholar]
- 16.Wang JH, Luo JY, Dong L, Gong J, Tong M. Epidemiology of gastroesophageal reflux disease: a general population-based study in Xi’an of Northwest China. World J Gastroenterol. 2004;10:1647–1651. doi: 10.3748/wjg.v10.i11.1647. [DOI] [PMC free article] [PubMed] [Google Scholar]
- 17.Lagergren J, Bergström R, Nyrén O. No relation between body mass and gastro-oesophageal reflux symptoms in a Swedish population based study. Gut. 2000;47:26–29. doi: 10.1136/gut.47.1.26. [DOI] [PMC free article] [PubMed] [Google Scholar]
- 18.Incarbone R, Bonavina L, Szachnowicz S, Saino G, Peracchia A. Rising incidence of esophageal adenocarcinoma in Western countries: is it possible to identify a population at risk? Dis Esophagus. 2000;13:275–278. doi: 10.1046/j.1442-2050.2000.00132.x. [DOI] [PubMed] [Google Scholar]
- 19.Inamori M, Togawa J, Nagase H, Abe Y, Umezawa T, Nakajima A, Saito T, Ueno N, Tanaka K, Sekihara H, et al. Clinical characteristics of Japanese reflux esophagitis patients as determined by Los Angeles classification. J Gastroenterol Hepatol. 2003;18:172–176. doi: 10.1046/j.1440-1746.2003.02932.x. [DOI] [PubMed] [Google Scholar]
- 20.Savary M, Miller G. The oesophagus Handbook and atlas of endoscopy. Switzerland: Verlag Gassman AG; 1978. [Google Scholar]
- 21.Petitti DB. Meta-analysis, decision analysis, and cost-effectiveness analysis. 2nd ed. New York: Oxford University Press; 2000. [Google Scholar]
- 22.Olkin I. Re: “A critical look at some popular meta-analytic methods”. Am J Epidemiol. 1994;140:297–299; discussion 300-301. doi: 10.1093/oxfordjournals.aje.a117249. [DOI] [PubMed] [Google Scholar]
- 23.Poole C, Greenland S. Random-effects meta-analyses are not always conservative. Am J Epidemiol. 1999;150:469–475. doi: 10.1093/oxfordjournals.aje.a010035. [DOI] [PubMed] [Google Scholar]
- 24.DerSimonian R, Laird N. Meta-analysis in clinical trials. Control Clin Trials. 1986;7:177–188. doi: 10.1016/0197-2456(86)90046-2. [DOI] [PubMed] [Google Scholar]
- 25.Chalmers TC, Celano P, Sacks HS, Smith H. Bias in treatment assignment in controlled clinical trials. N Engl J Med. 1983;309:1358–1361. doi: 10.1056/NEJM198312013092204. [DOI] [PubMed] [Google Scholar]
- 26.Jadad AR, Moore RA, Carroll D, Jenkinson C, Reynolds DJ, Gavaghan DJ, McQuay HJ. Assessing the quality of reports of randomized clinical trials: is blinding necessary? Control Clin Trials. 1996;17:1–12. doi: 10.1016/0197-2456(95)00134-4. [DOI] [PubMed] [Google Scholar]
- 27.Schulz KF, Chalmers I, Hayes RJ, Altman DG. Empirical evidence of bias. Dimensions of methodological quality associated with estimates of treatment effects in controlled trials. JAMA. 1995;273:408–412. doi: 10.1001/jama.273.5.408. [DOI] [PubMed] [Google Scholar]
- 28.Schulz KF, Chalmers I, Grimes DA, Altman DG. Assessing the quality of randomization from reports of controlled trials published in obstetrics and gynecology journals. JAMA. 1994;272:125–128. [PubMed] [Google Scholar]
- 29.Imperiale TF. Meta-analysis: when and how. Hepatology. 1999;29:26S–31S. [PubMed] [Google Scholar]
- 30.Gerbarg ZB, Horwitz RI. Resolving conflicting clinical trials: guidelines for meta-analysis. J Clin Epidemiol. 1988;41:503–509. doi: 10.1016/0895-4356(88)90053-4. [DOI] [PubMed] [Google Scholar]
- 31.Kleinbaum DG, Kupper LL, Morgenstern H. Epidemiologic research: Principles and quantitative methods. New York: John Wiley and Sons; 1982. [Google Scholar]
- 32.Banki F, Demeester SR, Mason RJ, Campos G, Hagen JA, Peters JH, Bremner CG, Demeester TR. Barrett’s esophagus in females: a comparative analysis of risk factors in females and males. Am J Gastroenterol. 2005;100:560–567. doi: 10.1111/j.1572-0241.2005.40962.x. [DOI] [PubMed] [Google Scholar]
- 33.Gunji T, Sato H, Iijima K, Fujibayashi K, Okumura M, Sasabe N, Urabe A, Matsuhashi N. Risk factors for erosive esophagitis: a cross-sectional study of a large number of Japanese males. J Gastroenterol. 2011;46:448–455. doi: 10.1007/s00535-010-0359-5. [DOI] [PubMed] [Google Scholar]
- 34.Patel NR, Ward MJ, Beneck D, Cunningham-Rundles S, Moon A. The Association between Childhood Overweight and Reflux Esophagitis. J Obes. 2010;2010:136909. doi: 10.1155/2010/136909. [DOI] [PMC free article] [PubMed] [Google Scholar]
- 35.Tai CM, Lee YC, Tu HP, Huang CK, Wu MT, Chang CY, Lee CT, Wu MS, Lin JT, Wang WM. The relationship between visceral adiposity and the risk of erosive esophagitis in severely obese Chinese patients. Obesity (Silver Spring) 2010;18:2165–2169. doi: 10.1038/oby.2010.143. [DOI] [PubMed] [Google Scholar]
- 36.Yasuhara H, Miyake Y, Toyokawa T, Matsumoto K, Takahara M, Imada T, Yagi S, Miyatake H, Nakatsu M, Ando M, et al. Large waist circumference is a risk factor for reflux esophagitis in Japanese males. Digestion. 2010;81:181–187. doi: 10.1159/000235919. [DOI] [PubMed] [Google Scholar]
- 37.Elitsur Y, Dementieva Y, Elitsur R, Rewalt M. Obesity is not a risk factor in children with reflux esophagitis: a retrospective analysis of 738 children. Metab Syndr Relat Disord. 2009;7:211–214. doi: 10.1089/met.2008.0069. [DOI] [PubMed] [Google Scholar]
- 38.Nozu T, Komiyama H. Clinical characteristics of asymptomatic esophagitis. J Gastroenterol. 2008;43:27–31. doi: 10.1007/s00535-007-2120-2. [DOI] [PubMed] [Google Scholar]
- 39.Lee SJ, Song CW, Jeen YT, Chun HJ, Lee HS, Um SH, Lee SW, Choi JH, Kim CD, Ryu HS, et al. Prevalence of endoscopic reflux esophagitis among Koreans. J Gastroenterol Hepatol. 2001;16:373–376. doi: 10.1046/j.1440-1746.2001.02464.x. [DOI] [PubMed] [Google Scholar]
- 40.Chang CS, Poon SK, Lien HC, Chen GH. The incidence of reflux esophagitis among the Chinese. Am J Gastroenterol. 1997;92:668–671. [PubMed] [Google Scholar]
- 41.Furukawa N, Iwakiri R, Koyama T, Okamoto K, Yoshida T, Kashiwagi Y, Ohyama T, Noda T, Sakata H, Fujimoto K. Proportion of reflux esophagitis in 6010 Japanese adults: prospective evaluation by endoscopy. J Gastroenterol. 1999;34:441–444. doi: 10.1007/s005350050293. [DOI] [PubMed] [Google Scholar]
- 42.Kim N, Lee SW, Cho SI, Park CG, Yang CH, Kim HS, Rew JS, Moon JS, Kim S, Park SH, et al. The prevalence of and risk factors for erosive oesophagitis and non-erosive reflux disease: a nationwide multicentre prospective study in Korea. Aliment Pharmacol Ther. 2008;27:173–185. doi: 10.1111/j.1365-2036.2007.03561.x. [DOI] [PubMed] [Google Scholar]
- 43.Ha NR, Lee HL, Lee OY, Yoon BC, Choi HS, Hahm JS, Ahn YH, Koh DH. Differences in clinical characteristics between patients with non-erosive reflux disease and erosive esophagitis in Korea. J Korean Med Sci. 2010;25:1318–1322. doi: 10.3346/jkms.2010.25.9.1318. [DOI] [PMC free article] [PubMed] [Google Scholar]
- 44.Nam SY, Choi IJ, Ryu KH, Park BJ, Kim HB, Nam BH. Abdominal visceral adipose tissue volume is associated with increased risk of erosive esophagitis in men and women. Gastroenterology. 2010;139:1902–1911.e2. doi: 10.1053/j.gastro.2010.08.019. [DOI] [PubMed] [Google Scholar]
- 45.Koo JS, Lee SW, Park SM, Jung SW, Yim HJ, Park JJ, Chun HJ, Lee HS, Choi JH, Kim CD, et al. Abdominal obesity as a risk factor for the development of erosive esophagitis in subjects with a normal esophago-gastric junction. Gut Liver. 2009;3:276–284. doi: 10.5009/gnl.2009.3.4.276. [DOI] [PMC free article] [PubMed] [Google Scholar]
- 46.Wang FW, Tu MS, Chuang HY, Yu HC, Cheng LC, Hsu PI. Erosive esophagitis in asymptomatic subjects: risk factors. Dig Dis Sci. 2010;55:1320–1324. doi: 10.1007/s10620-009-0888-z. [DOI] [PubMed] [Google Scholar]
- 47.Chua CS, Lin YM, Yu FC, Hsu YH, Chen JH, Yang KC, Shih CH. Metabolic risk factors associated with erosive esophagitis. J Gastroenterol Hepatol. 2009;24:1375–1379. doi: 10.1111/j.1440-1746.2009.05858.x. [DOI] [PubMed] [Google Scholar]
- 48.Song HJ, Shim KN, Yoon SJ, Kim SE, Oh HJ, Ryu KH, Ha CY, Yeom HJ, Song JH, Jung SA, et al. The prevalence and clinical characteristics of reflux esophagitis in koreans and its possible relation to metabolic syndrome. J Korean Med Sci. 2009;24:197–202. doi: 10.3346/jkms.2009.24.2.197. [DOI] [PMC free article] [PubMed] [Google Scholar]
- 49.Lien HC, Chang CS, Yeh HZ, Ko CW, Chang HY, Cheng KF, Sung FC. Increasing prevalence of erosive esophagitis among Taiwanese aged 40 years and above: a comparison between two time periods. J Clin Gastroenterol. 2009;43:926–932. doi: 10.1097/MCG.0b013e318191e9d5. [DOI] [PubMed] [Google Scholar]
- 50.Nam SY, Choi IJ, Nam BH, Park KW, Kim CG. Obesity and weight gain as risk factors for erosive oesophagitis in men. Aliment Pharmacol Ther. 2009;29:1042–1052. doi: 10.1111/j.1365-2036.2009.03965.x. [DOI] [PubMed] [Google Scholar]
- 51.Lee HL, Eun CS, Lee OY, Jeon YC, Han DS, Yoon BC, Choi HS, Hahm JS, Ahn YH, Song SY. Association between erosive esophagitis and visceral fat accumulation quantified by abdominal CT scan. J Clin Gastroenterol. 2009;43:240–243. doi: 10.1097/MCG.0b013e318167b88a. [DOI] [PubMed] [Google Scholar]
- 52.Chung SJ, Kim D, Park MJ, Kim YS, Kim JS, Jung HC, Song IS. Metabolic syndrome and visceral obesity as risk factors for reflux oesophagitis: a cross-sectional case-control study of 7078 Koreans undergoing health check-ups. Gut. 2008;57:1360–1365. doi: 10.1136/gut.2007.147090. [DOI] [PubMed] [Google Scholar]
- 53.Zagari RM, Fuccio L, Wallander MA, Johansson S, Fiocca R, Casanova S, Farahmand BY, Winchester CC, Roda E, Bazzoli F. Gastro-oesophageal reflux symptoms, oesophagitis and Barrett’s oesophagus in the general population: the Loiano-Monghidoro study. Gut. 2008;57:1354–1359. doi: 10.1136/gut.2007.145177. [DOI] [PubMed] [Google Scholar]
- 54.Lee HL, Eun CS, Lee OY, Jeon YC, Sohn JH, Han DS, Yoon BC, Choi HS, Hahm JS, Lee MH, et al. Association between GERD-related erosive esophagitis and obesity. J Clin Gastroenterol. 2008;42:672–675. doi: 10.1097/MCG.0b013e31806daf64. [DOI] [PubMed] [Google Scholar]
- 55.Nocon M, Labenz J, Jaspersen D, Meyer-Sabellek W, Stolte M, Lind T, Malfertheiner P, Willich SN. Association of body mass index with heartburn, regurgitation and esophagitis: results of the Progression of Gastroesophageal Reflux Disease study. J Gastroenterol Hepatol. 2007;22:1728–1731. doi: 10.1111/j.1440-1746.2006.04549.x. [DOI] [PubMed] [Google Scholar]
- 56.Moki F, Kusano M, Mizuide M, Shimoyama Y, Kawamura O, Takagi H, Imai T, Mori M. Association between reflux oesophagitis and features of the metabolic syndrome in Japan. Aliment Pharmacol Ther. 2007;26:1069–1075. doi: 10.1111/j.1365-2036.2007.03454.x. [DOI] [PubMed] [Google Scholar]
- 57.Kang MS, Park DI, Oh SY, Yoo TW, Ryu SH, Park JH, Kim HJ, Cho YK, Sohn CI, Jeon WK, et al. Abdominal obesity is an independent risk factor for erosive esophagitis in a Korean population. J Gastroenterol Hepatol. 2007;22:1656–1661. doi: 10.1111/j.1440-1746.2006.04518.x. [DOI] [PubMed] [Google Scholar]
- 58.Kim HJ, Yoo TW, Park DI, Park JH, Cho YK, Sohn CI, Jeon WK, Kim BI. Influence of overweight and obesity on upper endoscopic findings. J Gastroenterol Hepatol. 2007;22:477–481. doi: 10.1111/j.1440-1746.2006.04494.x. [DOI] [PubMed] [Google Scholar]
- 59.Wilson LJ, Ma W, Hirschowitz BI. Association of obesity with hiatal hernia and esophagitis. Am J Gastroenterol. 1999;94:2840–2844. doi: 10.1111/j.1572-0241.1999.01426.x. [DOI] [PubMed] [Google Scholar]
- 60.Hampel H, Abraham NS, El-Serag HB. Meta-analysis: obesity and the risk for gastroesophageal reflux disease and its complications. Ann Intern Med. 2005;143:199–211. doi: 10.7326/0003-4819-143-3-200508020-00006. [DOI] [PubMed] [Google Scholar]
- 61.Locke GR, Talley NJ, Fett SL, Zinsmeister AR, Melton LJ. Prevalence and clinical spectrum of gastroesophageal reflux: a population-based study in Olmsted County, Minnesota. Gastroenterology. 1997;112:1448–1456. doi: 10.1016/s0016-5085(97)70025-8. [DOI] [PubMed] [Google Scholar]
- 62.El-Serag HB, Ergun GA, Pandolfino J, Fitzgerald S, Tran T, Kramer JR. Obesity increases oesophageal acid exposure. Gut. 2007;56:749–755. doi: 10.1136/gut.2006.100263. [DOI] [PMC free article] [PubMed] [Google Scholar]
- 63.El-Serag HB, Tran T, Richardson P, Ergun G. Anthropometric correlates of intragastric pressure. Scand J Gastroenterol. 2006;41:887–891. doi: 10.1080/00365520500535402. [DOI] [PubMed] [Google Scholar]
- 64.Wu JC, Mui LM, Cheung CM, Chan Y, Sung JJ. Obesity is associated with increased transient lower esophageal sphincter relaxation. Gastroenterology. 2007;132:883–889. doi: 10.1053/j.gastro.2006.12.032. [DOI] [PubMed] [Google Scholar]