

Abstract
Histamine is among the most poorly understood biogenic amines, yet the histaminergic system spreads throughout the brain and has been implicated in functions as diverse as homeostasis and synaptic plasticity. Not surprisingly then, it has been linked to a number of conditions including minimally conscious state, persistent vegetative state, epilepsy, addiction, cluster headache, essential tremor, and Parkinson’s disease. We have previously reported that the Wireless Instantaneous Neurotransmitter Concentration Sensing (WINCS) system can monitor dopamine, serotonin, and adenosine using fast-scan cyclic voltammetry (FSCV). Here, we demonstrate the expanded capability of the WINCS system to measure histamine. The optimal FSCV waveform was determined to be a triangle wave scanned between −0.4 and +1.4 V at a rate of 400 V/s applied at 10 Hz. Using this optimized FSCV parameter, we found histamine release was induced by high frequency electrical stimulation at the tuberomammillary nucleus in rat brain slices. Our results suggest that the WINCS system can provide reliable, high fidelity measurements of histamine, consistently showing oxidative currents at +1.3 V, a finding that may have important clinical implications.
1. Introduction
Histamine has a central role in vigilance, sleep and wakefulness.1 The histaminergic system consists of 64,000 cell bodies located in the tuberomamillary nucleus (TMN) of the posterior hypothalamus.2 While the nucleus is small, its projections are widespread, innervating almost all parts of the brain.3 Three histamine receptors have been characterized, all of which are G-protein coupled receptors.4 The H1 and H2 receptors are post-synaptic, while the H3 receptor is an inhibitory autoreceptor.5 Not surprisingly, given its wide-ranging projections, histamine has been shown to be important in numerous brain functions. Histamine is also associated with a wide range of disorders, including cluster headache, disorders of consciousness, epilepsy, addiction, essential tremor, and Parkinson’s disease.6, 7 Many of these conditions have been treated with varying levels of success by deep brain stimulation (DBS).8, 9 Despite its role in multiple processes and disorders, histamine has been less frequently studied compared to other biogenic amines, perhaps because it has traditionally been more difficult to measure.10 The ability to measure histamine has important clinical implications for the treatment of histamine-related disorders because DBS is thought to alter neurochemical release.
Neurochemical monitoring has been generally obtained by one of two dominant techniques, microdialysis and electrochemical recording. Unlike microdialysis, electrochemical methods provide sub-second temporal and sub-millimeter spatial resolutions and can support direct measurement of analytic substrates at an implanted probe by detecting the oxidation and reduction currents of molecules. Fast-scan cyclic voltametry (FSCV) is an electrochemical technique that relies on Faradaic principles.14 In previous publications using FSCV, the presence of histamine has been determined by an oxidation peak current at +1.3 V.15, 16 In this study, FSCV was conducted using the Wireless Instantaneous Neurotransmitter Concentration Sensing (WINCS) system. WINCS system has already proven its utility for both in vitro and in vivo monitoring of the neurotransmitters dopamine, serotonin and adenosine.17–19 Here, we demonstrate its ability to measure histamine in vitro in both flow cell analysis and in rat brain slices, including in the TMN, upon electrical stimulation.
2. Experimental Methods
Wireless Fast Scan Cyclic Voltammetry (FSCV)
All experiments were performed using the previously described in-house built WINCS system, which was designed to perform electrochemical monitoring.17–20 WINCS hardware combines FSCV with digital telemetry to perform real-time electrochemical measurements at a carbon fiber microelectrode (CFM). It incorporates front-end analog circuitry for FSCV, a microprocessor, Bluetooth radio and a rechargeable lithium-polymer battery on a single printed circuit board. The device uses a trans-impedance amplifier to convert recorded current to voltage and a difference amplifier to subtract a triangular waveform potential applied to the CFM. A digital-to-analog converter applies the FSCV waveform to the CFM, and an analog-to-digital converter samples currents at a rate of 100 kilosamples per second. This data is then translated for use in LabVIEW (National Instruments, Austin, TX, USA).
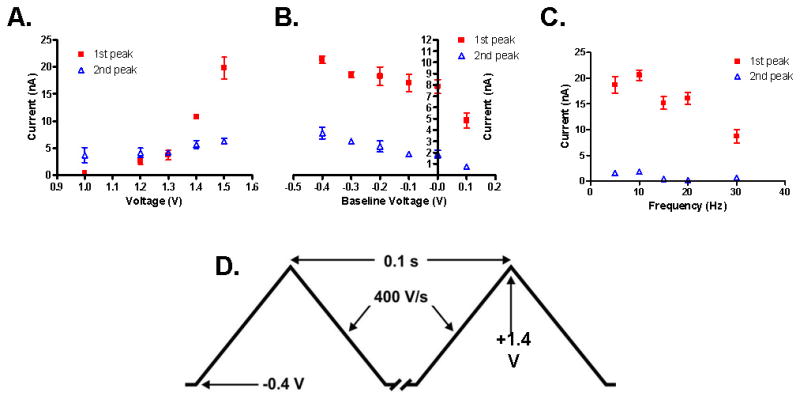
As shown in Fig. 2D, the parameters used here for FSCV consist of a linear potential ramp applied to the CFM every 0.1 s between −0.4 V and +1.4 V at a scan rate of 400 V/s. Under these conditions, the temporal resolution is accurate to 9.1 ms. The CFM is held at the baseline potential of −0.4 V between scans. During the parameter optimization trials, the rest of the parameters were set to those listed above except in the case of the carbon fiber type optimization in which +1.5 V was used for the peak voltage. Ag/AgCl reference electrodes were prepared by chlorinating a 31 g Teflon-coated silver wire (A-M Systems, Inc., Carlsborg, WA).21
Fig. 2.
Optimization of various measurement parameters and ideal histamine waveform. For all points, 10 uM histamine was used and repeated for three trials. A. Peak voltage varied from +1.0 V to +1.6 V. Other variables were kept constant. B. Baseline voltage varied from −0.4 V to +0.1 V. C. Frequency varied from 5–30Hz. D. Illustration of final waveform used for histamine detection.
The CFM was constructed by aspirating a single polyacrylonitrile-based carbon fiber into a borosilicate glass capillary tube and pulling it to a microscopic tip using a pipette puller. Three different carbon fibers were tested in this study: (1) Amoco T-650 from Onifer Inc., Greenville, SC, diam. 5 μm; (2) Cytec T-300 from Cytec Carbon Fiber LLC, Greenville SC, diam. 5 μm; and (3) Hexcel IM-7 from Hexcel corp., Decatur, AL, diam. 5 μm. The exposed carbon fiber was then cut to a length of approximately 80 μm, under a dissecting microscope.
Flow Injection Analysis
Flow injection analysis was used both to investigate the optimal parameter for histamine measurement and to post-calibrate the CFMs used for in vitro slice recording. A single CFM was placed in a flowing stream of Tris-buffer solution (150 mM sodium chloride and 12 mM Tris-base buffer at a pH 7.4), pumped at a rate of 2 ml/min, and an analyte (histamine, a potential interfering agent, or a combination of the two) was injected as a bolus. An Ag/AgCl reference electrode was located in the bottom of the reservoir immersed in the buffer solution. An electronic 1 ml loop injector, locally fabricated, introduced the analyte to the bolus for 10 s.
Histamine, adenosine, N-methylhistamine dihydrochloride, 4-imadazoleacetic acid hydrochloride, dopamine hydrochloride and D-histidine were purchased from Sigma-Aldrich (St. Louis, MO). Histamine was dissolved in 0.1 N perchloric acid to make a 10 mM stock solution, as were dopamine, imadazoleactic acid, methylhistamine, and histidine. Adenosine was dissolved in distilled water into a 5 mM stock. All stock solutions were diluted with the Tris-buffer solution, immediately before the flow injection experiments. All dopamine solutions were kept in the dark.
In vitro rat brain slice preparation
Rats were housed under standard conditions with ad libitum access to food and water. Care was provided in accordance with NIH guidelines and approved by the Mayo Clinic Institutional Animal Care and Use Committee. For the preparation of slices, 6-t o 8-week-old male Sprague-Dawley rats were deeply anaesthetized with pentobarbital (1.5 g/kg, IP) and sacrificed by decapitation. The brain was rapidly removed and put into a chilled (4°C) slicing medium composed of artificial cerebrospinal fluid (ACSF) from which NaCl had been removed and substituted with sucrose. Slices (400 μm thick) were cut in the coronal plane using a vibratome (Leica, Wetzlar, Germany). The slices were then placed in an interface-style recording chamber (Fine Sciences Tools, Foster City, CA, USA), maintained at 35 °C, and allowed to recover for at least 2 hr. For the first 15 min that the slices were in the recording chamber, an equal mixture of ACSF and the slicing medium was perfused, and then ACSF alone was perfused. ACSF contained (in mM): NaCl, 126; KCl, 2.5; MgSO4, 1.2; NaH2PO4, 1.25; CaCl2, 2.4; NaHCO3, 26; HEPES, 20; D-glucose, 10. The ACSF was aerated with 95% O2 and 5% CO2 to a final pH of 7.4 and adjusted to a final osmolarity of 307 mOsm.
Electrical stimulation
A series of 60 monophasic current pulses (150 μA, 2 ms pulse duration) were delivered to a twisted bipolar stimulating electrode (Plastics One, MS 303/2, Roanoke, VA, USA) at a frequency of 60 Hz using an isolator and programmable pulse generator (Iso-Flex / Master-8; AMPI, Jerusalem, Israel). Stimulations were separated by 5 minutes, which caused no decrease in extracellular concentration measured in subsequent trials. Once the twisted stimulating electrode was positioned on the surface of TMN, a CFM was inserted 75 – 100 μm into the slice at approximately 100 μm from the center of the stimulating electrode. Electrodes were positioned using a stereo-microscope (SMZ745T, Nikon, Japan).
3. Results
Wireless histamine measurement using WINCS
To investigate the functionality and feasibility of measuring histamine using WINCS, a known concentration of histamine (10 μM) was injected into the flow cell analysis system. Initially, FSCV measurements were made using a triangle-shaped waveform, ramping from −0.4 V to +1.4 V and back at 400 V/s.15, 16 Fig. 1 shows the ability of WINCS-applied FSCV at a CFM to measure histamine (n = 20 trials). The color plot shows time on the x-axis and the applied potentials on the y-axis. The color gradient represents the resulting current changes detected at the CFM (Fig. 1A). Consistent with previous reports two oxidation peaks were obtained. 15, 16 At approximately +1.3 V and +0.8 V, the light-brown color representing the background current can be seen to change to green and purple, respectively, for 10 s, representing oxidation peak currents generated by the injection of histamine into the flow cell. Oxidation peak currents remained consistent throughout the time of injection (Fig. 1B). Fig. 1C shows the raw voltametric currents, including background currents, which are present due to the double layer capacitance at the tip of the CFM. The faradaic current occurring immediately after injection of 10 μM histamine (red dotted line) was barely detectable in the raw voltametric currents (Fig. 1C). However, once the background current was subtracted, the faradaic current could be isolated to reveal the voltametric signature, which is called the cyclic voltammogram (CV) (Fig. 1D). The voltametric signature of histamine is evidence that histamine’s presence did, in fact, have an effect on the current at the tip of the CFM, with noticable increases at +1.3 V and around +0.8 V. The oxidation current at +1.3 V was sharp and clear, and the amplitude of this oxidation current proportionally increased as the concentration of histamine increased (Fig. 4C). In FSCV, the oxidation potentials are often shifted in time because of the time it takes for electron transfer.11, 22 Thus, an electron transfer time-delay might have caused the oxidation current to appear on the reverse scan.
Fig. 1.
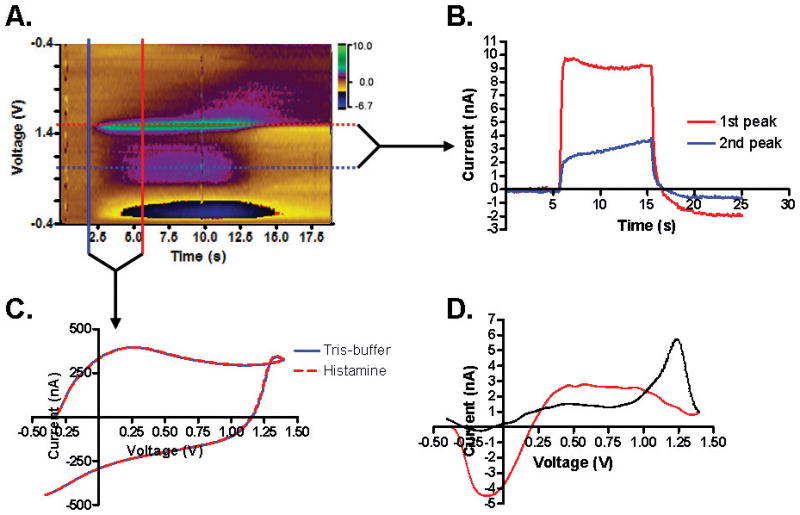
Wireless detection of histamine using WINCS at a CFM in vitro. A. Color plot obtained during a 10s flow cell injection of histamine. FSCV triangle waveform was applied from −0.4 V to +1.4 V at 400 V/s every 100 ms. The primary oxidation current (red, dotted line) occurs at about +1.3 V, and the auxiliary current (blue, dotted line) is centered at approximately +0.8 V. B. Plot showing the current measured by the CFM over the time-course of the injection, keeping the voltage constant at the red dotted line for the primary oxidation peak and at the blue dotted line for the auxiliary peak. C. Current versus time traces indicating only small magnitude current changes from the background with the solid blue line held at a constant time before injection, indicated by the solid blue line in A and the total current after injection at a time during the injection of 10 μM histamine at a fixed time indicated by the solid red line in A. D. Cyclic voltammogram (CV) of histamine, which is the background-subtracted current trace. The red line indicates the current trace acquired during the forward scan; the black line indicates the current trace acquired during the backward scan.
Fig. 4.

Concentration dependency of the electrochemical signal for histamine. A. Color plots of histamine concentration obtained using flow cell injections. B. Averaged time / current plots of sample concentrations with voltage held constant at the first oxidation peak (+1.3V). C. The calibration curve displays a linear trend for both primary oxidation currents (r2 = 0.92) and auxiliary currents (r2 = 0.86).
The peak that occurred at around +0.8V appeared in a broad range of applied potentials between +0.5 V and +0.8 V. It was much smaller in amplitude than the oxidation current at +1.3 V, and the amplitude was not significantly related to histamine concentration. Because it did not increase concurrently with increased histamine concentration, it is possible that the +0.8 current was a non-Faradic oxidation peak. Thus, we labeled the former (at +1.3V) as a primary oxidation current and the latter (+0.8 V) as an auxiliary current.
In addition, a negative deflection was observed at −0.2 V. As has been shown in other biological system FSCV studies,23 such a negative deflection may reflect the small changes in pH detected in physiological processes. Although we used an in vitro flow cell system, it is likely that the negative deflection we found at −0.2 V occurred because the histamine was dissovled with 0.1 N perchloric acid to make a 10 mM stock solution.
Parameter Optimization
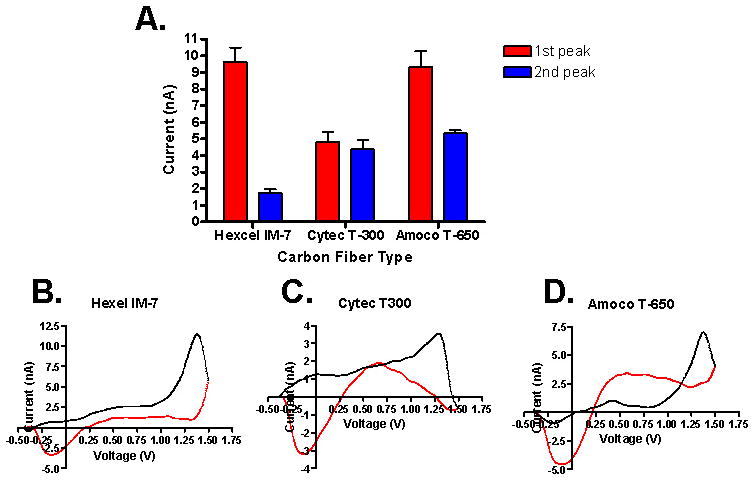
To optimize the FSCV waveform, we varied the switching potential between +1.0 and +1.5 V, the resting potential applied to the CFM between −0.4 and +0.1 V, and the repetition frequency between 5 and 30 Hz. First, the resting potential was held constant at −0.4 V and the switching potential was made more positive in +0.1 V increments from +1.0 V to +1.5 V (Fig. 2). As the switching potential was made more positive, the first oxidation peak current of histamine also increased (Fig. 2A). Based on this result, it would be natural to choose +1.5 V as the peak potential, but because the oxidation peak of adenosine could also be seen at the same position, we optimized this parameter at +1.4 V to ensure a distinguishable signal from that of adenosine. In addition, Fig. 2 demonstrates that histamine’s auxiliary peak current is not dependent upon the primary oxidation current. Even when the primary oxidation current was nearly extinguished at +1.2 V and gave no discernible signal at +1.0 V, the auxiliary current remained relatively stable. For the second step, various baseline voltages from −0.4 to +0.1 V were tested as the level for the holding potential (Fig. 2B). As the holding potential moved to a positive value, the amplitude of oxidation currents decreased (Fig. 2B). Fig. 2C demonstrates that the signal strength of both peaks is also inversely related to the frequency of scanning. This allows extra recovery time for the already-oxidized histamine to move away from the electrode surface and more histamine to adsorb to the carbon fiber surface before the scan is repeated. Fig. 2D represents the final waveform, integrating all of the Having demonstrated that WINCS was capable of FSCV measurements of histamine in vitro, Fig. 3 shows the difference in FSCV signals from a variety of carbon fiber types. The three carbon fibers which we used in this study were made of polyacrylonitrile carbon as a precursor material. The difference among three was the amount of carbon in each. T-650 and Hexel-IM7 have a higher carbon content by 2 % and 3 %, respectively, compared to T-300. In our in vitro flow cell experiments, Hexel-IM7 showed the largest primary and smallest auxiliary currents needed to detect histamine. However, we chose T-650 to fabricate our CFM for histamine measurement because the CV of histamine detected at the Hexel-IM7 was similar to the CV of hydrogen peroxide, showing a single oxidation current at the switching potential.24,25 T-650 also showed additional auxiliary currents characteristic of histamine. Thus, with T-650, histamine could be easily distinguished from hydrogen peroxide and adenosine in in vitro brain slices and in vivo experimental set-ups. Using the T-650, adenosine was identified with two clear oxidation peaks at +1.0 and +1.5V.19, 22 It was also found that a pre-treatment of the CFM for 15 s in 0.1 M NaOH, scanned at 300 V/s from +0.1 V to +1.4 V, increased the signal of both the primary and auxiliary peaks significantly. This procedure likely causes more oxide groups to be present on the CFM and thus increases the ability of histamine to adsorb to the sensing region of the electrode.
Fig. 3.
Comparison of carbon fiber types on histamine signal. For all carbon fibers, r = 2.5 – 3.5 μm, and length of the sensing region was between 50 μm and 80 μm. A. Comparison graph of the maximum signal achieved during injection for the different carbon fiber types. B. Hexel IM-7 background subtracted CV. C. Cytec T-300 background subtracted CV. D. Amoco T-650 background subtracted CV.
Concentration Dependency
After these parameters were optimized, the ideal waveform seen in Fig. 2D was used to construct a calibration curve for histamine. The color plots in Fig. 4A show an increase in signal for both oxidation peaks as concentration increases. In Fig. 4B, the plot shows the current measured over the time course of the injection (averaged over n = 3 trials), demonstrating that the signals were consistent across the time-course of the injection. Fig. 4C shows the linearity of the signal strength in relation to the concentration between 100 nM to 10 μM (r2 = 0.92 for the first peak and 0.86 for the second peak). Both Fig. 4B and 4C suggest that histamine can be reliably detected at a concentration of 100 nM. In our experimental set-up, the glass insulated CFM was unable to detect histamine at physiologic concentrations lower than 100 nM. An investigation of lower concentrations would require a more sensitive CFM.
Selectivity
Before the above parameters could be used for in vivo or brain slice recording it was important to ensure that the voltammetric signal for histamine would be distinct from other compounds that might co-localize with histamine in an animal brain model. For that reason, we performed FSCV using the histamine parameter shown in Fig. 2D to identify the characteristic CV of members of the histamine metabolic pathway. Both imidazoleacetic acid, a direct histamine metabolite, and histidine, the precursor to histamine production, proved to be electrically inactive and thus would not be expected to interfere with histamine measurement (Fig. 5B and 5F, respectively). Methylhistamine, another direct metabolite of histamine, however, had a curve characteristic of histamine itself, albeit with a slightly lower signal (Fig. 5C). While it would be impossible to distinguish the two compounds using FSCV recording, it is of note that methylhistamine’s extracellular concentration is dependent on histamine release.
Fig. 5.

Comparison of histamine’s CV to other compounds which might act as interference in vivo. The red line indicated the forward portion of the triangle-wave scan, while the black line indicated the backward portion for all plots. Recordings are included for (A) 10 μM histamine, (B) 10 μM imadazoleacetic acid, (C) 10 μM methylhistamine, (D) 10 μM dopamine, (E) 10 μM adenosine, (F) 10 μM histidine, (G) 10 μM histamine and 1μM dopamine, (H) 10 μM histamine and 10μM adenosine, and (I) post-experimental summation of (A) and (E).
In addition to these metabolites, we also used the optimized parameters determined above to test dopamine and adenosine, two neurotransmitters which could be co-localized with histamine in the brain. Dopamine (Fig. 5D) produced a strong oxidation current at about +0.6 V on the forward scan (shown in red). Thus, it is unlikely that it interfered with histamine’s first oxidation peak, which occurred during the backward portion of the scan (shown in black – Fig. 5A) and at a substantially higher voltage (+1.3 V). Adenosine also had the potential to interfere with the histamine signal because its main oxidation peak is located near the switching potential. Adenosine began to be oxidized at +1.5 V. By limiting the peak voltage of the scan to +1.4 V, however, the adenosine signal was weak enough that its background subtracted CV was not likely to be confused with that of histamine (Fig. 5E).
Because it is able to distinguish oxidizable compounds from one another, FSCV enables co-detection of compounds. Enzyme-linked biosensors, on the other hand, which have excellent specificity, allow the measurement of only one compound at a time. Both the primary peak of histamine and the oxidation and reduction peaks of dopamine are evident in Fig. 5G. However, Fig. 5H shows that, using the optimal parameter for histamine (Fig. 2D), simultaneous detection of adenosine was not possible because, as noted above, adenosine does not oxidized at potentials lower than +1.5 V with FSCV. Initially, we expected that the amplitude of the oxidation current at +1.3 V would be the simple summation of the histamine and adenosine oxidation currents at +1.3 V (Fig. 5I). However, the oxidation current at +1.3 V was smaller than the simple sum. The auxiliary current of histamine at around +0.8 V was notably decreased, possibly because the current was being compromised by the presence of adenosine. Clearly, a biogenic molecule can interfere with the oxidation of other biogenic molecules. Further study is needed to determine the factors that interfere in detecting oxidation currents between different molecules, such as histamine and adenosine (Fig. 5H).
Histamine measurements in rat tuberomamillary nucleus brain slice
In addition to in vitro measurements, extracellular histamine was measured in rat brain slices following electrical stimulation of the tuberomamillary nucleus (TMN). Electrical stimulation (150 μA, 2 ms pulse duration, at 60 Hz) was delivered to the slice, and the resulting color plot (Fig. 6A) and CV (Fig. 6C) were obtained. By comparing these results with the known plots and voltammogram of histamine (Fig. 3), one can see that the detected signal evoked by electrical stimulation in the TMN slice is very close to that of histamine (Fig. 6D). Further study is needed to determine the temporal profile of the histamine release and to confirm its identity through pharmacology.
Fig. 6.

Histamine release evoked by electrical stimulation (150 μA, 60 Hz, 2 ms pulse width, for 1 sec) in rat tuberomamillary nucleus (TMN). A. Pseudo-color plot shows oxidation peak currents generated upon high frequency stimulation. B. Oxidation peak currents at +1.4 V (red trace) and +0.8 V (blue trace) versus time. C. Raw currents including background current before and after stimulation. D. Background subtracted CV.
4. Discussion
Traditionally, microdialysis has been used to measure histamine.26 This study demonstrated that FSCV using the WINCS system is an equally reliable means of determining a distinguishable histamine waveform and that it can do so with high temporal-spatial resolution, and sensitivity. FSCV has been used in other studies as well to get a more temporally sensitive measure of histamine.15, 16 For example, Hashemi, et al. measured histamine following CFM stimulation of the medial forebrain bundle27 and distinguished the primary oxidation peak at +1.3V. In this study, we demonstrated that histamine release can be evoked by high-frequency electrical stimulation of the TMN in rat brain slices, as a clinical therapeutic model of DBS. Our results show a consistent histamine CV. The optimization of the histamine waveform parameters allowed detection of concentrations of histamine as low as 100 nM.
Of note, the large negative current at −0.2 V seen in Fig. 6 was no stronger than the current obtained in the flow cell system with histamine dissolved in perchloric acid. If electrical stimulation evokes a shift in the environmental pH from base to acid, it would be expected to increase the negative current at −0.2 V.23 Because we found the overall current at −0.2 V was decreased, it is likely that the electrical stimulation pushed the environmental pH from acid to base in our experimental set-up. Further study is needed to investigate the impact of electrical stimulation as well as the physiological neurotransmission process on the pH shift.
The WINCS system was designed for use in human neurochemical monitoring during DBS surgery. Its ability to measure histamine efflux could help elucidate the mechanisms of DBS and improve its clinical benefit. Relative to PVS and MCS, histamine has long been known to be a “waking substance” involved in the control of vigilance, sleep and wakefulness.1, 28 The TMN, the seat of the histaminergic system, is activated during wakefulness and inactivated during sleep.29–31 TMN inactivation causes hypersomnia and reduces arousal and attention,32 while increased activity in TMN projection to the thalamus dampens oscillations during the sleep/wake transition.33 The fact that TMN activation and higher extracellular concentrations of histamine are positively correlated with wakefulness34, 35 suggests that activating TMN or increasing brain histamine levels might restore appropriate levels of arousal in people with PVS or MCS. Our study indicates that electrical stimulation, such as that used in DBS, can evoke local histamine efflux. Further research may help explain the mechanisms of DBS for PVS and MCS so as to improve targeting and stimulation parameters and optimize what is currently a promising but imperfect treatment.
Another histamine-related disorder for which DBS is used is cluster headache. The relationship between headache and histamine was first described by B.T. Horton who used the term “histaminic cephalalgia.”36 Twenty percent of patients who suffer from this debilitating headache disorder remain disabled following pharmacological treatment. When remission occurs in chronic cases, it may last as few as 30 days.37 DBS administered to posterior hypothalamus, the same region in which the TMN lies, has been found to provide symptom relief in many but not all patients.38–44 As in PVS and MCS, better understanding the relationship between DBS and histamine release could improve clinical outcomes for cluster headache.
The WINCS FSCV system could also be used to investigate the role of histamine in normal physiology and brain functions, such as learning and memory, synaptic plasticity and homeostatic functions. As an example, the mechanism and kinetics of histamine release and reuptake have been poorly understood relative to dopamine. Finally, the WINCS system might improve understanding of the relationships between biogenic amines in normal and disordered brain processes.
5. Conclusions
In this study, we demonstrated that the WINCS FSCV system can monitor histamine effectively. Histamine can be identified by a sharp oxidation peak current at +1.3 V and broad current at around +0.8 V. Histamine measurement might improve our understanding of the histaminergic system in disease states as well as normal physiological states. The real-time neurotransmitter monitoring capability provided by the WINCS system may also help to reveal underlying neuromodulatory mechanisms of DBS action.
Acknowledgments
This work was supported by: NIH (K08 NS 52232, R01 NS 70872, and R01 NS 75013 award to KHL). We acknowledg with special thanks the engineering team who developed WINCS; Christopher J. Kimble, April E. Horn, Sidney V. Whitlock, Kenneth R. Kressin, and Kevin E. Bennet. We also acknowledge Penelope Duffy, Ph.D. and Daniel A. Clayton, M.D. for their help in editing the manuscript.
References
- 1.Onodera K, Yamatodani A, Watanabe T, Wada H. Progress in neurobiology. 1994;42:685–702. doi: 10.1016/0301-0082(94)90017-5. [DOI] [PubMed] [Google Scholar]
- 2.Brown RE, Stevens DR, Haas HL. Progress in neurobiology. 2001;63:637–672. doi: 10.1016/s0301-0082(00)00039-3. [DOI] [PubMed] [Google Scholar]
- 3.Panula P, Yang HY, Costa E. Proceedings of the National Academy of Sciences of the United States of America. 1984;81:2572–2576. doi: 10.1073/pnas.81.8.2572. [DOI] [PMC free article] [PubMed] [Google Scholar]
- 4.Hill SJ, Ganellin CR, Timmerman H, Schwartz JC, Shankley NP, Young JM, Schunack W, Levi R, Haas HL. Pharmacological reviews. 1997;49:253–278. [PubMed] [Google Scholar]
- 5.Arrang JM, Garbarg M, Schwartz JC. Nature. 1983;302:832–837. doi: 10.1038/302832a0. [DOI] [PubMed] [Google Scholar]
- 6.Brabant C, Alleva L, Quertemont E, Tirelli E. Progress in neurobiology. 2010;92:421–441. doi: 10.1016/j.pneurobio.2010.07.002. [DOI] [PubMed] [Google Scholar]
- 7.Passani MB, Blandina P. Trends in pharmacological sciences. 2011;32:242–249. doi: 10.1016/j.tips.2011.01.003. [DOI] [PubMed] [Google Scholar]
- 8.Lyons MK. Mayo Clin Proc. 2011;86:662–672. doi: 10.4065/mcp.2011.0045. [DOI] [PMC free article] [PubMed] [Google Scholar]
- 9.Shah RS, Chang SY, Min HK, Cho ZH, Blaha CD, Lee KH. J Clin Neurol. 2010;6:167–182. doi: 10.3988/jcn.2010.6.4.167. [DOI] [PMC free article] [PubMed] [Google Scholar]
- 10.Haas HL, Sergeeva OA, Selbach O. Physiological reviews. 2008;88:1183–1241. doi: 10.1152/physrev.00043.2007. [DOI] [PubMed] [Google Scholar]
- 11.Baur JE, Kristensen EW, May LJ, Wiedemann DJ, Wightman RM. Analytical chemistry. 1988;60:1268–1272. doi: 10.1021/ac00164a006. [DOI] [PubMed] [Google Scholar]
- 12.Robinson DL, Venton BJ, Heien ML, Wightman RM. Clin Chem. 2003;49:1763–1773. doi: 10.1373/49.10.1763. [DOI] [PubMed] [Google Scholar]
- 13.Robinson DL, Wightman RM. In: Electrochemical Methods for Neuroscience. Michael AC, Borland LM, editors. Boca Raton (FL): 2007. [Google Scholar]
- 14.Wipf DOK, Deakin EW, Wightman MR, RM Analytical chemistry. 1998;60:306–310. [Google Scholar]
- 15.Pihel K, Hsieh S, Jorgenson JW, Wightman RM. Analytical chemistry. 1995;67:4514–4521. doi: 10.1021/ac00120a014. [DOI] [PubMed] [Google Scholar]
- 16.Pihel K, Hsieh S, Jorgenson JW, Wightman RM. Biochemistry. 1998;37:1046–1052. doi: 10.1021/bi9714868. [DOI] [PubMed] [Google Scholar]
- 17.Agnesi F, Tye SJ, Bledsoe JM, Griessenauer CJ, Kimble CJ, Sieck GC, Bennet KE, Garris PA, Blaha CD, Lee KH. J Neurosurg. 2009;111:701–711. doi: 10.3171/2009.3.JNS0990. [DOI] [PMC free article] [PubMed] [Google Scholar]
- 18.Griessenauer CJ, Chang SY, Tye SJ, Kimble CJ, Bennet KE, Garris PA, Lee KH. J Neurosurg. 2010;113:656–665. doi: 10.3171/2010.3.JNS091627. [DOI] [PMC free article] [PubMed] [Google Scholar]
- 19.Shon YM, Chang SY, Tye SJ, Kimble CJ, Bennet KE, Blaha CD, Lee KH. J Neurosurg. 2010;112:539–548. doi: 10.3171/2009.7.JNS09787. [DOI] [PMC free article] [PubMed] [Google Scholar]
- 20.Bledsoe JM, Kimble CJ, Covey DP, Blaha CD, Agnesi F, Mohseni P, Whitlock S, Johnson DM, Horne A, Bennet KE, Lee KH, Garris PA. J Neurosurg. 2009;111:712–723. doi: 10.3171/2009.3.JNS081348. [DOI] [PMC free article] [PubMed] [Google Scholar]
- 21.Garris PA, Christensen JR, Rebec GV, Wightman RM. Journal of neurochemistry. 1997;68:152–161. doi: 10.1046/j.1471-4159.1997.68010152.x. [DOI] [PubMed] [Google Scholar]
- 22.Swamy BE, Venton BJ. Analytical chemistry. 2007;79:744–750. doi: 10.1021/ac061820i. [DOI] [PubMed] [Google Scholar]
- 23.Takmakov P, Zachek MK, Keithley RB, Bucher ES, McCarty GS, Wightman RM. Analytical chemistry. 2010;82:9892–9900. doi: 10.1021/ac102399n. [DOI] [PMC free article] [PubMed] [Google Scholar]
- 24.Roberts JG, Hamilton KL, Sombers LA. Analyst. 2011;136:3550–3556. doi: 10.1039/c1an15337d. [DOI] [PubMed] [Google Scholar]
- 25.Sanford AL, Morton SW, Whitehouse KL, Oara HM, Lugo-Morales LZ, Roberts JG, Sombers LA. Analytical chemistry. 2010;82:5205–5210. doi: 10.1021/ac100536s. [DOI] [PMC free article] [PubMed] [Google Scholar]
- 26.Flik G, Dremencov E, Cremers TI, Folgering JH, Westerink BH. Eur J Neurosci. 2011;34:1747–1755. doi: 10.1111/j.1460-9568.2011.07893.x. [DOI] [PubMed] [Google Scholar]
- 27.Hashemi P, Dankoski EC, Wood KM, Ambrose RE, Wightman RM. Journal of neurochemistry. 2011;118:749–759. doi: 10.1111/j.1471-4159.2011.07352.x. [DOI] [PMC free article] [PubMed] [Google Scholar]
- 28.Monnier M, Fallert M, Battacharya IC. Experientia. 1967;23:21–22. doi: 10.1007/BF02142244. [DOI] [PubMed] [Google Scholar]
- 29.John J, Wu MF, Boehmer LN, Siegel JM. Neuron. 2004;42:619–634. doi: 10.1016/s0896-6273(04)00247-8. [DOI] [PMC free article] [PubMed] [Google Scholar]
- 30.Parmentier R, Ohtsu H, Djebbara-Hannas Z, Valatx JL, Watanabe T, Lin JS. J Neurosci. 2002;22:7695–7711. doi: 10.1523/JNEUROSCI.22-17-07695.2002. [DOI] [PMC free article] [PubMed] [Google Scholar]
- 31.Takahashi K, Lin JS, Sakai K. J Neurosci. 2006;26:10292–10298. doi: 10.1523/JNEUROSCI.2341-06.2006. [DOI] [PMC free article] [PubMed] [Google Scholar]
- 32.Lin JS, Sakai K, Vanni-Mercier G, Jouvet M. Brain Res. 1989;479:225–240. doi: 10.1016/0006-8993(89)91623-5. [DOI] [PubMed] [Google Scholar]
- 33.Lee KH, Broberger C, Kim U, McCormick DA. Proceedings of the National Academy of Sciences of the United States of America. 2004;101:6716–6721. doi: 10.1073/pnas.0400817101. [DOI] [PMC free article] [PubMed] [Google Scholar]
- 34.Chu M, Huang ZL, Qu WM, Eguchi N, Yao MH, Urade Y. Neurosci Res. 2004;49:417–420. doi: 10.1016/j.neures.2004.05.001. [DOI] [PubMed] [Google Scholar]
- 35.Strecker RE, Nalwalk J, Dauphin LJ, Thakkar MM, Chen Y, Ramesh V, Hough LB, McCarley RW. Neuroscience. 2002;113:663–670. doi: 10.1016/s0306-4522(02)00158-6. [DOI] [PubMed] [Google Scholar]
- 36.Horton BT. J Lancet. 1952;72:92–98. [PubMed] [Google Scholar]
- 37.May A, Leone M. Curr Opin Neurol. 2003;16:333–340. doi: 10.1097/01.wco.0000073934.19076.0e. [DOI] [PubMed] [Google Scholar]
- 38.Bartsch T, Pinsker MO, Rasche D, Kinfe T, Hertel F, Diener HC, Tronnier V, Mehdorn HM, Volkmann J, Deuschl G, Krauss JK. Cephalalgia. 2008;28:285–295. doi: 10.1111/j.1468-2982.2007.01531.x. [DOI] [PubMed] [Google Scholar]
- 39.Leone M, Franzini A, Broggi G, Bussone G. Neurology. 2006;67:150–152. doi: 10.1212/01.wnl.0000223319.56699.8a. [DOI] [PubMed] [Google Scholar]
- 40.Leone M, Franzini A, Bussone G. N Engl J Med. 2001;345:1428–1429. doi: 10.1056/NEJM200111083451915. [DOI] [PubMed] [Google Scholar]
- 41.Leone M, Proietti Cecchini A, Franzini A, Broggi G, Cortelli P, Montagna P, May A, Juergens T, Cordella R, Carella F, Bussone G. Cephalalgia. 2008;28:787–797. doi: 10.1111/j.1468-2982.2008.01627.x. discussion 798. [DOI] [PubMed] [Google Scholar]
- 42.Schoenen J, Di Clemente L, Vandenheede M, Fumal A, De Pasqua V, Mouchamps M, Remacle JM, de Noordhout AM. Brain. 2005;128:940–947. doi: 10.1093/brain/awh411. [DOI] [PubMed] [Google Scholar]
- 43.Sillay KA, Sani S, Starr PA. Neurobiol Dis. 2010;38:361–368. doi: 10.1016/j.nbd.2009.05.020. [DOI] [PubMed] [Google Scholar]
- 44.Starr PA, Barbaro NM, Raskin NH, Ostrem JL. J Neurosurg. 2007;106:999–1005. doi: 10.3171/jns.2007.106.6.999. [DOI] [PubMed] [Google Scholar]