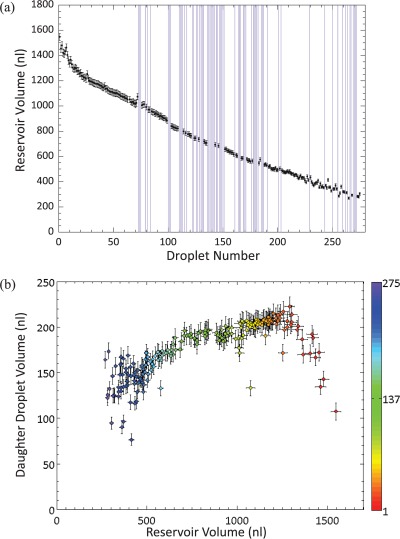
Figure 5.
(a) Variation in the volume of the reservoir droplet as a function of time. The volume measured represents the volume of the reservoir after a daughter droplet has been dispensed. The reservoir volume is initially 2 μl, but as the experiment progresses fluid from the reservoir evaporates. Vertical purple lines denote a failure to dispense. (b) The effect of the reservoir volume on the volume of the dispensed droplets. The colour scale represents the droplet number, with red being the first daughter droplet dispensed and purple being the last.

