Abstract
Here, we utilize microfluidic droplet technology to generate photopolymerizeable polyethylene glycol (PEG) hydrogel microbeads incorporating a fluorescence-based glucose bioassay. A microfluidic T-junction and multiphase flow of fluorescein isothiocyanate dextran, tetramethyl rhodamine isothiocyanate concanavalin A, and PEG in water were used to generate microdroplets in a continuous stream of hexadecane. The microdroplets were photopolymerized mid-stream with ultraviolet light exposure to form PEG microbeads and were collected at the outlet for further analysis. Devices were prototyped in PDMS and generated highly monodisperse 72 ± 2 μm sized microbeads (measured after transfer into aqueous phase) at a continuous flow rate between 0.04 ml/h—0.06 ml/h. Scanning electron microscopy analysis was conducted to analyze and confirm microbead integrity and surface morphology. Glucose sensing was carried out using a Förster resonance energy transfer (FRET) based assay. A proportional fluorescence intensity increase was measured within a 1–10 mM glucose concentration range. Microfluidically synthesized microbeads encapsulating sensing biomolecules offer a quick and low cost method to generate monodisperse biosensors for a variety of applications including cell cultures systems, tissue engineering, etc.
INTRODUCTION
Cell culturing is a common technique to grow cells in-vitro or optimize growth and/or product yield metrics for cells as a function of physiological parameters such as pH, oxygen, temperature, medium composition, etc.1 Glucose is an important ingredient in cell culture media (CCM), and accurate glucose monitoring during cell growth is important because cells grown outside of normal physiological glucose conditions (0–10 mM) can get modified by the processes of glycation and glyoxidation causing unwanted secondary modification of produced proteins.2, 3 Standard protocols to monitor glucose or oxygen concentrations in CCM require invasive and tedious handling of the sample for sterile media removal and can be very time consuming.4, 5 Miniaturized automated systems which can maintain cell viability and where biosensors can be embedded directly into cell culture systems or easily delivered to the culture can provide a level of local microenvironment monitoring that cannot be achieved under traditional culture conditions.6, 7
Optical glucose sensors integrated within such miniaturized culture systems provide an attractive alternative, because they enable glucose monitoring of sensitive samples with minimal disturbance. A fluorescein isothiocyanate dextran (FITC-dextran) and tetramethyl rhodamine isothiocyanate concanavalin A (TRITC-ConA) biomolecular system offers the potential to monitor glucose levels by relying on Förster resonance energy transfer (FRET) based quenching mechanism. Briefly, when TRITC-ConA (quencher) is introduced in a solution of FITC-dextran (fluorescer), TRITC-ConA reversibly attaches to FITC-dextran resulting in a sufficiently small (∼5 nm) Förster radius (defined as a distance at which energy transfer is 50% efficient). The small molecular proximity leads to quenching of the fluorescence signal of FITC-dextran. Addition of glucose to this system results in competitive binding of glucose to ConA and releases FITC-dextran from TRITC-ConA. Once released, FITC-dextran starts to fluoresce again thereby creating a homogeneous glucose assay (Figure 1).
Figure 1.
Working mechanism of FRET based glucose assay. Concanavalin A, a sugar binding protein, has a higher affinity for glucose than dextran. The small Förster radius between FITC-dextran and TRITC-ConA quenches the fluorescence signal emitted by FITC molecules. The increase in glucose concentration releases more FITC-dextran from ConA and thereby resulting in a proportional increase in the fluorescence signal.
Various fluorescence based assays have been developed in the past based on this principle. Meadows and Schultz8 were the first to develop a fluorescence assay in an aqueous system and use an optical biosensor to detect various glucose concentrations.9 Encapsulation of these compounds within an alginate/poly-L-lysine microbead was conducted by Cotè et al.10 but suffered from leakage and structural rigidity problems.
The use of polymeric materials with encapsulated biological components has provided a promising platform for the development of new biotechnology applications such as chemical sensing, cell encapsulation, drug delivery, etc.11, 12, 13 Among various types of polymeric materials, polyethylene glycol (PEG) has stood out due to its non-toxic, inert, and structurally rigid properties which enable it to be used in vivo. Also, due to its advantages over the alginate/poly-L-lysine based systems, various new techniques have been proposed to control the size and manipulation of PEG-based structures.14, 15 Traditional methods for synthesizing PEG beads use a syringe based system to extrude droplets into a bath of heavy mineral oil followed by an ultraviolet exposure.16, 17 Temenoff et al.18 used a thermal radical initiation method to synthesize PEG and encapsulate marrow stromal cells. An et al.19 developed a method to encapsulate PEG hydrogels inside the cavity of a liposome, extrude them through a membrane, and photopolymerize the contents. These proposed methods, however, have difficulties and limitations in generating a uniform size and shape of the microbeads.
Microfluidics has shown significant growth over the past decade to reproducibly produce confined and well-defined microchannels on the cellular length scale offering the unique ability to mimic in-vivo conditions.20, 21 Multiphase microfluidics22 involves the generation and/or manipulation of discontinuous phase droplets within a microchannel filled with an immiscible continuous phase. For polymer-based droplets, especially PEG, microfluidic devices with a T-junction or flow-focusing method can be combined with polymerization techniques (such as UV) to synthesize microbeads.15 Various groups have utilized such techniques to generate PEG particles.23, 24, 25 Among them, Doyle et al. have developed various modifications to generate polymeric particles with customized geometries using PEG.26, 27, 28 Their approach offers a high throughput method to generate these particles. However, it requires an additional masking step to lithographically define the geometry. A spherical microbead generated in a T-junction or flow focusing method offers simplicity and the added advantage of uniform sensing across its boundary.
In this study, we utilize a simple microfluidic T-junction geometry to generate PEG microbeads encapsulating FITC-dextran and TRITC-ConA bioconjugates. We utilize physical entrapping as compared to currently existing chemical crosslinking methods which require additional reagents. Flow conditions were carefully characterized with various continuous and discontinuous flow rates to generate stable droplets. Generated droplets were photopolymerized in-situ with UV light (230 nm) resulting in highly monodisperse 72 ± 2 μm microbeads in aqueous environments. Encapsulation of biomolecules was confirmed with confocal microscopy and introduction of 1–10 mM glucose concentrations showed a proportional response in the system’s fluorescence signal.
MATERIALS AND METHODS
Materials
Polyethylene glycol diacrylate (PEG-DA) (MW 575 Da), 2,2-dimethoxy-2-phenylacetophenone (DMPA) and hexadecane 99% anhydrous, FITC-dextran (MW 2000 kDa), d-(+) glucose, and Span 80 inch were purchased from Sigma-Aldrich. TRITC-ConA (MW 102 kDa) was obtained from Invitrogen (SU-8 2035 and SU-8 developers were purchased from MicroChem). Polydimethylsiloxane (PDMS) SYLGARD® 184 silicone elastomer kit was purchased from Dow Corning Inc.
Mould fabrication
The mould pattern was drawn using CADENCE® VIRTUOSO® software and printed on a plastic photomask for photolithography. Standard one-step photolithography was carried out to fabricate the mould using SU-8 2035, a negative photoresist. SU-8 2035 was spin-coated on top of an 8 inch silicon wafer, baked, and patterned using UV photolithography. After the development, the mould was hard baked for 15 min at 200 °C and was treated with fluoroctyltriethoxysilane (FOTES) using chemical vapor deposition (CVD) to form a self assembled monolayer (SAM).
Soft-lithography
PDMS was prepared by mixing the base and curing agent in a 10:1 ratio. The mixture was mixed thoroughly and degassed for 40 min to remove air bubbles. The mixture was poured on the SU-8 mould and cured at 65 °C for two hours. Through-holes having 1.5 mm diameter were punched using Harris biopsy needles at the inlet and outlet ports of the microdevice. This patterned piece of PDMS was bonded to a flat piece of PDMS by exposing them in oxygen plasma for 30 s at 200 W. The device was kept overnight in a curing oven at 65 °C to improve the bond and to make the channels hydrophobic.
Preparation of reagents
PEG-DA solution was prepared by dissolving photocrosslinking agent (DMPA) at a concentration of 2% (w/v) in pure PEG-DA. The TRITC-ConA and FITC-dextran solutions were mixed in a ratio of 40:1 by mass in phosphate buffered saline (1× PBS) as mentioned previously.29 The PEG-DA solution and the above bioconjugate solutions (TRITC-ConA and FITC-dextran) were mixed in a ratio of 1:1 by volume. Hexadecane was mixed with a nonionic surfactant (Span 80) at 4% (v/v). The glucose solutions in the physiological range (1–10 mM) were prepared in 1× PBS.
Experimental setup
The microfluidic PDMS device was mounted on an upright microscope, Olympus BX41, for observation and for UV exposure for photocrosslinking. The reagents for microbead generation were loaded into two plastic syringes of different sizes (1, 3, or 5 ml) from Braun/Nippro/ Terumo Inc. and delivered through Fusion 200 syringe pumps from Chemyx Inc. The syringes were connected to the PDMS device with suitable plastic tubing. High speed images were acquired using a Rolera-XR camera from Qimaging Corp connected to an Olympus IX71 inverted microscope and saved using IMAGE PRO EXPRESS software. Software NIH-IMAGEJ was used for image processing.
Characterization of PEG microbeads and biosensing
Once generated, the microbeads were transferred from hexadecane into PBS by rinsing with 1× PBS, followed by centrifugation (250 rpm for 5 min) and re-suspension (3 times). Low centrifuge speed was used to ensure that capsules are not damaged during centrifugation. The microbeads were pipetted on a clean silicon wafer and dried for scanning electron microscopy (SEM) imaging. For glucose sensing, microbeads were pipetted on glass slides and incubated with 50 μl of different glucose concentrations for 15 min each. Results were obtained via brightfield and fluorescence microscopy. Precautions were taken to keep experimental conditions constant (e.g., exposure times and dark room observations). FITC filter (Ex. = 490 nm and Em. = 525 nm) was used for FITC-dextran. TRITC filter (Ex. = 557 nm and Em. = 576 nm) was used for TRITC-ConA. The dimensions of the UV zone were 800 μm × 100 μm.
RESULTS AND DISCUSSION
Working of the device
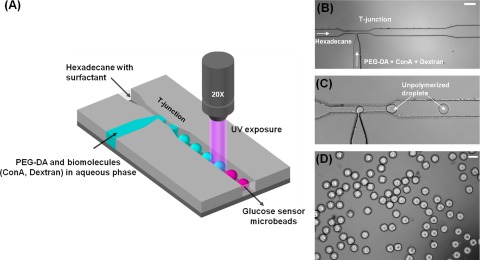
Figure 2a represents a schematic overview of the microfluidic device. The simple design consisted of a T-junction and a 2 cm long channel (to avoid polymerization at the T-junction). The T-junction had two inputs: (1) a narrowing microchannel (50 μm wide × 100 μm deep) for injecting hexadecane mixed with Span 80 (2) a nozzle shaped microchannel (30 μm wide × 100 μm deep) for injecting aqueous PEG-DA encapsulating TRITC-ConA and FITC-dextran. The surfactant, Span 80, plays an important role as it wets the hydrophobic walls of the microchannels ensuring that droplets do not adhere to the walls. Additionally, it also helps in avoiding droplet coalescence, thereby improving monodispersity.
Figure 2.
(A) Schematic for the generation of PEG based glucose sensing microbeads showing two inlets at the T-junction to form droplets encapsulating PEG-DA and biomolecules in an aqueous phase. The droplets were photopolymerized by UV light illuminated from a 20× microscope lens to form PEG microbeads. (B) Photomicrograph of T-junction exhibiting two inlets for droplet generation (Scale bar = 200 µm). (C) Generation of unpolymerized PEG-DA droplets at the T-junction. (D) Photopolymerized PEG-DA microbeads collected outside the microdevice (Scale bar = 100 µm).
Figures 2b, 2c present actual micrographs of the T-junction and droplet generation, respectively. Monodisperse droplets were generated by shearing PEG-DA discontinuous phase by a viscous, inert, and continuous phase of hexadecane (density = 0.773 g/ml). The droplets travelled down the microchannel and were illuminated with a focused beam of UV light in situ which resulted in instant photoactivated polymerization of these droplets to form PEG hydrogel microbeads. The PEG-DA was crosslinked by using up to 2% DMPA crosslinker in the solution. The photomicrograph of PEG-DA microbeads collected in a hexadecane solution outside of the microdevice is shown in Figure 2d.
Characterization of droplet generation
Droplet generation/breakup mechanisms and parameters have been studied extensively in the past.30, 31 It has been shown that for a T-junction geometry involving "confined" breakup of droplets, the size of the droplets is mostly dependent upon the flow rates of continuous and discontinuous phases rather than the capillary number, Ca.30 In our device, droplet generation was characterized by keeping parameters such as capillary pressure and channel geometry constant, while varying the flow rates of the continuous and discontinuous phases (Qc and Qd, respectively). This characterization scheme also helped in empirically identifying a suitable range of flow rates for (i) uniform sized droplets and (ii) determining the appropriate residence time of droplets in the UV zone for polymerization. It is necessary to ensure that PEG droplets are internally completely crosslinked in order to guarantee their mechanical stability and ability to retain biomolecules.
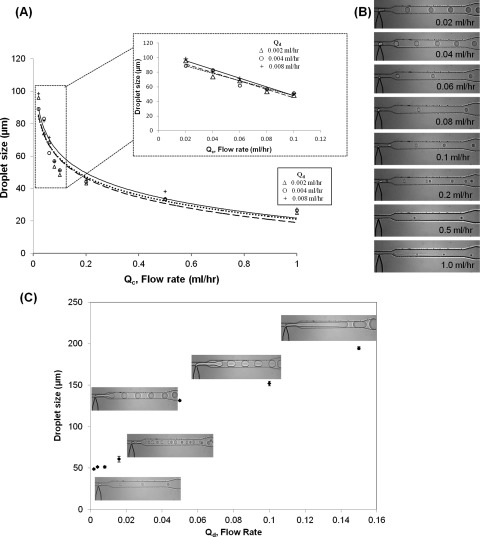
Figure 3 presents the summation of results for droplet generation and characterization. Initially, Qd (PEG-DA) was held constant at 0.002 ml/h, while Qc (hexadecane) was varied from 0.02 to 1.0 ml/h. This process was repeated with Qd at 0.004 ml/h and 0.008 ml/h as well. In our device, it was observed that the size of the droplets was inversely but highly dependent on Qc (Figures 3a, 3b). Qc > 1 ml/h were not able to generate droplets in the range of Qd (0.002 ml/h, 0.004 ml/hr, or 0.008 ml/h). Additionally, the residence time of the droplets within the UV illumination area decreased from 540 ms to 55 ms as Qc increased from 0.1 ml/h to 1.0 ml/h, which was not sufficient for crosslinking. As a result, the microdevice was operated at the lower flow rate (0.04 ml/h to 0.06 ml/h) of Qc, where the droplet generation was stable and found to be linearly proportional to Qc (Inset, Figure 3a). The residence time of the droplets within the UV illumination beam was also found sufficient (900 ms to 1350 ms) for crosslinking of the PEG-DA microbeads.
Figure 3.
Droplet generation at the T-junction was characterized to determine an appropriate range of flow rates for generation of PEG microbeads. (A) The flow rate of continuous phase (Qc) was varied by keeping the flow rate of discontinuous phase constant (Qd) constant at 0.002 ml/h. Inset shows a linear response of droplet size at lower Qc. (B) Droplet sizes decreased as Qc was increased from 0.02 to 1.0 ml/h, for constant Qd = 0.004 ml/h. (C) Droplets were plug-shaped for Qd > 0.05 ml/h at Qc = 0.1 ml/h.
The T-junction was also characterized by keeping Qc constant at 0.1 ml/h and varying Qd. The device operated in a jetting mode for Qd ≥ 0.05 ml/h, and the droplets formed were plug-shaped (Figure 3c). Such a mode was not desirable, as droplets did not have a free shape in the channel and adhered to the sidewalls. Qd > 0.01 ml/h were found to produce unstable droplets. Eventually, Qd = 0.002 ml/h and Qc = 0.04 to 0.06 ml/h were finalized for PEG microbead generation. A typical increase in the droplet size was also observed as the non-dimensional ratio (Qd/Qc) increased (supplementary Figure S1).32
Characterization of PEG microbeads
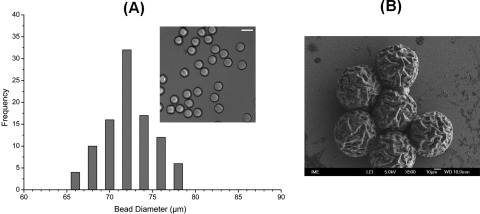
PEG microbeads were collected outside the device within hexadecane and had an average size of 62.8 ± 3 μm (supplementary Figure S2 (Ref. 32)). The microbeads were transferred into 1× PBS by centrifugation and resuspension. They were found stable for at least a month (data not shown). Figure 4a shows the size distribution graph of the microbeads in 1× PBS. The microbeads were found to be monodisperse with an average diameter of 72 ± 2 μm after transfer into PBS. The increase in the bead size can be explained as the typical swelling of a hydrogel in aqueous environments. The swelling ratio of the bead can be controlled,33 by controlling the ratio of PEG-DA to aqueous phase. In this case, the ratio was kept 1:1. The concentration of aqueous phase can be increased to increase the swelling ratio of beads. For SEM characterization, the beads were first dried on a silicon surface and then observed under low acceleration potential. The approximate size of the microbeads was found to be about 60 μm due to de-swelling (Figure 4b). The surface of the microbeads was found to consist of multiple folds and appeared wrinkled (supplementary Figure S3 (Ref. 32)).
Figure 4.
(A) Size distribution of PEG-DA microbeads suspended in an aqueous phase of 1× PBS showing high levels of monodispersity and an average size of 72 µm (Scale bar = 100 µm). (B) SEM image of microbeads revealing multiple folds. Due to preparation steps for SEM, de-swelling of PEG leads to a smaller microbead size (∼60 µm).
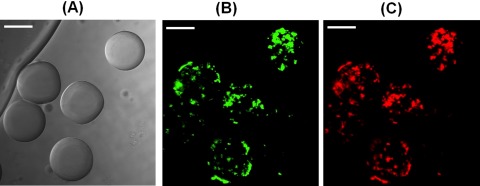
The PEG-DA microbeads encapsulating FITC-dextran and TRITC-ConA were also observed using confocal microscopy by exciting with blue and yellow light filters and images were reconstructed using IMAGEJ software. The distribution of TRITC-ConA and FITC-dextran was not uniform within the microbeads instead TRITC-ConA and FITC-dextran were found to be co-immobilized at the same location within the microbead (Figure 5) as observed previously.29 The PEG-DA and PBS form a clear solution when mixed together, but have a tendency to separate gradually after 2 to 3 h. This can be attributed to phase separation between the aqueous phase and the PEG phase. The PEG-DA is significantly more hydrophobic due to the introduced photo cross linking system in comparison with the pure PEG that is fully water miscible.
Figure 5.
Confocal microscopic studies of PEG microbeads encapsulating FITC-dextran and TRITC-ConA observed in 1× PBS. (A) Brightfield image of microbeads with approximate size of 72 µm. (B) Observation of localization of FITC-dextran through FITC filter (Ex. = 490 nm and Em.= 525 nm for FITC). (C) Observation of localization of TRITC-ConA through TRITC filter images (Ex. = 557 nm and Em. = 576 nm for TRITC). (Scale bars = 50 µm).
PEG microbeads for glucose sensing
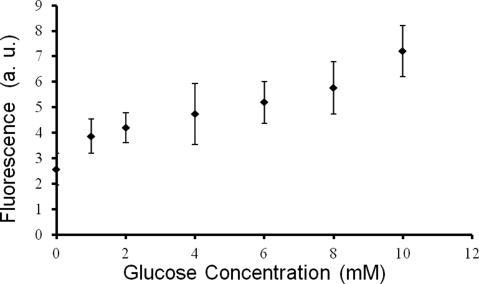
Figure 6 shows a normalized FITC-dextran and TRITC-ConA fluorescent intensity response to different glucose concentrations. PEG microbeads (in 1× PBS) were pipetted on a glass slide and incubated with glucose samples for 15 min. In the absence of glucose, dextran and ConA bind together. Introduction of glucose displaces dextran from ConA binding sites and increases the fluorescence signal. The calibration curve was obtained from 1 to 10 mM glucose concentrations showing a concentration proportional response. Readjusting reagent ratios and mannose conjugation onto FITC-dextran can result in faster response times and increased linearity range for such sensors.34
Figure 6.
Fluorescence intensity response to glucose concentrations varied from 0 to 10 mM. The steady proportional intensity increase in the fluorescence levels of FITC-dextran molecules with respect to increase in the glucose concentrations showed the sensing abilities of the PEG microbeads.
CONCLUSION
Herein, we describe a multiphase microfluidics device and method to prepare highly monodisperse and structurally stable glucose sensing microbeads. The PEG hydrogel microbeads incorporating physically entrapped FITC-dextran and TRITC-ConA conjugates employing a Förster resonance energy transfer principle. The glucose sensing microbeads had an average size of 72 μm in aqueous environments and were highly monodisperse. Glucose biosensing was conducted in the physiological glucose range (1–10 mM) and a proportional fluorescent intensity response was observed confirming the technique’s potential to create biosensing probes. The ultimate goal of these beads is to be used as probes in a microfluidic cell culture system. Future work will focus on adding multiplex capabilities, reducing the size of above microbeads and post-processing them with surface modification techniques such as layer-by-layer (LbL) technique35, 36 to screen out nonspecific response from proteins (albumins, enzymes etc.) in the cell culture system.
ACKNOWLEDGMENTS
The authors like to thank Wong Chee Chung for SEM characterization, Colin Sheppard’s lab and Naveen Balla for using confocal microscopy facilities and the staff of Clean Room 2 (CR2) at the Institute for Microelectronics (IME) for their microfabrication support. This work was supported by the Singapore Ministry of Education (MOE) Grant R397-000-077-112 and A*STAR Grant JCOAG04_FG05_2009.
References
- Lübbert A. and Jørgensen S. B., J. Biotechnol. 85, 187 (2001). 10.1016/S0168-1656(00)00366-7 [DOI] [PubMed] [Google Scholar]
- Wells-Knecht M. C., Thorpe S. R., and Baynes J. W., Biochemistry 34, 15134 (1995). 10.1021/bi00046a020 [DOI] [PubMed] [Google Scholar]
- Luo Z. J., King R. H., Lewin J., and Thomas P. K., J. Neurol. 4, 424 (2002). 10.1007/s004150200033 [DOI] [PubMed] [Google Scholar]
- Rosario S. A., Cha G. S., Meyerhoff M. E., and Trojanowicz M., Anal. Chem. 62, 2418 (1990). 10.1021/ac00221a601 [DOI] [PubMed] [Google Scholar]
- Ksinantova L., Koska J., Kvetnansky R., Marko M., Hamar D., and Vigas M., Horm. Metab. Res. 34, 155 (2002). 10.1055/s-2002-23200 [DOI] [PubMed] [Google Scholar]
- Lewis C. B., McNichols R. J., Gowda A., and Cote G. L., Appl. Spectrosc. 54, 1453 (2007). 10.1366/0003702001948592 [DOI] [Google Scholar]
- Maharbiz M. M., Holtz W. J., Sharifzadeh S., Keasling J. D., and Howe R. T., J. Microelectromech. Syst. 12, 590 (2003). 10.1109/JMEMS.2003.815828 [DOI] [Google Scholar]
- Meadows D. and Schultz J., Talanta 35, 145 (1988). 10.1016/0039-9140(88)80053-5 [DOI] [PubMed] [Google Scholar]
- Meadows D. and Schultz J., Anal. Chim. Acta 280, 21 (1993). 10.1016/0003-2670(93)80236-E [DOI] [Google Scholar]
- Russell R. J., Pishko M. V., Gefrides C. C., and Cotè G. L., in Proceedings of the 20th Annual International Conference of the IEEE Engineering in Medicine and Biology Society, 29 Oct.–1 Nov. 1998 (IEEE, 1998).
- Johnston A., Cortez C., Angelatos A., and Caruso F., Curr. Opin. Colloid Interface Sci. 11, 203 (2006). 10.1016/j.cocis.2006.05.001 [DOI] [Google Scholar]
- Cho N.-J., Elazar M., Xiong A., Lee W., Chiao E., Baker J., Frank C. W., and Glenn J. S., Biomed Mater. 4, 011001 (2009). 10.1088/1748-6041/4/1/011001 [DOI] [PubMed] [Google Scholar]
- DeGeest B., Sukhorukov G., and Mohwald H., Expert Opin. Drug Delivery 6, 613 (2009). 10.1517/17425240902980162 [DOI] [PubMed] [Google Scholar]
- Choi D., Jang E., Park J., and Koh W.-G., Microfluid. Nanofluid. 5, 703 (2008) 10.1007/s10404-008-0303-7. [DOI] [Google Scholar]
- Choi C.-H., Jung J.-H., Hwang T.-S., and Lee C.-S., Macromol. Res. 17, 163 (2009). 10.1007/BF03218673 [DOI] [Google Scholar]
- Tanaka H., Matsumura M., and Veliky I., Biotechnol. Bioeng. 26, 53 (1984). 10.1002/bit.260260111 [DOI] [PubMed] [Google Scholar]
- West J. and Hubbell J., React. Polym. 25, 139 (1995). 10.1016/0923-1137(94)00096-N [DOI] [Google Scholar]
- Temenoff J. S., Park H., Jabbari E., Conway D. E., Sheffield T. L., Ambrose C. G., and Mikos A. G., Biomolecules 5, 5 (2004). 10.1021/bm030067p [DOI] [PubMed] [Google Scholar]
- An S. Y., Bui M. N., Nam Y. J., Han K. N., Li C. A., Choo J., Lee E. K., Katoh S., Kumada Y., and Seong G. H., J. Colloid Interface Sci. 331, 98 (2009). 10.1016/j.jcis.2008.11.022 [DOI] [PubMed] [Google Scholar]
- Lin Z., Cherng-Wen T., Roy P., and Trau D., Lab Chip 9, 257 (2009). 10.1039/b806907g [DOI] [PubMed] [Google Scholar]
- Young E. W. K. and Beebe D. J., Chem. Soc. Rev. 39, 1036 (2010). 10.1039/b909900j [DOI] [PMC free article] [PubMed] [Google Scholar]
- Kantak C., Beyer S., Yobas L., Bansal T., and Trau D., Lab Chip 11, 1030 (2011). 10.1039/c0lc00381f [DOI] [PubMed] [Google Scholar]
- Seo M., Nie Z., Xu S., Mok M., Lewis P. C., Graham R., and Kumacheva E., Langmuir 21, 11614 (2005). 10.1021/la050519e [DOI] [PubMed] [Google Scholar]
- Choi C.-H., Jung J.-H., Hwang T.-S., and Lee C.-S., Macromol. Res. 17, 163 (2009). 10.1007/BF03218673 [DOI] [Google Scholar]
- Wang J.-T., Wang J., and Han J.-J., Small 7, 1728 (2011). 10.1002/smll.201001913 [DOI] [PubMed] [Google Scholar]
- Dendukuri D., Pregibon D. C., Collins J., Hatton T. A., and Doyle P. S., Nature Mater. 5, 365 (2006). 10.1038/nmat1617 [DOI] [PubMed] [Google Scholar]
- Dendukuri D., Gu S. S., Pregibon D. C., Hatton T. A., and Doyle P. S., Lab chip 7, 818 (2007). 10.1039/b703457a [DOI] [PubMed] [Google Scholar]
- Helgeson M. E., Chapin S. C., and Doyle P. S., Curr. Opin. Colloid Interface Sci. 16, 106 (2011). 10.1016/j.cocis.2011.01.005 [DOI] [PMC free article] [PubMed] [Google Scholar]
- Russell R. J., Pishko M. V., Gefrides C. C., Mcshane M. J., and Cotè G. L., Anal. Chem. 71, 3126 (1999). 10.1021/ac990060r [DOI] [PubMed] [Google Scholar]
- Christopher G. F. and Anna S. L., J. Phys. D: Appl. Phys. 40, 319 (2007). 10.1088/0022-3727/40/19/R01 [DOI] [Google Scholar]
- Garstecki P., Fuerstman M. J., Stone H. A., and Whitesides G. M., Lab Chip 6, 437 (2006). 10.1039/b510841a [DOI] [PubMed] [Google Scholar]
- See supplementary material at http://dx.doi.org/10.1063/1.3694869 for (S1) graph of droplet size vs. non-dimensional ratio (Qd/Qc) of flow rates, (S2) photomicrograph of PEG microbeads in hexadecane, and (S3) zoomed-in SEM images of dried PEG microbeads.
- Mellott M. B., Searcy K., and Pishko M. V., Polymer 42, 4893 (2001). 10.1016/S0032-3861(00)00851-X [DOI] [Google Scholar]
- Ballerstadt R. and Schultz J., Anal. Chim. Acta. 345, 203 (1997). 10.1016/S0003-2670(97)00042-1 [DOI] [Google Scholar]
- Mak W. C., Cheung K. Y., and Trau D., Chem. Mater. 20, 5475 (2008). 10.1021/cm702254h [DOI] [Google Scholar]
- Beyer S., Mak W. C., and Trau D., Langmuir 23, 8827 (2007). 10.1021/la7011777 [DOI] [PubMed] [Google Scholar]


