Abstract
A novel microfluidic device enabling selective generation of droplets and encapsulation of targets is presented. Unlike conventional methods, the presented mechanism generates droplets with unique selectivity by utilizing a K-junction design. The K-junction is a modified version of the classic T-junction with an added leg that serves as the exit channel for waste. The dispersed phase fluid enters from one diagonal of the K and exits the other diagonal while the continuous phase travels in the straight leg of the K. The intersection forms an interface that allows the dispersed phase to be controllably injected through actuation of an elastomer membrane located above the inlet channel near the interface. We have characterized two critical components in controlling the droplet size—membrane actuation pressure and timing as well as identified the region of fluid in which the droplet will be formed. This scheme will have applications in fluid sampling processes and selective encapsulation of materials. Selective encapsulation of a single cell from the dispersed phase fluid is demonstrated as an example of functionality of this design.
INTRODUCTION
Droplet microfluidics has garnered much attention in recent years and a vast number of applications have been demonstrated leveraging unique capabilities of the platform.1, 2, 3 Additionally, a variety of droplet generation mechanisms have also been developed to facilitate the different needs of the applications. Traditional droplet generation technologies such as flow-focusing4 and shear-focusing5 have been shown to be capable of generating droplets at very high rates—up to tens of thousands per second with highly uniform sizes.6 However, these methods lack the ability to precisely control the timing of droplet generation. Although the frequency of droplet generation can be tuned by changing the ratio between the continuous and dispersed phases flow rates,7 it is difficult to generate droplets at irregular intervals in a well-controlled manner as the droplet break up mechanism is inherently continuous.
Recently, on-demand droplet generation mechanisms have been demonstrated by various research groups.8, 9, 10, 11, 12 Unlike traditional droplet generation mechanisms, on-demand droplet generation does not continuously generate droplets but forms droplets as needed in a one-by-one fashion. Most on-demand generation schemes use a pneumatic membrane valve first demonstrated by Unger et al.13 The valve operates in the normally closed fashion and only when the valve is opened, a droplet will be generated. The size of the droplet is hence controlled by the opening duration of the valve and droplet generation frequency and interval can be controlled by valve opening/closing sequence.14 In this manner, specific sequences of droplets can be easily achieved by using desired valve actuation control.
However, all conventional droplet generation methods share a common limitation—the entire volume of dispersed phase fluid has to be used for droplet generation. This characteristic is oftentimes an advantage as this ensures very high encapsulation efficiency in the applications such as synthesis of drug delivery vehicles where one would prefer all materials input into the devices be usable in the final product.15 That is, this mode of encapsulation is well suited for targets that are abundant and in most cases evenly distributed throughout the entire suspension. Although many applications benefit from this characteristic, it could be limiting in other cases where only a fraction of the input solution contains desired encapsulation targets. For instance, in the case of cell encapsulation,16, 17, 18, 19, 20, 21, 22, 23 unless a high density of cells is available, only a small percentage of the cell suspension volume consists of cells as encapsulation events follow a Poisson distribution.20 Specifically when targets are sparse, the result is large numbers of droplets without targets encapsulated.29 Although recent publications have demonstrated methods in which encapsulation efficiencies better than that of Poisson can be achieved through manipulation of the input cell suspension,24, 25 at very low target concentrations still only a very low percentage of the droplets will contain cells. Recently an on-demand droplet generation system utilizing laser-induced cavitations was published, which ejects droplets from fluid stream utilizing laser-induced cavitations.26 However, the system presented utilized highly specialized equipment—high speed lasers—to actuate the generation of droplets.
Here we present a platform that enables the selective generation of droplets by controllably extracting well-defined volumes of fluid from a continuously flowing dispersed phase. The device utilizes a pneumatically actuated membrane that ejects the continuous stream into the oil flow to generate a droplet. Unlike recently reported on-demand droplet generation processes, only a selected fraction of the dispersed phase solution will be injected into the continuous phase solution as droplets with precisely controlled volume and the rest of dispersed phase solution will exit the device unaffected. This platform will enable the targeted encapsulation of cells/particles in the solution and the minute sample extraction from the reagents without disturbing the overall flow of the reagents. In contrast to the laser-based platform, we believe by utilizing components that are more easily integrated and less disturbing of the encapsulation solution—membrane actuators as opposed to high-speed lasers—our system offers advantages such as lowered cost and smaller footprint over the previously published results. Furthermore the presented system is compatible with both syringe pumps and pressure regulated systems whereas the traditional on-demand droplet generation systems can be operated only by the pressure-regulated reagent delivery system.
DEVICE CONCEPT AND DESIGN
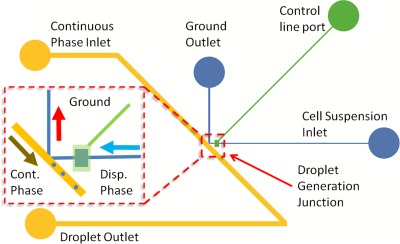
A schematic of the device is shown in Figure 1. We refer to this design as a K-junction as the intersection of the dispersed and continuous phase resembles an upper case “K.” The green line indicates the control channel and the green circle is the inlet port of the pneumatic control line. The blue lines indicate dispersed phase channel and the yellow lines represent the continuous phase fluidic channels. The distinguishing feature of the design is the presence of the ground or waste line that the dispersed phase fluid takes when no droplets are generated. That is, without activation of the droplet generation mechanism, all dispersed phase fluid flow towards the waste outlet. As will be discussed later in the article, the selective re-direction of the dispersed phase into the waste line is the result of delicate balance of the hydrostatic forces of each phase and the force induced by surface tension at the interface between the dispersed and continuous phase.
Figure 1.
Schematic of the on-demand droplet generation device. Blue lines indicate the dispersed phase channel, the yellow line represents the continuous phase channel, and the green line is the control channel. Red square denotes the droplet generation region of the device. Inset: The droplet generation area enlarged. The light blue arrow shows the direction of the dispersed phase flow. The red arrow denotes the ground outlet flow direction. The yellow arrow indicates the flow direction of the continuous phase and the flow direction of the generated droplet. Chamber in the fluidic line is visible beneath the green actuation line chamber.
When the droplet generation mechanism is activated, a portion of the dispersed phase is directed away from the waste line and into the main fluidic channel towards the droplet outlet. The droplet generation junction is highlighted by the red dotted box in Figure 1. The dispersed phase enters from the right as shown by the blue arrow, with the control line chamber (transparent green rectangle) aligned above a corresponding chamber in the fluidic line. The waste line leads out towards the top indicated by the red arrow. The yellow arrow indicates the flow direction of the continuous phase as well as the droplets once generated.
MATERIALS AND METHODS
Microfabrication
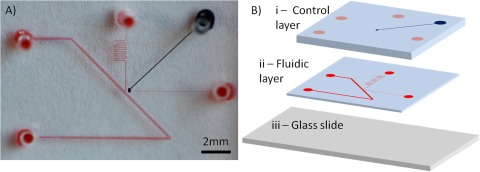
The device consists of two layers of poly-dimethyl siloxane (PDMS), fabricated using conventional soft lithography method.13 Briefly, a negative photoresist SU-8 2050 (Microchem Corp., USA) is spin-coated onto a 3-inch silicon wafer at 3000 rpm to form molds that have thickness of 50 μm. The resist is then exposed to UV-light and patterned using a contact mask printed at 20 000 dpi to selectively polymerize the resist. The exposed wafer is then developed to remove the unpolymerized resist. The remaining polymerized resist forms the positive mold for forming PDMS (RTV615, Momentive Inc., USA) channels. The two PDMS layers are bonded by using different ratios of curing agent and polymer base. The top layer is prepared by pouring 1:5 curing agent-base ratio PDMS mixture onto the mold while the bottom layer is prepared by spin-coating 1:20 curing agent-base ratio PDMS mixture onto a separate mold.13 The top and bottom layers are then heat cured at 80 °C for 60 and 45 min, respectively. After curing, the top layer is cut out and removed from the mold and aligned to the bottom layer using a stereoscope and allowed to cure at 80 °C overnight in order to enclose the control line (see Figure 2). Fluidic via holes are then punched in the bonded layers and the PDMS parts are plasma bonded to pre-cleaned glass microscope slides to complete the device. A photograph of an assembled device is shown in Figure 2a. Figure 2b shows a schematic of the three layers that combine to form the device. The top layer of is a 4 mm PDMS layer that contains the control channel and the second PDMS layer is approximately 100 μm thick and contains the fluidic channels. Through holes that serve as connective channel are punched through both layers as to connect to the lower layer. The bottom of the device is a glass slide. The width of the main fluidic channel is 200 μm, while the inlet channel is and the waste line is 25 μm and 75 μm in width, respectively.
Figure 2.
Photograph and schematic of the microfluidic device. (A) Photograph of assembled microfluidic device filled with dye: fluidic channel—red, control channel—blue. (B) Exploded schematic of the device showing the three layers. Layer i—thick top PDMS layer containing the control channel. Layer ii—thin PDMS layer containing the fluidic channels. Layer iii—bottom glass substrate. The solid circles indicate the locations of the connective via.
Pneumatic reagent delivery and membrane actuation control
Reagents are contained in plastic screw-top vials and are delivered through Tygon tubing (Microbore, Cole-Parmer Instrument Company, USA) to the microfluidic devices. Pumping of the reagents are done using house air regulated by digital pressure regulators (ITV series, SMC Corp, USA) controlled through a customized LabVIEW (National Instruments, USA) interface. Actuation of the droplet generation membrane is controlled using LabVIEW controlling a three-way valve (Lee Company, USA) connected to nitrogen source (AirGas, USA) regulated with analogue pressure regulator. The continuous phase used for the droplet generation is mineral oil—viscosity 36.5 cst (Fisher Scientific, USA) with 5% of the polymeric surfactant EM90 (Evonik Industries AG, Germany). The dispersed phase was either DI water or cell suspended in PBS (Life Technologies, USA). The driving pressures that were utilized for the experiments reported in this article are 3.1 psi for the continuous phase and 2.1 psi for the dispersed phase. It should be noted that pressure regulators that can provide stable pressures (within tenths of psi accuracy) are important to the effective operation of the device.
Image acquisition and processing
Image and video acquisition was done using high speed cameras either the Photron FastCam PCI (Photron USA Inc., USA) or the Phantom V310 (Vision Research, USA) attached to an inverted microscope (Nikon Eclipse TE2000-S, Nikon, USA). High speed videos (5000 fps and 20 000 fps) of the process of encapsulating 1.1 μm polystyrene beads in water were recorded. Image and video processes were performed using the software imagej (NIH, USA).
RESULTS AND DISCUSSION
Droplet generation process
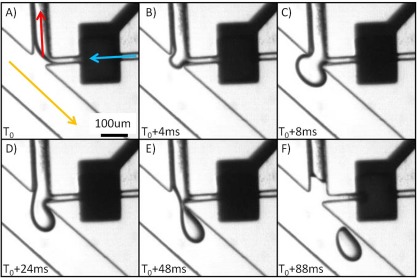
A single droplet can be generated on-demand by triggering the pneumatic control line when the encapsulation target material is detected. The process of generating a single droplet is shown in Figure 3. The control chamber is filled with a dark dye solution to assist in distinguishing the different layers of the microfluidic device. As the dispersed phase reaches the droplet generation junction, the resistance generated by the presence of the continuous phase prevents it from flowing towards the droplet outlet through the main fluidic channel; coupled with the lower resistance of the waste channel, the dispersed phase exits through the waste outlet (Figure 3a). When a droplet is to be generated, the pneumatic control line is activated by allowing pressure to be applied to the control line chamber. When this pressure is applied, the chamber deforms into the fluidic layer chamber as there exists only a thin membrane separating the two chambers. This sudden deformation displaces the fluid that was present in the chamber at the time. The flow generated by this displacement creates a rapid and temporary increase in the pressure in the dispersed phase locally and allows the dispersed phase fluid to displace some of the continuous phase and enter the main fluidic channel. In Figure 3b, a small protrusion formation can be seen at the water-oil interface at the start of the chamber deformation. As the chamber deforms further, more fluid is displaced into the main fluidic channel (Figure 3c). The protrusion of the dispersed phase is then sheared by the continuous phase into a droplet (Figures 3). The shearing of the dispersed phase fluid by the continuous phase is very similar to that of droplet generation in a T-junction format—a protrusion of dispersed phase is sheared into droplets by the continuous phase.27, 28 The process we demonstrated here controls the displacement of the dispersed phase into the continuous phase and thus the droplet formation process.
Figure 3.
Time sequence of a single droplet being generated with this mechanism. Blue line indicates the initial flow direction of the dispersed phase; red is the waste outlet; and yellow is the continuous phase and flow direction of the generated droplet. The actuation membrane is actuated at T0. (A) Prior to membrane actuation the fluid flows towards the waste outlet. (B) and (C) As the membrane is actuated, the dispersed phase is displaced into the main fluidic channel. (D)-(F) The fluid volume is sheared by the continuous phase into a droplet.
Although a brief discussion of the interplay of the forces at the droplet generation junction is presented here, a more detailed treatment of the force balance as well as the droplet generation process can be found in the supplementary material.29 Without membrane actuation, the system is in a quasi-steady state where the pressure balance at the junction prevents the dispersed phase fluid from entering the main fluidic channel. Three distinct components contribute to the pressure balance at the interface—hydrostatic pressure of the dispersed phase, hydrostatic pressure of the continuous phase, and the Laplace pressure at the interface. The hydrostatic pressure of the dispersed phase, or the pressure drop from the junction to the waste line outlet can be described by the Hagen-Poiseuille equation, ΔP = QR, where the volumetric flow rate into the waste line and the fluidic resistance of the waste line determine this pressure. The hydrostatic pressure of the continuous phase is correspondingly determined by the flow and resistance of the continuous phase. The balance of these two pressures, augmented by the Laplace pressure of the interface—determined by the geometry of the droplet generation junction as well as the interfacial tension between the fluids—results in a quasi-stable interface that prevents the protrusion of the dispersed phase fluid into the main fluidic channel. When the membrane is actuated, flow (Q) in the dispersed phase inlet line increases suddenly as fluid is displaced from beneath the membrane. This increased flow (Q) produces a corresponding pressure (P) increase, destabilizing the junction and causing the dispersed phase fluid to overcome to hydrostatic pressure of the continuous phase and deform into the main fluidic channel initiating the droplet formation process. As described in fuller detail in the ESI, the force due to surface tension is much lower than the hydrostatic force of either the dispersed or continuous phase, due to the addition of surfactant to the system.
It is important to note that there is a significant difference between the aforementioned mechanism and conventional on-demand droplet generators using normally closed valves. In the conventional scheme, there is only fluid flow during the times the valves are open. However in this platform, the fluid flow is continuous and actuation of the membrane serves to disrupt the flow to induce the formation of a droplet. Therefore this mechanism enables the generation of droplets using only select volumes of the dispersed phase. The maximum droplet generation rate however is similar to that of published valve-based on-demand generation processes. This is due to the fact that both systems are limited by the relaxation time of a typical PDMS membrane which is in the order of 50 ms and thus limiting droplet generation rates to around 20 Hz.
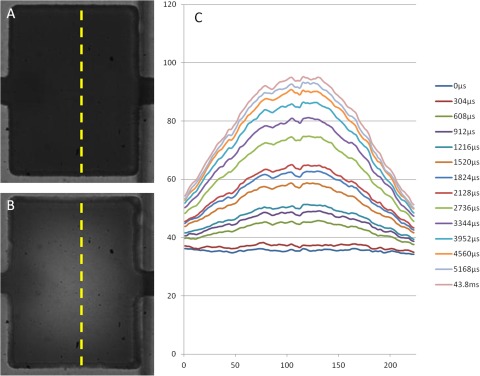
Results shown in Figure 4 were obtained by filling the actuation chamber with clear water and the fluidic channel with dye. At rest, the fluidic line is filled with dye and the pixels will have a low intensity value. As the membrane is actuated, dye is pushed out of the chamber and the intensity of the pixel increases due to the fact that the actuation chamber is clear. Figure 4a shows the chamber with the membrane at rest and panel b shows the chamber with the membrane fully actuated. The dotted yellow line denotes the line along which the intensity values are measured. Panel c shows a series of intensity plots captured at approximately 3300 fps. The raise in intensity corresponds with the deformation of the membrane into the fluidic chamber, displacing the dye.
Figure 4.
Visualization of membrane deformation in the actuation chamber. (A) The fluidic channel is filled with dye and appears to be dark. (B) The membrane is actuated and the dye inside the fluidic chamber is displaced. (C) Intensity measured along the dotted yellow line as indicated in A and B. The brighter the pixel, the less the presence of dye. The profile of the plot serves as an analog to the shape of the membrane.
Droplet size parameter characterization
Although a variety of parameters can affect the sizes of generated droplets—including pumping pressures of the two phases and the geometry of the droplet generation junction—we focus on the characterization of two critical parameters, which allows for the dynamic control of droplet size. Just as in passive on-demand generation where the opening times of the valves controls droplet size;9 actuation time of the membrane was found to affect droplet size in our system. In addition, the pressure at which the membrane is actuated can also be used to control the droplet sizes. It is important to note that the data presented are for the specific geometry that was tested. With different channel designs such as changes in droplet shearing junction dimension and actuation chamber size, the range of droplets generated will change as well.
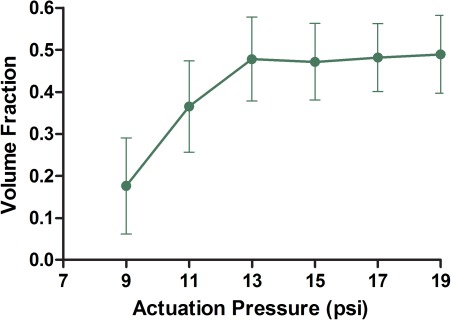
Droplet sizes are presented as volume fraction of the deformable chamber. It can be seen that the maximum volume fraction achieved, VMax, is around 0.5 or one half of the deformable chamber volume as shown in Figure 4, indicating not all of the fluid that is displaced from the chamber is encapsulated in the droplet. This is further explored in Sec. 4C.
The relationship between droplet size and the membrane actuation pressure is shown in Figure 5. The membrane actuation time, TAct, was held constant at 100 ms while the actuation pressure, PAct, of the membrane was varied from 9 psi to 19 psi. As PAct is increased from 9 psi to 13 psi, the droplet size steadily increases. However, with PAct > 13 psi, further increase in membrane actuation pressure resulted in no increase in droplet size. This is due to the fact that at around 13 psi the maximum deformation of the PDMS membrane has been achieved. As the droplet generation mechanism relies on the deformation to temporarily increase pressure of the dispersed phase, once the maximum deformation level is reached, no further increase in flow can occur, despite increased actuation pressure.
Figure 5.
Droplet size is measured with TAct = 100 ms while changing the actuation pressure of the membrane. The size increases but reaches a plateau after approximately 13 psi. Above 13 psi, further increase in membrane actuation pressure does not increase droplet size, n = 5.
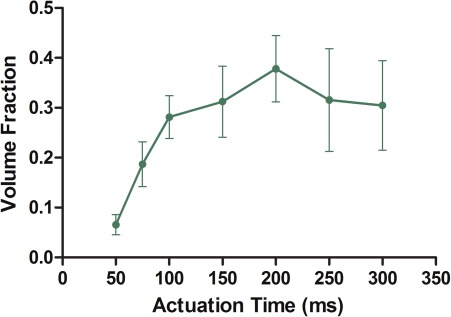
Figure 6 depicts the dependence of droplet size on the actuation duration of the membrane. In this case, PAct was held constant at 10 psi while the membrane actuation time ranges from 50 ms to 300 ms. As the actuation time is increased from 50 ms to 100 ms, the sizes of droplets generated increase. However, beyond TAct of 100 ms the size of the droplets stays constant. As in the pressure dependence of droplet size, droplet size dependence on TAct is also due to different membrane deformation levels. As the membrane is pressurized, although the center of the membrane may reach the bottom of the fluid chamber rather rapidly, complete deformation of the membrane—hence maximum fluidic displacement—requires longer time.13 Therefore, if the TAct is less than the time required for maximum deformation, the pressure is released before the membrane fully deforms, producing droplets smaller than VMax. Once the maximum deformation is reached, further increase in membrane actuation time does not increase droplet size.
Figure 6.
Droplet size is measured with PAct = 10 psi, while varying the actuation time of the membrane. As TAct increases the droplet size increases but reaches a plateau at around 100 ms. After 100 ms, further increase in membrane actuation time does not significantly increase droplet sizes, n = 5.
From our observations, the consecutive production of droplets does not significantly alter the generation of droplets. However, there is a limit on the generation frequency so that the flow condition can return to relatively stable state prior to the generation of the subsequent droplet. If the membrane is actuated again too soon after the first droplet generation event, no droplet can be produced as insufficient dispersed phase fluid occupies the encapsulation zone region to cause enough deformation into the main fluidic channel to form a droplet.
Encapsulation zone characterization
As the droplet generation mechanism selectively encapsulate volumes of fluid into droplets, it is critical to distinguish the volume that is encapsulated from the flow that continues towards the waste outlet when a droplet is generated. We identified the area in the microfluidic channel that contains the volume of dispersed phase fluid that will be made into a droplet (see Figure 7). The identification of the encapsulation zone is especially important for applications such as selective encapsulation as the targets need to be inside the encapsulation zone when the droplet generation mechanism is activated in order to generate target-containing droplets. Additionally, characterization of the encapsulation zone enables further optimization of droplet generation control in the future by providing information on the physical affect of parameters such as actuation time and pressure.
Figure 7.
(A) and (B) are examples of analyzed images from bead encapsulation experiments. Green circles mark beads that were encapsulated in generated droplet and red circles indicate beads that were not encapsulated. (C) Analysis result of 47 beads represented as colored regions. Green region area marks the encapsulation zone and red region indicates fluid volumes that were not encapsulated.
Video of droplet generation process with bead suspension was captured as described previously. From the video, two types of information were extracted. First, the end states of the relevant beads were identified—that is whether the bead was encapsulated in the droplet or in the discarded volume. This allows us to correlate the starting positions of the beads with their end fate to elucidate the encapsulation zone. Secondly, the paths that the beads travelled were tracked to help visualize the flow pattern when the droplet generation mechanism is activated. In order to clearly visualize the movement of the beads, the control chamber is filled with clear fluid as opposed to colored dye solution as in other images shown in the article.
Figures 7a, 7b show two representative processed images with the encapsulation status indicated. The green circles show beads that became encapsulated in droplets and the red circles show beads that were not encapsulated but instead traveled down the waste channel. A total of 47 beads from ten different generated droplets were analyzed and an aggregate image was created. From the aggregate image Figure 7c was created. The green-shaded region indicates area in which beads were encapsulated, the “encapsulation zone,” and red-shaded region indicates areas in which beads where no encapsulated when a droplet was generated. This suggests a well-defined encapsulation zone, which can be utilized to controllably encapsulate objects into generated droplets. That is, by precisely controlling the timing of droplet generation, only targets within the encapsulation zone will be encapsulated.
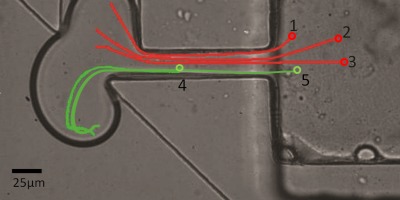
Although a zone can be defined in this manner to indicate the volume of fluid encapsulated inside a droplet, examining the paths of the beads provides further detail of the origin of this behavior. Figure 8 shows the paths of two beads that were encapsulated and three beads that were not. The starting locations of the beads are marked with open circles. The image also shows the protrusion of dispersed phase into the main channel 15 ms prior to pinch off and the volume that will become the droplet is apparent. Examining these paths provides basic understanding of the basis of the encapsulation zone by shedding light on why certain beads were no encapsulated. Bead 1 is located close to the encapsulation zone but slightly above the region. When the membrane is activated, the bead is pushed into the channel but travels towards the waste line and not the main channel. This is due to the bifurcation-like split at the entrance to the main channel. Fluid that is located towards the top of the chamber travels up and away from the main channel into the waste channel.
Figure 8.
Photograph showing the extent of maximum deformation of dispersed phase into the main fluidic channel. Red lines indicate the paths of 3 beads that were not encapsulated into the formed droplet. Green lines represent the paths of beads that were encapsulated when a droplet is generated. The starting location of the beads is marked with open circles.
In the case of bead 3, although it is located towards the center of the chamber it is still not encapsulated into the droplet. This is due to the fact that it did not travel far enough to be displaced into the main channel and become part of the formed droplet. The starting position of bead 2 is located in between bead 1 and bead 3 and therefore ended in a location that is also in between bead 1 and 3. Green line in Figure 8 shows the path of a bead that was within the zone and was encapsulated in the droplet. Beads 4 and 5 started out within the encapsulation zone and travels far out into the main fluidic channel as the dispersed phase is deformed into the oil flow. As the droplet is sheared, the bead is dragged forward with the droplet and becomes encapsulated when the droplet is sheared off.
Cell encapsulation
As a demonstration of the ability to selectively encapsulate targets, the system was used to encapsulate a single cell out of a continuously flowing cell suspension. Time sequence of the encapsulation process is shown in Figure 9. The cell (highlighted with yellow arrow) is visible in Figure 9a moving towards the chamber underneath the actuation membrane. In Figure 9b, immediately prior to the actuation of the membrane, the cell has moved past the chamber and is inside the encapsulation zone indicated by the green dotted region. Panel (c) shows the dispersed phase at the maximum deformation similar to that of Figure 8 and the cell is clearly visible inside. The last panel shows the cell encapsulated inside the generated droplet.
Figure 9.
Image sequence of a single cell encapsulated by the droplet generation system. The cell is indicated by yellow arrow and the encapsulation zone is denoted by the dotted green box. (A) Cell moving towards the droplet generation junction. (B) Cell inside the encapsulation zone (green dotted region) the moment the membrane is actuated. (C) Cell position at maximum droplet deformation. The cell travels a path almost identical to that of bead 4 in Figure 7. (D) Cell encapsulated inside the generated droplet.
The timing of the activation of droplet generation is important in order to control the encapsulation process. As can be seen in Figure 9, the encapsulation zone is several times the size of the cell and therefore provides a buffer in time for the encapsulation of the cell. That is, as long as the cell is within the zone, the precise location of the cell is not critical to the encapsulation process. The recognition of the presence in the zone could be achieved utilizing different mechanisms. For instance optical detection could be employed to detect the presence of a fluorescently labeled cell inside the encapsulation zone. Alternatively, detection of the target could be performed upstream of the encapsulation zone and through the correlation of the velocity of the cell and the distance away from the encapsulation zone; precise timing on the generation of droplets can be achieved as well.
CONCLUSIONS
Here we have presented a system that allows the selective generation of droplets and encapsulation of target from a continuously flowing dispersed phase stream. We characterized the effects of membrane actuation pressure and membrane actuation duration on droplet size as well as demonstrated the utility of the system by selectively encapsulating a single cell out of a dilute stream of cells. By controllably generating droplets and encapsulating targets, a highly efficient and selective encapsulation system can be created in the future by coupling the presented mechanism with a feedback system that can detect the presence of encapsulation targets and trigger the droplet generation mechanism.
References
- Teh S. Y., Lin R., Hung L. H., and Lee A. P., Lab Chip 8(2 ), 198–220 (2008). 10.1039/b715524g [DOI] [PubMed] [Google Scholar]
- Baroud C. N., Gallaire F., and Dangla R., Lab Chip 10(16 ), 2032–2045 (2010). 10.1039/c001191f [DOI] [PubMed] [Google Scholar]
- Casadevall i Solvas X. and deMello A., Chem. Commun. (Cambridge) 47(7 ), 1936–1942 (2011). 10.1039/c0cc02474k [DOI] [PubMed] [Google Scholar]
- Piotr G., Irina G., Willow D., George M. W., Eugenia K., and Howard A. S., Appl. Phys. Lett. 85(13 ), 2649–2651 (2004). 10.1063/1.1796526 [DOI] [Google Scholar]
- Tan Y.-C., Fisher J. S., Lee A. I., Cristini V., and Lee A. P., Lab Chip 4(4 ), 292–298 (2004). 10.1039/b403280m [DOI] [PubMed] [Google Scholar]
- Kobayashi I., Uemura K., and Nakajima M., Colloids Surf., A 296(1–3 ), 285–289 (2007). 10.1016/j.colsurfa.2006.09.015 [DOI] [Google Scholar]
- Tan Y. C., Cristini V., and Lee A. P., Sens. Actuators B 114(1 ), 350–356 (2006). 10.1016/j.snb.2005.06.008 [DOI] [Google Scholar]
- Lorenz R. M., Edgar J. S., Jeffries G. D. M., and Chiu D. T., Anal. Chem. 78(18 ), 6433–6439 (2006). 10.1021/ac060748l [DOI] [PubMed] [Google Scholar]
- Lin B. C. and Su Y. C., J. Micromech. Microeng. 18(11 ), 115005–115014 (2008). 10.1088/0960-1317/18/11/115005 [DOI] [Google Scholar]
- Zeng S. J., Li B. W., Su X. O., Qin J. H., and Lin B. C., Lab Chip 9(10 ), 1340–1343 (2009). 10.1039/b821803j [DOI] [PubMed] [Google Scholar]
- Xu J. and Attinger D., J. Micromech. Microeng. 18(6 ), 065020 (2008). 10.1088/0960-1317/18/6/065020 [DOI] [Google Scholar]
- Kaneda S., Ono K., Fukuba T., Nojima T., Yamamoto T., and Fujii T., Electrophoresis 31(22 ), 3719–3726 (2010). 10.1002/elps.201000295 [DOI] [PubMed] [Google Scholar]
- Unger M. A., Chou H.-P., Thorsen T., Scherer A., and Quake S. R., Science 288(5463 ), 113–116 (2000). 10.1126/science.288.5463.113 [DOI] [PubMed] [Google Scholar]
- Galas J. C., Bartolo D., and Studer V., New J. Phys. 11, 075027 (2009). 10.1088/1367-2630/11/7/075027 [DOI] [Google Scholar]
- Hung L. H., Teh S. Y., Jester J., and Lee A. P., Lab Chip 10(14 ), 1820–1825 (2010). 10.1039/c002866e [DOI] [PubMed] [Google Scholar]
- Martin K., Henkel T., Baier V., Grodrian A., Schon T., Roth M., Michael Kohler J., and Metze J., Lab Chip 3(3 ), 202–207 (2003). 10.1039/b301258c [DOI] [PubMed] [Google Scholar]
- Oh H. J., Kim S. H., Baek J. Y., Seong G. H., and Lee S. H., J. Micromech. Microeng. 16(2 ), 285–291 (2006). 10.1088/0960-1317/16/2/013 [DOI] [Google Scholar]
- Sugiura S., Oda T., Aoyagi Y., Matsuo R., Enomoto T., Matsumoto K., Nakamura T., Satake M., Ochiai A., Ohkohchi N., and Nakajima M., Biomed. Microdevices 9(1 ), 91–99 (2007). 10.1007/s10544-006-9011-9 [DOI] [PubMed] [Google Scholar]
- Huebner A., Srisa-Art M., Holt D., Abell C., Hollfelder F., Demello A. J., and Edel J. B., Chem. Commun. 2007(12 ), 1218–1220. 10.1039/b618570c [DOI] [PubMed] [Google Scholar]
- Clausell-Tormos J., Lieber D., Baret J. C., El-Harrak A., Miller O. J., Frenz L., Blouwolff J., Humphry K. J., Koster S., Duan H., Holtze C., Weitz D. A., Griffiths A. D., and Merten C. A., Chem. Biol. 15(5 ), 427–437 (2008). 10.1016/j.chembiol.2008.04.004 [DOI] [PubMed] [Google Scholar]
- Hong J., deMello A. J., and Jayasinghe S. N., Biomed. Mater. 5(2 ), 21001 (2010). 10.1088/1748-6041/5/2/021001 [DOI] [PubMed] [Google Scholar]
- Tan Y. C., Hettiarachchi K., Siu M., Pan Y. R., and Lee A. P., J. Am. Chem. Soc. 128(17 ), 5656–5658 (2006). 10.1021/ja056641h [DOI] [PubMed] [Google Scholar]
- Brouzes E., Medkova M., Savenelli N., Marran D., Twardowski M., Hutchison J. B., Rothberg J. M., Link D. R., Perrimon N., and Samuels M. L., Proc. Natl. Acad. Sci. U.S.A. 106(34 ), 14195–14200 (2009). 10.1073/pnas.0903542106 [DOI] [PMC free article] [PubMed] [Google Scholar]
- Edd J. F., Di Carlo D., Humphry K. J., Koster S., Irimia D., Weitz D. A., and Toner M., Lab Chip 8(8 ), 1262–1264 (2008). 10.1039/b805456h [DOI] [PMC free article] [PubMed] [Google Scholar]
- Abate A. R., Chen C. H., Agresti J. J., and Weitz D. A., Lab Chip 9(18 ), 2628–2631 (2009). 10.1039/b909386a [DOI] [PubMed] [Google Scholar]
- Park S. Y., Wu T. H., Chen Y., Teitell M. A., and Chiou P. Y., Lab Chip 11(6 ), 1010–1012 (2011). 10.1039/c0lc00555j [DOI] [PMC free article] [PubMed] [Google Scholar]
- Garstecki P., Fuerstman M. J., Stone H. A., and Whitesides G. M., Lab Chip 6(3 ), 437–446 (2006). 10.1039/b510841a [DOI] [PubMed] [Google Scholar]
- Wang A.-B., Lin I. C., Hsieh Y.-W., Shih W.-P., and Wu G.-W., Lab Chip 11(20 ), 3499–3507 (2011). 10.1039/c1lc20240e [DOI] [PubMed] [Google Scholar]
- See supplementary material at http://dx.doi.org/10.1063/1.3699972 for schematic comparing encapsulation mechanisms and detailed discussions and calculations regarding the force balance at the junction.


