Abstract
Spatially and temporally resolved delivery of soluble factors is a key feature for pharmacological applications. In this framework, microfluidics coupled to multisite electrophysiology offers great advantages in neuropharmacology and toxicology. In this work, a microfluidic device for biochemical stimulation of neuronal networks was developed. A micro-chamber for cell culturing, previously developed and tested for long term neuronal growth by our group, was provided with a thin wall, which partially divided the cell culture region in two sub-compartments. The device was reversibly coupled to a flat micro electrode array and used to culture primary neurons in the same microenvironment. We demonstrated that the two fluidically connected compartments were able to originate two parallel neuronal networks with similar electrophysiological activity but functionally independent. Furthermore, the device allowed to connect the outlet port to a syringe pump and to transform the static culture chamber in a perfused one. At 14 days invitro, sub-networks were independently stimulated with a test molecule, tetrodotoxin, a neurotoxin known to block action potentials, by means of continuous delivery. Electrical activity recordings proved the ability of the device configuration to selectively stimulate each neuronal network individually. The proposed microfluidic approach represents an innovative methodology to perform biological, pharmacological, and electrophysiological experiments on neuronal networks. Indeed, it allows for controlled delivery of substances to cells, and it overcomes the limitations due to standard drug stimulation techniques. Finally, the twin network configuration reduces biological variability, which has important outcomes on pharmacological and drug screening.
INTRODUCTION
In vitro neuronal cultures are widely used as a model for acquiring a basic understanding of network functionality. Generally, they are obtained by dissociating brain tissue mechanically and chemically. During the first weeks in culture, neurons extend neurites, form synapses, and begin to develop spontaneous activity.1 These activity patterns continue to develop over the course of a month invitro and their changes can be guided and explored by either electrical stimulation2, 3 or pharmacological modulation.4
When the focus lies on networks, micro electrode arrays (MEAs) are valuable tools for multisite electrophysiological applications.5, 6 MEAs are matrices of planar metallic electrodes and enable to record extracellular activity of neuronal preparations from multiple sites simultaneously in a nondestructive manner.5, 6, 7 MEAs allow the investigation of learning processes and memory8, 9, 10 or network development11, 12, 13 and represent a widely recognized tool for pharmacological researches.14, 15, 16, 17, 18
When approaching neurophysiological and neuropharmacological measures, there are two major technical hitches to face. The first one regards the comparability of data obtained with different MEA chips; the second one is related to biochemical stimulation techniques.
Network functionality measured by MEAs partially depends on culture to culture variability. Therefore, cultures that are seeded at the same time and subjected to the same feeding schedules, and protocols reduce this variability and improve comparability in terms of response to compounds tested.19 Moreover, the increase of MEA system throughput by expanding the number of cultures per plate allows including positive and negative controls within the same plate and testing larger numbers of chemicals in a short period of time. Few attempts have been made by companies such as Ayanda Biosystems (4-well MEAs) and Multichannel Systems (6-well MEAs) to increase the throughput of MEA basic system and to realize multiple macro-chamber structures. Finally, culture to culture variability would be even more limited by keeping seeded tissues under the same medium and by allowing them to experience the same medium changes during the entire growth period.19, 20
Concerning the second issue, spatially resolved delivery of substances is a key feature for pharmacological assays and cell-based biosensors.21 Standard biochemical stimulation techniques make use of graduated pipettes and require a partial or a complete change of cell culture medium. Disadvantages of these protocols are the unknown kinetic of the interaction between molecules and cells, and the rapid variation that is induced within the cellular environment, respectively. Moreover, these stimulation protocols often lack of defined spatio-temporal control22 and are demanding in terms of reagents consumption and costs.23
Over the last few years, microfluidics has evidenced a high impact in neurobiology.24, 25, 26, 27, 28 Both 2D (Refs. 29, 30, 31, 32, 33, 34) and 3D (Refs. 33, 35, and 36) invitro studies of neuronal populations were performed, and multisite electrophysiology by means of MEAs was carried on.15, 37, 38, 39, 40, 41, 42, 43
Recently, the importance of microfluidic techniques has been widely recognized also in pharmacological studies and drug screening applications.23 Indeed, microfluidics can be used for local cell stimulation, for the creation of dynamic concentration gradients or for high content pharmacological screening.38 Furthermore, microfluidics can precisely define the biochemical cell microenvironment,44 it allows a localized pharmacological intervention45 and the delivery of micro-scale volumes of drugs to the desired neurons.46 Although microfluidic systems have shown potential in neuropharmacology, up to now few efforts have been dedicated to microfluidic-based neuropharmacological platforms.46 Tools, based on microfluidic structures, were proposed. These enable the delivery of chemicals locally to specific regions of the cellular culture. Specifically, a parallel pumping scheme and multiple laminar flows were used for localized chemical stimulation of cardiomyocytes47 and myoblasts.48 These systems were also combined with patch clamp technique and used to study single neurons.21, 49 Besides, Kraus and collaborators integrated microfluidic devices with MEA technology50 and tested them on HL1 cardiomyocyte cultures.
So far, there are no microfluidic devices able to selectively and locally stimulate subgroups of neurons grown and maintained in identical environmental conditions for pharmacological and toxicological tests.
In this work, a microfluidic device for biochemical stimulation of neuronal networks was developed. Specifically, a micro-chamber for cell culturing was provided with a thin wall, which partially divided the cell culture region in two sub-compartments. The device was reversibly coupled to a flat MEA and used to seed primary neurons which originated two parallel neuronal networks. These sub-networks were cultured in the same microenvironment, and their electrophysiological activity was monitored by means of MEA electrodes. Furthermore, thanks to the microfluidic design, they were independently stimulated in a spatial and temporal controlled manner. The possibility of stimulating each neuronal network individually was demonstrated as a proof of concept by delivering to each individual compartment tetrodotoxin (TTX), a neurotoxin known to block action potentials.
MATERIALS AND METHODS
Device fabrication
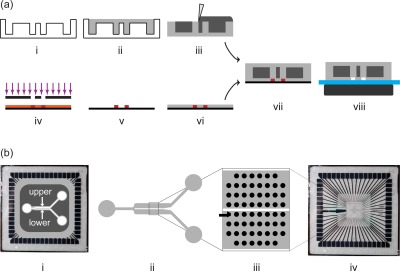
A two-step fabrication process was developed to obtain microfluidic devices which were reversibly bonded to MEAs through magnetism, as previously described.43, 51 In Figure 1a, a schematic illustration of the main fabrication steps of the device is shown. Briefly, the process includes the manufacturing of a top layer, made of poly(dimethylsiloxane) (PDMS) and iron micropowder, and a PDMS bottom layer, containing microfluidic channels. The top layer, containing cavities for the inclusion of magnetic suspension, was realized by replica molding on a machined poly(methyl metacrylate) (PMMA) substrate. The cured PDMS structure was manually filled with an iron powder/PDMS suspension (in a ratio 4:1, w/w) and cured in oven at 80 °C for 120 min. The bottom layer, containing the microfluidic channels, was obtained by replica molding from a silicon/SU8 4 in. wafer master obtained through standard soft lithography techniques.52 PDMS was spin coated on the mold, degassed and cured in oven at 80 °C for 60 min. Subsequently, the top layer was manually aligned under a stereomicroscope to the partially cured bottom layer with iron powder filled openings downside. By means of a biopsy puncher (tip diameter 8 mm) input and output wells were created (approximate volume of 400 μl each). The fluidic device was finally assembled by closing the channels against a 60-electrodes flat MEA biochip (electrode spacing 200 μm, electrode diameter 30 μm; Multi Channel Systems, MCS GmbH, Figure 1b—(iv)) and by placing a neodymium magnet (40 × 20 × 10 mm, magnetization N42) on the opposite side (Figure 1a). Direct optical inspection of microfluidic channels was possible through the top layer, upon temporary magnet removal.
Figure 1.
(a) Schematic illustration of the fabrication process. To obtain the magnetic layer: (i) a PMMA mold was realized with a Computer Numerical Control (CNC) milling machine at a final depth of 5 mm and (ii) used to cast a PDMS layer, (iii) filled with a ferromagnetic suspension (iron powder/PDMS mixture). To obtain the fluidic layer (iv)-(vi) PDMS was spin-coated on a silicon mold (thickness of 250 μm), previously realized with standard soft-lithography techniques. Finally, (vii) the two layers were manually aligned under a microscope taking advantage of the optical transparency of the top layer in the channel regions, and bonded together. The reversible sealing (viii) on the MEA substrate was guaranteed by placing a permanent magnet beneath. (b) Layout of the microfluidic platform. (i) Top view of the assembled device on a flat 60-electrode MEA, where the upper and lower compartments are indicated. (ii) Layout of the fluidic channels partially separated by a central thin wall. (iii) The wall also separates the 60 MEA electrodes in two symmetric subgroups. (iv) A standard flat MEA chip.
The fluidic layout, with a constant thickness of 100 μm, consists of an input channel, a cell culture region and 2 outlet channels (Figure 1b—(ii)). Input and output channels have a width of 500 μm, while the culture region is 2.2 mm wide and 7 mm long. A 100 μm wide wall is present, which partially divides the cell culture chamber in two symmetric sub-channels of 1050 μm in width. The wall also separates 60 MEA electrodes in two subgroups of 30 electrodes (Figure 1b—(iii)). In the following sections, the two compartments are named upper and lower, in agreement with the layout depicted in Figure 1b—(i).
Fluidic characterization
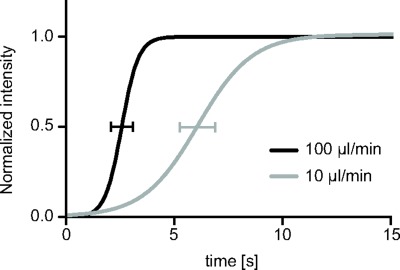
To investigate the influence of flow rate on the chemical stimulation, the input port of the device was connected to a syringe pump (Harvard Apparatus, USA) by means of a conical PDMS cap, which was plugged inside the single inlet well. Deionized water was added into the outlet ports so to fill the device by activating the pump in aspiration mode. A color dye (used as drug model) was added as a tracer in both outlet ports, and the change of the water color intensity, in correspondence of the electrodes region, was recorded through a CCD camera (Unibrain, Greece) mounted on a stereomicroscope. Videos, acquired at 20 Hz, were processed with the public software imagej. Color intensities were extracted from each video frame and normalized to the final values recorded. Finally, values were fitted with a sigmoidal curve through the Levenberg-Marquardt algorithm. The flow rate was set to 10 μl/min and 100 μl/min, and three experiments were carried on for each value (n = 3).
Cell culture protocol
Device surface treatment and cell preparation were carried out according to a previous work of our group.43 Briefly, it was preconditioned with 100% EtOH for 10 min and successively rinsed with bidistilled and autoclaved water. Then, a solution of plating medium (neurobasal medium (NBM; Invitrogen)), 10% fetal bovine serum (FBS; Lonza), 1% penicillin and streptomycin, (Gibco) was administered for 2 h, to increase the surface hydrophilicity. After rinsing with clean water, the surface was treated with 2 mg/ml poly-L-lysine (Sigma) and placed overnight in a humidified incubator at 37 °C (5% CO2). Finally, the device was thoroughly rinsed with water.
Primary neuronal cultures were prepared from CD1 mouse embryos at E17. Hippocampi were extracted, treated with trypsin (0.25%; Sigma) for 10 min at 37 °C and mechanically dissociated by a gentle pipetting. Cells were concentrated to 2 × 10⁶ cells/ml and 30 μl of cell suspension was loaded through the single inlet. Furthermore, cells were plated at the same density on two standard macro-well MEAs (electrode spacing 200 μm, electrode diameter 30 μm; Multi Channel Systems, MCS GmbH). Then, the microfluidic devices and the MEAs were incubated for 4 h, and successively medium was changed with fresh one composed of NBM, B-27 1 × (Invitrogen), 1% penicillin and streptomycin and glutamax 1 mM (Invitrogen). The medium was changed every 12 h until the end of the experiment.
Electrophysiological evaluation of twin networks
Morphology and density of each sub-culture were evaluated daily by means of optical microscopy. To assess the likelihood of couples of sub-networks grown within the same device (twin networks), 5 min electrophysiological recordings under static conditions were performed at 14 days invitro (DIV) for each device. A commercial signal amplification and data acquisition system (MEA1060, Multi Channel Systems, MCS GmbH) were used with a gain and a sampling frequency of 1100 and 25 kHz, respectively. Spikes were detected from raw data with mcrack software (Multi Channel System, MCS GmbH), using for each channel a fixed threshold equal to seven times the standard deviation of average noise amplitude in the first acquired 500 ms. The off-line analysis was implemented in matlab (The Mathworks, Natick, USA) by means of standard algorithms for burst and network burst (NB) identification.53, 54 For each compartment, the following parameters were extracted and used to compare twin networks: (1) the number of channels displaying spikes, (2) the number of channels displaying bursts, (3) the burst duration (in seconds), (4) the intra-burst frequency (in Hz), (5) the number of channels displaying NBs, (6) the NB duration (in seconds), and (7) the network bursting rate (i.e., number of NBs in 1 min).
Afterwards, a cross correlation analysis55 was performed inside each compartment (intra-compartment) and between compartments (inter-compartments) to assess independence between the two neuronal networks. Specifically, the inter-compartment values were calculated as (1) cross-correlation among electrodes across the wall and (2) cross-correlation among the electrodes placed closest to its end. Furthermore, cross-correlation on shuffled data was evaluated. Shuffled values were previously generated simulating random data sharing, with the corresponding experimental data, the number of spikes for each electrode, but with shuffled interspike interval distribution.55, 56 Both intra- and inter-compartment values were compared to shuffled ones by means of a Mann-Whitney test. As control, values of cross correlation were computed within the two standard MEAs and between them, i.e., on two completely separated cultures. These values were compared with those obtained between the sub-networks cultured within the microfluidic devices by means of the Mann-Whitney test. Statistical analyses were performed with the commercial tool statistica (StatSoft, Inc.). The significance level was established at p < 0.05.
Pharmacological stimulation
Drug delivery experiments were performed at 14 DIV successively to static recordings. Delivery flow rate was selected according to the observations performed in the fluidic characterization section. Specifically, cell culture medium was perfused inside both channels at 10 μl/min. Next, cells plated inside the upper channel were stimulated with 0.5 μM TTX, while cells in the lower compartment were continuously subjected to medium flow. TTX concentration was fixed to 0.5 μM, an adequate concentration to silence neuronal network activity without permanently harm its physiology.19 This pharmacological stimulation was continued for 3 min at 10 μl/min. Then, a flow rate of 300 μl/min was used to wash cell cultures for 5 min. The corresponding shear stress induced on cells was about 9 dynes/cm2, and this did not alter the adhesion of neurons.57Afterward, the same protocol was applied in a mirrored configuration; the lower channel was treated with TTX for 3 min, while the upper one was used as control.
Electrophysiological recordings were performed continuously during drug stimulation using the equipment previously described. Mean firing rate (MFR) values were computed in each compartment (bin width 60 s) during delivery of TTX and fresh medium and used to evaluate the average intensity of the electrical activity.
RESULTS
Fluidic characterization
The kinetic of dye injected from either outlet wells is depicted in Figure 2. Sigmoidal curves, fitted from intensities of both flow rates tested (10 μl/min and 100 μl/min), are plotted together with the corresponding standard deviation bars of V50 values. V50 is the time point at which the intensity reaches the relative value of 0.5. As the time axis is synchronized to the dye injection, V50 depends on the length of the fluidic path, and it increases when flow rate decreases (V50 is 6.1 ± 1.67 and 2.5 ± 1.04 s for flow rates of 10 μl/min and 100 μl/min, respectively). The slope of each sigmoidal curve, instead, is an estimate of the velocity at which the dye completely fills the observation region. Slope values are 1.25 ± 0.51 and 0.38 ± 0.11 s for flow rates of 10 μl/min and 100 μl/min, respectively.
Figure 2.
Dye concentration profiles which results from quantitative evaluation of the color intensity in each image acquired with a camera during the dye delivery. The flow rate was set to 10 μl/min (gray line) and to 100 μl/min (black line). Standard deviation of V50 values of three curves acquired is also added to both profiles. Within few seconds the dye reaches its maximal concentration at both flow rates.
As both flow rates tested and provided a complete delivery within 14 s, which barely represents 8% of the entire stimulation phase, a conservative flow rate of 10 μl/min was chosen to deliver TTX in the pharmacological stimulation protocol. Indeed, flow rate induces shear stresses and these can perturb cell responses compared to static conditions, thus potentially altering the recording activity.
Similarity of twin networks
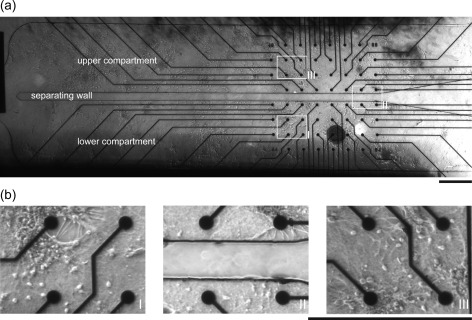
Hippocampal neurons grew inside both compartments. From a fluidic standpoint, the two environments were connected during the entire culture period, thus providing cells with similar microenvironments. Optical inspection highlighted homogeneous cell density and similar morphology of each sub-network (Figure 3). Furthermore, 14 DIV networks were characterized in terms of cell composition by means of immunostaining experiments. These revealed that cultures were composed mostly by neurons, which extended neurites forming a rich network, and few astrocytes (Figure S1 in the supplementary material58).
Figure 3.
(a) 5× differential interference contrast (DIC) image of a neuronal network grown within the microfluidic device. In the middle, it is possible to observe the 100 μm wall which creates two symmetric compartments without affecting the electrode functionality. The image is a combination of 16 individually 5× pictures. (b) High resolution images of neurons cultured within the device in the (I) lower and (III) upper compartment, and (II) in the region across the separating wall. Scale bars are 500 μm.
Besides, activity features were evaluated quantitatively in the two compartments and no significant differences were evidenced between them (Table TABLE I., p > 0.05).
TABLE I.
Electrophysiological parameter values which describe neuronal activity in the lower and upper compartments. Median and percentiles (n = 3) are reported. No significant differences were identified by Mann-Whitney test (p > 0.05 for each parameter).
| No. spiking channels | % bursting channels | Burst length (s) | Intra-burst frequency (Hz) | No. NB channels | NB length (s) | NB rate (min−1) | |
|---|---|---|---|---|---|---|---|
| Upper compartment | 9 ± 0 | 0.33 ± 0.05 | 0.43 ± 0.02 | 69.92 ± 18.18 | 1.37 ± 0.54 | 0.64 ± 0.01 | 1.4 ± 0.15 |
| Lower compartment | 7 ± 1 | 0.28 ± 0.02 | 0.31 ± 0.29 | 60.69 ± 38.53 | 0.68 ± 0.59 | 0.29 ± 0.05 | 1.9 ± 0.75 |
Independency of twin networks
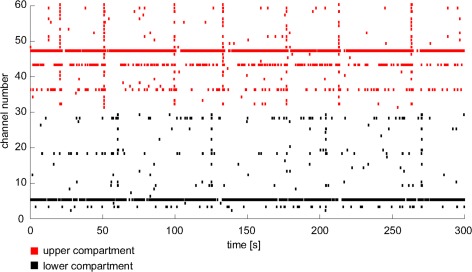
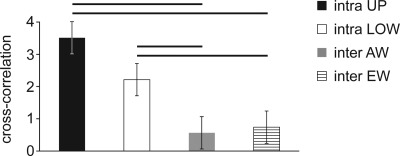
Electrophysiological evaluations showed that synchronous phenomena were clearly uncorrelated between the two sub-networks. Figure 4 depicts 5-min spike trains for all the active electrodes. Specifically, red bars refer to spikes occurring in the upper compartment, while black bars represent spikes in the lower one. Cross correlation analysis confirmed these qualitative observations. Indeed, correlation within each compartment (intra-compartment) was significantly different from cross correlation computed on shuffled data (p < 0.01), which identified a non-random correlation value. Moreover, intra-compartment correlation was significantly higher than correlation calculated between compartments (inter-compartment), which proved that the twin networks were not functionally connected (Figure 5, p < 0.05). In particular, inter-compartment values were about the 35% of the intra-compartment cross correlation and the percentage of cross correlation between two independent MEAs, used as control, was 39% (this related to their respective intra-correlation). Therefore, we identified this percentage as a roughly fixed amount of correlation between different networks that originated from the same plating. Specifically, this value is likely due to an inherent similarity between networks caused by the fact that they were obtained by the same feti and seeded in the same conditions.
Figure 4.
Example of neuronal electrical activity within a dual channel device. Each bar line represents a spike detected by electrodes of the upper (red) or the lower (black) compartment.
Figure 5.
Cross correlation values inside the upper compartment (black bar) and the lower compartment (white bar). Cross correlation values among electrodes across the wall (gray bar) and among the electrodes placed closest to its end (striped bar). Median and percentiles are shown (n = 3). Each horizontal black line identifies a significant difference (Mann-Whitney, p < 0.05).
Pharmacological stimulation
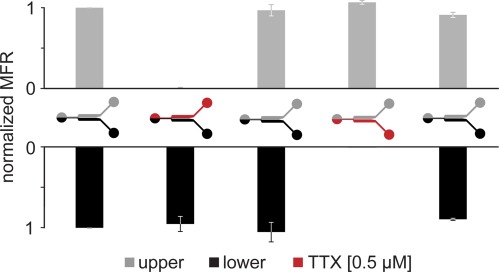
The device was tested for resolved drug delivery spatially and temporally. According to dye delivery tests, TTX delivery was carried out at a flow rate of 10 μl/min. The mean firing rate rapidly decreased as expected during its injection in the treated side, and it was possible to continuously follow the TTX-neuron kinetic, due to the absence of stimulus artifacts. Particularly, the electrical activity was silenced in less than 20 s (Figure S2 in the supplementary material58). In contrast, the untreated compartment maintained a constant firing rate. Moreover, the reversible interaction between TTX molecules and neurons gave the possibility of washing the treated side and successively performing the same protocol in a mirrored configuration. Figure 6 shows normalized MFR values of five significant time events during a stimulation experiment. First, neuronal activity in both compartments was acquired during fresh medium addition. Then, TTX was added in the upper compartment, inducing the MFRupper to drastically decrease. In contrast, MFRlower remained constant. Subsequently, both compartments were washed with fresh medium and the activity of the upper network recovered. This underlined that the selected flow rate (300 μl/min) was sufficient for a complete washing but not high enough to compromise cellular adhesion and neuronal physiology. Then, TTX was added in the lower compartment, letting the MFRlower decreases down to zero, and again recover after fresh medium addition. Data are given as median and its variation stated as percentiles (25th and 75th, n = 4).
Figure 6.
Stimulation experiments of the upper (gray) and lower (black) compartments. Values are mediated on 1 min bins and normalized on the first untreated value. Variability is stated as 25th and 75th percentiles. Red identifies 0.5 μM TTX treatment.
DISCUSSION
Electrophysiological and neuropharmacological tests are currently carried out by means of stand-alone cultures grown on macro-well MEAs.14, 15, 16, 17 However, these experiments usually evidence the need of reducing culture to culture variability19 and of identifying new techniques for biochemical stimulation.22, 23
Over the last 10 years, few attempts have been made to increase the throughput of MEA basic system and to reduce the culture to culture variability.19 Furthermore, the ability to deliver chemicals locally to specific regions of a cellular culture has raised interests in molecular and cellular biology.46 Particularly, microfluidics has shown great potential in the study of pharmacology.21, 47, 48, 49 Indeed, the use of laminar flows in capillary channels can be used for the area-selective delivery of chemicals to adhered cells.
Exploiting this methodology, in this work for the first time a micro-chamber device for spatially and temporally controlled drug stimulation of twin neuronal networks grown on micro electrode arrays is presented. The proposed platform solves both the drawbacks of standard stimulation techniques (i.e., non-selectivity, difficult localization of the stimuli, undesired neuronal responses, electrode saturation) and the problem of inter-culture variability due to the use of different and separated substrates for cell cultures.
We had previously demonstrated that a similar device was a good solution for the long-term growth of dissociated neurons in a controlled microenvironment.43 Here, we present a dual channel configuration, which was obtained by adding a thin wall in the middle of the cell culture channel. The separating wall partially divided the device in two compartments, which were in communication under static conditions, while they were fluidically separated during the drug delivery. Moreover, the wall dimension matched the inter electrode distance which allowed not to lose active recording electrodes.
This configuration allowed the arrangement of neuronal cells into two twin networks, whose similarity was qualitatively evaluated in morphology, and quantitatively verified by comparing descriptors of the electrophysiological activity computed inside both compartments. Then, it was also quantified the functional connectivity between the two sub-networks. Specifically, the inter-compartmental functional connectivity was compared with the connectivity that was established in the network within a single compartment (intra-compartmental functional connectivity), revealing that functional connectivity was influenced by the compartmentalization. Therefore, this device can be used to culture twin networks similar in cell density and functionality and not functionally connected. Although these two networks conceptually correspond to two individual MEAs, cells are here seeded together and growth in the same biochemical microenvironment, thus reducing the experimental variability.19
Furthermore, it was proven the relevance of the twin network configuration in drug delivery experiments. First, the experimental concentration profile of the dye was assessed and attested the possibility of using low flow rates and concurrently reaching maximal concentration values after a limited and controlled time extent. Then, it was demonstrated the possibility of stimulating each neuronal network individually. It was observed neither electrode saturation nor cell undesirable response during molecule delivery. This allowed following continuously the drug kinetic.
To conclude, the proposed microfluidic approach represents an innovative methodology to perform biological, pharmacological, and electrophysiological experiments on neuronal networks. Indeed, thanks to the features offered by microfluidics, the device configuration developed makes the delivery of substances to cells easier and cheaper than traditional methods. Furthermore, it overcomes the limitations due to standard drug stimulation techniques such as unknown drug-cell interaction kinetic, inaccurate drug concentration, uncontrolled time duration necessary for a maximal stimulation, electrode saturation, and cellular response caused by rapid macro-environmental changes. Finally, the twin network configuration reduces biological variability, improves comparability of compounds tested, allows including positive and negative controls within the same plate and shortens the experimental timescale. Therefore, the device has important rebounds on pharmacological screening and thus represents a new experimental approach for invitro cellular physiology in health and in disease.
ACKNOWLEDGMENTS
The authors would like to thank Dr. Luca Muzio and Roberta De Ceglia for their help in neuronal culture preparation. This study was partially supported by Fondazione Cariplo, Grant No. 2008-2531, and by the ‘‘Biosensors and artificial bio-systems’’ convention between the Italian Institute of Technology and Politecnico di Milano.
References
- Habets A. M., Van Dongen A. M., Van Huizen F., and Corner M. A., Exp. Brain Res. 69, 43 (1987). 10.1007/BF00247027 [DOI] [PubMed] [Google Scholar]
- Shahaf G. and Marom S., J. Neurosci. 21, 8782 (2001). [DOI] [PMC free article] [PubMed] [Google Scholar]
- Ghezzi D., Pedrocchi A., Menegon A., Mantero S., Valtorta F., and Ferrigno G., BioSystems 87, 150 (2007). 10.1016/j.biosystems.2006.09.008 [DOI] [PubMed] [Google Scholar]
- Li Y., Zhou W., Li X., Zeng S., Liu M., and Luo Q., Biosens. Bioelectron. 22, 2976 (2007). 10.1016/j.bios.2006.12.018 [DOI] [PubMed] [Google Scholar]
- Gross G. W., IEEE Trans. Biomed. Eng. 26, 273 (1979). 10.1109/TBME.1979.326402 [DOI] [PubMed] [Google Scholar]
- Pine J., J. Neurosci. Methods 2, 19 (1980). 10.1016/0165-0270(80)90042-4 [DOI] [PubMed] [Google Scholar]
- Perelman Y. and Ginosar R., IEEE Trans. Biomed. Eng. 54, 130 (2007). 10.1109/TBME.2006.883732 [DOI] [PubMed] [Google Scholar]
- Jimbo Y., Tateno T., and Robinson H. P., Biophys. J. 76, 670 (1999). 10.1016/S0006-3495(99)77234-6 [DOI] [PMC free article] [PubMed] [Google Scholar]
- Demarse T. B., Wagenaar D. A., Blau A. W., and Potter S. M., Auton. Rob. 11, 305 (2001). 10.1023/A:1012407611130 [DOI] [PMC free article] [PubMed] [Google Scholar]
- Baruchi I. and Ben-Jacob E., Phys. Rev. E. Stat. Nonlinear Soft. Matter. Phys. 75, 050901 (2007). 10.1103/PhysRevE.75.050901 [DOI] [PubMed] [Google Scholar]
- van Pelt J., Wolters P. S., Corner M. A., Rutten W. L. C., and Ramakers G. J. A., IEEE Trans. Biomed. Eng. 51, 2051 (2004). 10.1109/TBME.2004.827936 [DOI] [PubMed] [Google Scholar]
- Chiappalone M., Bove M., Vato A., Tedesco M., and Martinoia S., Brain Res. 1093, 41 (2006). 10.1016/j.brainres.2006.03.049 [DOI] [PubMed] [Google Scholar]
- Chiappalone M., Vato A., Berdondini L., Koudelka-Hep M., and Martinoia S., Int. J. Neural. Syst. 17, 87 (2007). 10.1142/S0129065707000968 [DOI] [PubMed] [Google Scholar]
- Chiappalone M., Vato A., Tedesco M., Marcoli M., Davide F., and Martinoia S., Biosens. Bioelectron. 18, 627 (2003). 10.1016/S0956-5663(03)00041-1 [DOI] [PubMed] [Google Scholar]
- Morin F. O., Takamura Y., and Tamiya E., J. Biosci. Bioeng. 100, 131 (2005). 10.1263/jbb.100.131 [DOI] [PubMed] [Google Scholar]
- Boehler M. D., Wheeler B. C., and Brewer G. J., Neuron. Glia. Biol. 3, 127 (2007). 10.1017/S1740925X07000440 [DOI] [PMC free article] [PubMed] [Google Scholar]
- Chen Y., Guo C., Lim L., Cheong S., Zhang Q., Tang K., and Reboud J., Anal. Chem. 80, 1133 (2008). 10.1021/ac071182j [DOI] [PubMed] [Google Scholar]
- Ghezzi D., Menegon A., Pedrocchi A., Valtorta F., and Ferrigno G., J. Neurosci. Methods 175, 70 (2008). 10.1016/j.jneumeth.2008.08.003 [DOI] [PubMed] [Google Scholar]
- Johnstone A. F. M., Gross G. W., Weiss D. G., Schroeder O. H. U., Gramowski A., and Shafer T. J., Neurotoxicology 31, 331 (2010). 10.1016/j.neuro.2010.04.001 [DOI] [PubMed] [Google Scholar]
- Gross G. W. and Gopal K. V., Adv. Netw. Electrophysiol. II, 193 (2006). 10.1007/b136263 [DOI] [Google Scholar]
- Mourzina Y., Kaliaguine D., Schulte P., and Oenhäusser A., Anal. Chim. Acta 575, 281 (2006). 10.1016/j.aca.2006.06.010 [DOI] [PubMed] [Google Scholar]
- Kothapalli C. R., van Veen E., de Valence S., Chung S., Zervantonakis I. K., Gertler F. B., and Kamm R. D., Lab Chip 11, 497 (2011). 10.1039/c0lc00240b [DOI] [PubMed] [Google Scholar]
- Sung J. H., Kam C., and Shuler M. L., Lab Chip 10, 446 (2010). 10.1039/b917763a [DOI] [PubMed] [Google Scholar]
- Campenot R. B., Proc. Natl. Acad. Sci. U.S.A. 74, 4516 (1977). 10.1073/pnas.74.10.4516 [DOI] [PMC free article] [PubMed] [Google Scholar]
- Gross P. G., Kartalov E. P., Scherer A., and Weiner L. P., J. Neurol. Sci. 252, 135 (2007). 10.1016/j.jns.2006.11.009 [DOI] [PubMed] [Google Scholar]
- Pearce T. M. and Williams J. C., Lab Chip 7, 30 (2007). 10.1039/b612856b [DOI] [PubMed] [Google Scholar]
- Taylor A. M., Dieterich D. C., Ito H. T., Kim S. A., and Schuman E. M., Neuron 66, 57 (2010). 10.1016/j.neuron.2010.03.022 [DOI] [PMC free article] [PubMed] [Google Scholar]
- Pirlo R. K., Sweeney A. J., Ringeisen B. R., Kindy M., and Gao B. Z., Biomicrofluidics 5, 13408 (2011). 10.1063/1.3552998 [DOI] [PMC free article] [PubMed] [Google Scholar]
- Park J., Koito H., Li J., and Han A., Biomed. Microdevices 11, 1145 (2009). 10.1007/s10544-009-9331-7 [DOI] [PMC free article] [PubMed] [Google Scholar]
- Park J., Koito H., Li J., and Han A., J. Vis. Exp. 10, 31 (2009). [DOI] [PMC free article] [PubMed] [Google Scholar]
- Hosmane S., Yang I. H., Ruffin A., Thakor N., and Venkatesan A., Lab Chip 10, 741 (2010). 10.1039/b918640a [DOI] [PubMed] [Google Scholar]
- Kunze A., Meissner R., Brando S., and Renaud P., Biotechnol. Bioeng. 108, 2241 (2011). 10.1002/bit.23128 [DOI] [PubMed] [Google Scholar]
- Gao Y., Majumdar D., Jovanovic B., Shaifer C., Lin P. C., Zijlstra A., Webb D. J., and Li D., Biomed. Microdevices 13, 539 (2011). 10.1007/s10544-011-9523-9 [DOI] [PMC free article] [PubMed] [Google Scholar]
- Majumdar D., Gao Y., Li D., and Webb D. J., J. Neurosci. Methods 196, 38 (2011). 10.1016/j.jneumeth.2010.12.024 [DOI] [PMC free article] [PubMed] [Google Scholar]
- Rowe L., Almasri M., Lee K., Fogleman N., Brewer G. J., Nam Y., Wheeler B. C., Vukasinovic J., Glezer A., and Frazier A. B., Lab Chip 7, 475 (2007). 10.1039/b700795g [DOI] [PubMed] [Google Scholar]
- Kunze A., Giugliano M., Valero A., and Renaud P., Biomaterials 32, 2088 (2011). 10.1016/j.biomaterials.2010.11.047 [DOI] [PubMed] [Google Scholar]
- Pearce T. M., Wilson J. A., Oakes S. G., Chiu S. Y., and Williams J. C., Lab Chip 5, 97 (2005). 10.1039/b407871c [DOI] [PubMed] [Google Scholar]
- Morin F. O., Nishimura N., Griscom L., Lepioue B., Fujita H., Takamura Y., and Tamiya E., Biosens. Bioelectron. 21, 1093 (2006). 10.1016/j.bios.2005.04.020 [DOI] [PubMed] [Google Scholar]
- Ravula S. K., Wang M. S., McClain M. A., Asress S. A., Frazier B., and Glass J. D., Neurosci. Lett. 415, 34 (2007). 10.1016/j.neulet.2007.01.009 [DOI] [PMC free article] [PubMed] [Google Scholar]
- Dworak B. J. and Wheeler B. C., Lab Chip 9, 404 (2009). 10.1039/b806689b [DOI] [PMC free article] [PubMed] [Google Scholar]
- Kanagasabapathi T. T., Wang K., Mellace M., Ramakers G. J., and Decre M. M., Conf. Proc. IEEE Eng. Med. Biol. Soc. 2009, 1655 (2009). [DOI] [PubMed] [Google Scholar]
- Kanagasabapathi T. T., Ciliberti D., Martinoia S., Wadman W. J., and Decré M. M. J., Front. Neuroeng. 4, 13 (2011). 10.3389/fneng.2011.00013 [DOI] [PMC free article] [PubMed] [Google Scholar]
- Biffi E., Menegon A., Piraino F., Pedrocchi A., Fiore G. B., and Rasponi M., Biotechnol. Bioeng. 109, 166 (2012). 10.1002/bit.23310 [DOI] [PubMed] [Google Scholar]
- Taylor A. M. and Jeon N. L., Curr. Opin. Neurobiol. 20, 640 (2010). 10.1016/j.conb.2010.07.011 [DOI] [PubMed] [Google Scholar]
- Shi P., Nedelec S., Wichterle H., and Kam L. C., Lab Chip 10, 1005 (2010). 10.1039/b922143c [DOI] [PMC free article] [PubMed] [Google Scholar]
- Wang J., Ren L., Li L., Liu W., Zhou J., Yu W., Tong D., and Chen S., Lab Chip 9, 644 (2009). 10.1039/b813495b [DOI] [PubMed] [Google Scholar]
- Kaji H., Nishizawa M., and Matsue T., Lab Chip 3, 208 (2003). 10.1039/b304350a [DOI] [PubMed] [Google Scholar]
- Zhu X., Chu L. Y., Chueh B. H., Shen M., Hazarika B., Phadke N., and Takayama S., Analyst 129, 1026 (2004). 10.1039/b407623k [DOI] [PubMed] [Google Scholar]
- Pihl J., Sinclair J., Sahlin E., Karlsson M., Petterson F., Olofsson J., and Orwar O., Anal. Chem. 77, 3897 (2005). 10.1021/ac050218+ [DOI] [PubMed] [Google Scholar]
- Kraus T., Verpoorte E., Linder V., Franks W., Hierlemann A., Heer F., Hazovic S., Fujii T., de Rooij N. F., and Koster S., Lab Chip 6, 218 (2006). 10.1039/b511768b [DOI] [PubMed] [Google Scholar]
- Rasponi M., Piraino F., Sadr N., Laganà M., Redaelli A., and Moretti M., Microfluid. Nanofluid. 10, 1097 (2011). 10.1007/s10404-010-0738-5 [DOI] [Google Scholar]
- Xia Y., McClelland J., Gupta R., Qin D., Zhao X. M., Sohn L. L., Celotta R. J., and Whitesides G. M., Adv. Mater. 9, 147 (1997). 10.1002/adma.19970090211 [DOI] [Google Scholar]
- van Pelt J., Vajda I., Wolters P. S., Corner M. A., and Ramakers G. J. A., Prog. Brain Res. 147, 173 (2005). [DOI] [PubMed] [Google Scholar]
- Chiappalone M., Novellino A., Vajda I., Vato A., Martinoia S., and van Pelt J., Neurocomputing 65, 653 (2005). 10.1016/j.neucom.2004.10.094 [DOI] [Google Scholar]
- Biffi E., Menegon A., Regalia G., Maida S., Ferrigno G., and Pedrocchi A., J. Neurosci. Methods 199, 321 (2011). 10.1016/j.jneumeth.2011.05.010 [DOI] [PubMed] [Google Scholar]
- Perkel D. H., Gerstein G. L., and Moore G. P., Biophys. J. 7, 391 (1967). 10.1016/S0006-3495(67)86596-2 [DOI] [PMC free article] [PubMed] [Google Scholar]
- Rocha A., Jian K., Ko G., and Liang H., J. Appl. Phys. 108, 024702 (2010). 10.1063/1.3456504 [DOI] [Google Scholar]
- See supplementary material at http://dx.doi.org/10.1063/1.3699975 for the morphological characterization of a culture by means of immunostaining images and for the kinetic of TTX cell interaction both in micro and macro devices.


