

Abstract
Objective
To determine the long-term effects of iron deficiency on the neural correlates of recognition memory.
Study design
Non-anemic control participants (n=93) and 116 otherwise healthy formerly iron-deficient anemic (FIDA) Chilean children were selected from a larger longitudinal study. Participants were identified at 6, 12, or 18 months as iron-deficient anemic or non-anemic and subsequently received oral iron treatment. This follow-up was conducted when participants were 10 years old. Behavioral measures and event-related potentials from 28 scalp electrodes were measured during an old/new word recognition memory task.
Results
The new/old effect of the FN400 amplitude, where new words are associated with greater amplitude than old words, was present within the control group only. The control group also showed faster FN400 latency than the FIDA group and larger mean amplitude for the P300 component.
Conclusions
Although overall behavioral performance is comparable between groups, the results show that group differences in cognitive function have not been resolved ten years after iron treatment. Long-lasting changes in myelination and energy metabolism, perhaps especially in the hippocampus, may account for these long-term effects on an important aspect of human cognitive development.
Keywords: anemia, event-related potentials, P300, FN400, hypomyelination, hippocampus, continuous recognition memory
Iron deficiency in utero or early in postnatal life may effect brain development in several ways. It alters the development of oligodendrocytes, not only resulting in hypomyelination of white matter, but also may be linked to changes in startle response, auditory evoked potentials, and motor function in infants1,2. Alterations in neurochemistry as a result of early iron deficiency include altered function of neurotransmitters 3. Many cognitive and behavioral tasks rely on proper functioning of the nigrostriatal dopaminergic and mesolimbic pathways, which are dependent on these neurotransmitters. Additionally, iron deficiency alters metabolism of cytochrome oxidase, which negatively impacts the ability of the brain to generate and use metabolic energy, perhaps especially in the hippocampus4,5. Iron deficiency also causes abnormal protein scaffolding during crucial periods of synaptogenesis, which has been shown to permanently alter the formation of dendritic structures and synapses within the hippocampus5,6,7.
This study focuses on a population of Chilean school-aged children. The children were identified as iron deficient anemia (IDA) at either 6, 12, or 18 months and then treated, along with the controls, with oral iron. After treatment, all children reached normal iron status and controls were monitored to ensure that normal iron status was maintained. At 4 years of age, analyses of auditory brainstem responses (ABR) and visually evoked potentials (VEP) revealed that the speed of transmission through the auditory and visual systems of the formerly iron-deficient anemic (FIDA) children was still not as fast as the controls8. The findings suggest that early IDA, which has been shown to decrease neuronal metabolism and negatively affect neurotransmission processes, was still not corrected by the age of 4 years despite treatment. The current study, in which the participants were approximately 10 years old, uses event-related potentials (ERPs) during a recognition memory task to explore the potential neurological effects of altered cell metabolism and morphology on brain regions involved in memory processes.
The link between recognition memory and the function of the hippocampus has been demonstrated in a number of studies9,10. Because the hippocampus is involved in recognition memory processing that may be disproportionately affected by early iron deficiency, there is reason to believe that hippocampal differences may underlie any observed group differences between the two groups of children. Based on findings from a previous study of IDA infant with similar experimental design11, we predicted that potential hypomyelination as a result of early iron deficiency in FIDA children would be associated with impairments in recognition memory and reduced ERP amplitudes during a recognition memory task.
Methods
The children in this study were involved in previous research in Chile on the behavioral, developmental, and neurofunctional effects of IDA. All participants were healthy, full-term infants (≥ 3 kg) with no prenatal complications or acute or chronic illnesses. Anemia was defined as venous hemoglobin ≤100 g/L at 6 mo and <110 g/L at 12 and 18 mo. Iron deficiency was defined as two of three iron measures in the iron-deficient range (mean corpuscularcell volume <70 flfL, erythrocyte protoporphyrin >100 μg/dldL red blood cells [1.77 nmol/l]), serum ferritin <12 μg/l) and/or an increase in Hb ≥10 g/l after 6 mo of iron therapy12. Each time an IDA infant was identified, the next non-anemic infant of the same age was invited to join the control group. Those children identified as IDA at 6 months of age were treated with 15 mg/d of elemental iron as oral ferrous sulfate for a period of 1 year. Those identified at 12 or 18 months were treated with 30 mg/d of oral iron supplements for a minimum of 6 mo. Of the infants with post-treatment measures of iron status, IDA was corrected in all but one. Because of the high prevalence of iron deficiency in Chile, infants from the control group were also treated with iron to ensure that they did not become iron-deficient. Detailed information on the children’s background and the design of the previous studies with this sample has been published previously13,14.
Participants in the current study were 209 children (93 controls, 116 FIDA). Of these 209 participants, 54 (26%) were excluded from further analyses for low behavioral performance (fewer than 75% correct), 50 participants (24%) were excluded for excessive movement artifact, 8 participants (3%) were excluded for EOG contamination, and 2 participants (1%) were excluded because of technical issues. Thus, the final sample consisted of 44 controls (23 female) and 51 FIDA (19 female).
Stimuli and Task Procedure
Participants sat on a comfortable chair in a dimly lit room approximately 65 cm from the computer screen and were tested in a recognition memory task. The stimuli consisted of 176 pictures of Spanish words that were determined to be within the vocabulary of the average 10-year-old Chilean child. The word stimuli were presented as white letters on a black background in the center of a 19” computer monitor subtending a visual angle of 4° × 11°. The stimuli were divided into four blocks of 72 trials each, with 288 total trials available. For each of the four blocks, participants were presented with a word stimulus (new) followed by either another new word or one that had been presented previously (old). Each block of 72 trials had exactly 44 ‘new’ words, and 28 ‘old’ words (i.e., repeated ‘new’ words) that were presented after a lag of 1, 2, 4 or 5 words. Some new words were never presented again as old words. The first and second blocks of trials consisted only of new, lag 1, and lag 4 words, and the third and fourth blocks of trials consisted only of new, lag 2, and lag 5 words. To measure each subject’s performance and attention, participants were asked to press one button for old words and one button for new words. Each trial consisted of a 100ms baseline and a 500ms stimulus presentation, followed by a 1600ms post-stimulus recording. During the post-stimulus recording period, the computer monitor was blank. The inter-trial interval randomly varied from 500–1000ms. All participants viewed the stimuli in the same order. However, not every subject completed all 4 blocks of trials.
Electrophysiological Recording and Processing
Event-related potentials were recorded from 28 scalp electrodes using a modified 10–20 system. Participants wore a close-fitting lycra cap with sewn-in tin electrodes (Electro-Cap International, Eaton, OH). Scalp electrodes (Fz, F3, F4, F7, F8, FC1, FC2, FC5, FC6, C3, C4, CP1, CP2, CP5, CP6, Pz, P3, P4, PO3, PO4, PO7, PO8, O1, O2, T3, T4, T5 and T6) were referenced to Cz during acquisition. Data were also recorded at the left (M1) and right (M2) mastoids. Bipolar vertical EOG was recorded from electrodes placed vertically above (Fp1) and below (Fp2) the right eye, bisecting the midline to record blinks and other eye movements. After cap placement, an abrasive gel was inserted into each electrode site and the scalp under each site was gently abraded. Following scalp abrasion, a small amount of electrode gel was inserted into each electrode site. Electrode impedances were considered acceptable at or below 10 KΩ.. EEG and EOG signals were acquired using a Grass Instruments (West Warwick, RI) Neurodata Acquisition System and amplified using Model 15 amplifiers with a gain of 50,000 for the scalp channels and 5,000 for EOG. The amplifier filter settings were 0.1-30 Hz and a 60 Hz notch filter was applied. All channels were digitized at 200 Hz onto the hard drive of a PC using a 12-bit A/D converter (National Instruments, Austin, TX).
ERP data were edited offline using the ERP32 analysis software package (New Boundary Technologies, Minneapolis, MN). Scalp channels with excessive artifact (> +/− 100 μV) were rejected; the entire trial was rejected if more than four scalp channels exceeded this threshold. Data were re-referenced to an average mastoid configuration, and eye movement-related artifact was corrected15. Only trials on which participants responded correctly were included in subsequent analyses. Individual subject averages were constructed for each stimulus type (correctly remembered ‘old’ words and ‘new’ words) using a 100ms baseline period. Control participants contributed an average of 82 trials per condition, and FIDA participants contributed an average of 86 trials per condition. A separate grand mean was created for each condition by averaging together the individual subject averages.
Inspection of the grand averaged waveforms revealed a series of two well-defined components that were extracted and subsequently analyzed: frontal FN400 (F3, Fz, F4; 300–500ms) and midline P300 (Fz, Cz, Pz; 500–800ms). Electrode groupings and time windows were selected based on previous reports of these components and through visual inspection of the grand-averaged and individual waveforms.
Statistical Analyses
Because hit and false alarm rates reflect response bias (the tendency to respond yes or no) as well as sensitivity (the degree of overlap between signal and noise distributions), signal-detection analyses were used for behavioral data16. The sensitivity index (d’) was calculated to measure the distance between the signal mean (proportion of repeated words that the subject correctly identified as ‘old’) and the noise mean (proportion of new pictures that the subject incorrectly identified as ‘old’). d’ is measured in standard deviation units, where a value of 0 indicates a participant’s inability to differentiate signal from noise, and larger values indicate a greater signal compared with noise. Negative d’ values can result from task confusion. Children who were unable to correctly identify at least 75% of old and new pictures (d’ = 1.25) were rejected from further behavioral analyses.
Statistical analyses were conducted using SPSS version 16.0.1 (SPSS Inc., Chicago, IL). Behavioral (d’ scores, reaction time) and electrophysiological measures (peak amplitude and latency for FN400 and mean amplitude for P300) were analyzed using repeated- measures analyses of variance (RM ANOVA) with Greenhouse-Geisser corrected degrees of freedom. Within-subjects factors were Condition (new, old), and between-subjects factors were Group (control, FIDA). For electrophysiological data, Electrode was also examined as a within-subjects factor.
Sample characteristics that were considered as potential confounders can be found in the Table17,18,19,20,21. Differences in mean scores between FIDA and controls were explored using t-tests or chi-square. The following covariates were found to be significantly different between the two groups (p ≤ .10) and were therefore considered in subsequent analyses as potential confounders: sex, gestational age, maternal depression, maternal education, home environment at 10 years, socioeconomic status at 10 years, and stress score at 10 years. The quality of the participant’s home environment was measured using the Home Observation for Measurement of the Environment Inventory22. Socioeconomic status was measured using a modified version of Graffar’s method, which is designed to establish socioeconomic strata within a population23.
Table.
Summary of sample characteristics organized by group.*
| Group | Former IDA | Control |
|---|---|---|
| (n = 51) | (n = 44) | |
| Child | ||
| Age at test (years) | 10.2 (.22) | 10.2 (.24) |
| Sex, % female (n) | 37.3 (19) | 52.3 (23) |
| Birth weight (g) | 3496.9 (391.7) | 3617.3 (416.8) |
| Gestational age * | 39.3 (1.0) | 39.8 (1.2) |
| Height at 10y (cm) | 139.5 (6.6) | 138.1 (5.4) |
| Weight at 10y (kg) | 38.8 (9.1) | 37.6 (7.6) |
| Participant IQ | 92.1 (10.5) | 95.6 (11.1) |
| Iron status in infancy | ||
| Hemoglobin (g/l) ** | 103.0 (6.6) | 124.3 (7.8) |
| Mean corpuscular volume (fl) ** | 66.9 (4.7) | 75.6 (3.4) |
| Free erythrocyte protoporphyrin (μg/dl)** | 166.3 (68.8) | 89.0 (21.4) |
| Ferritin (μg/l) ** | 7.2 (7.5) | 16.1 (12.6) |
| Iron status at 10y | ||
| Hemoglobin (g/l) * | 132.4 (9.1) | 136.4 (9.3) |
| Mean corpuscular volume (fl) * | 80.7 (3.8) | 82.6 (3.5) |
| Free erythrocyte protoporphyrin (μg/dl) | 68.9 (14.2) | 65.2 (15.4) |
| Ferritin (μg/l) | 23.6 (11.1) | 27.5 (10.6) |
| Family | ||
| Mother’s education (y) * | 9.1 (3.0) | 10.3 (2.7) |
| Mother’s IQ† | 84.6 (10.1) | 85.2 (11.9) |
| HOME score at 10y‡ | 34.5 (8.4) | 39.0 (7.1) |
| SES at 10y **§ | 35.8 (7.3) | 31.5 (7.2) |
| Maternal depressed mood at 10y **|| | 23.7 (15.6) | 13.5 (11.2) |
| Number of life stressors at 10y **¶ | 5.7 (2.7) | 4.2 (2.3) |
Statistically different or hypothesis-driven between-group characteristics were considered for inclusion in all covariate models.
Values are means (SD) for continuous variables and percentages for categorical variables. Statistical significance was determined with either t-tests or χ2.
Significant differences are indicated as follows:
p ≤ .01,
p ≤ .05
Standardized norm = 100 ± 15. IQs in the low 80s are often observed among mothers with this level of education17,18.
Mean score of children 6–10 years old in Little Rock, Arkansas was 41.6 (9.0) 19.
Measured by the Graffar scale, designed to differentiate families at the lower end of the socioeconomic spectrum. Scores of 35.8 and 31.5 fall in the medium range of the lower class spectrum.
Scores range from 0–60; ≥ 16 is considered indicative of depression. The high prevalence of depressed mood in the Chilean mothers is consistent with previous research with Latin American mothers20 and U.S. mothers in economically stressed situations21.
Out of a total of 28.
All covariates were initially entered into the general linear model. Non-significant covariates (p > .10) were eliminated from subsequent models until only significant covariates were included in the final model. When omnibus ANOVAs revealed significant main effects or interactions, post-hoc paired t-tests were conducted using a Bonferroni correction for multiple comparisons.
Results
The Table shows background characteristics of the participants, including iron status in infancy and at 10 years. The mean age at test was 10.2 years for both the FIDA and control groups (range 9.7 to 11.0 years). All participants had normal or corrected-to-normal vision; two participants (both in the control group) were left-handed. Only one child had IDA at 10 years, defined by age-appropriate NHANES II and III cutoffs24,25 as Hb < 112 g/l and two or more abnormal iron measures (mean corpuscular volume <76 fl, erythrocyte protoporphyrin >70 μg/dl red blood cells [1.24 nmol/l], and serum ferritin <10 μg/l), and four children had iron deficiency without anemia, resulting in < 5% overall prevalence of iron deficiency.
Behavioral Data
Due to the block design used in task administration, accuracy as indexed by d’ was analyzed using a 2 Condition (d’ lag 1, d’ lag 4, OR d’ lag 2, d’ lag 5) × 2 Group (controls, FIDA) RM ANOVA. Because not every subject had d’ scores and relevant covariate information for all four blocks, n = 40 for controls and n = 47 for FIDA for the d’ analysis of the first two blocks and controls = 39 and FIDA = 48 for d’ analysis of the last two blocks. After controlling for the background factors that met criteria for the inclusion in the model— maternal depression and SES— analysis of the first two blocks of trials (d’ lag 1, d’ lag 4) revealed no significant effects. After controlling for stress, analysis of the second two blocks of trials (d’ lag 2, d’ lag 5) revealed a main effect of Accuracy, F(1,84) = 11.959, p = .001, whereby d’ for lag 2 (M = 2.66, SD = .87) was significantly larger than d’ for lag 5 (M = 2.44, SD = .86). Of note, there was no Group × Accuracy interaction for either set of trials, where F(1,83) = 0.926, p = .339 for the first two blocks of trials and F(1,84) = 2.151, p = .146 for the second two blocks of trials.
For reaction time analysis, n = 41 for controls and n = 50 for FIDA for the first two runs and controls n = 42 and FIDA n = 49 for the analysis of the last two runs. Analysis of reaction time data for the first two blocks of trials (new words, lag 1, lag 4) revealed a main effect of Group, F(1,89) = 4.171, p = .044, whereby the controls (M = 1003ms, SD = 205) showed significantly faster reaction times than the FIDA group (M = 1085ms , SD = 176). Additionally, there was a main effect of Condition, F(2,88) = 18.355, p < .001, whereby reaction times for new words (M = 998ms, SD = 189) were significantly faster than those for words presented after a lag of 1 (M = 1076, SD = 206) or a lag of 4 (M = 1070, SD = 213). Analysis of the second two blocks of trials (new, lag 2, lag 5) revealed no significant effects. Importantly, there was no Group X Condition interaction in either block of trials, where F(2,89) = 0.463, p = 0.576 for the first blocks and F(2,86) = 0.636, p = .481 for the second blocks of trials.
Electrophysiological Data
Preliminary analyses were conducted in order to determine if there were any electrophysiological differences between lags 1, 2, 4, and 5. Participants were included in this initial set of analyses only if they contributed usable data for both lag 1, 4 and lag 2, 5 trials (25 controls, 29 FIDA). Analyses of each ERP component revealed no significant differences in amplitude or latency between any of the lag conditions. However, old/new effects were evident. All subsequent analyses were collapsed across condition.
FN400
Participants who did not meet the minimum requirement of 10 trials for each of the three frontal electrodes (Fz, F3, and F4) were excluded from analysis of the FN400 component. Participants were also excluded if they had missing values for any covariate that met inclusion criteria for a given analysis. Therefore, controls n = 40 and FIDA n = 48 for amplitude analyses and controls n = 40 and FIDA n = 49 for latency analyses.
After controlling for the three background factors that met criteria for inclusion in the analysis—sex, SES and maternal depression—there was a main effect of Electrode, F(2,82) = 4.027, p = .024, whereby Fz (M = −24.4 μV, SD = 12.8) showed more negative amplitudes than F3 (M = −22.4 μV, SD = 11.9) and F4 ( M = −19.8 μV, SD = 12.2). There was also a Condition × Group interaction for FN400 peak amplitude, F(1,82) = 3.918, p = .051. Post-hoc tests indicated that for controls only, new words (M = −11.7 μV, SD = 6.0) elicited more negative overall amplitude than old words (M = −10.2 μV, SD = 6.6) (Figure 1).
Figure 1.

Topographic distribution of scalp potentials to new and old words for A, controls and B, FIDA at 344 milliseconds poststimulus. Grand averaged ERP waveforms for C, controls and D, FIDA over the left frontal electrode (F3). The x-axis represents latency in milliseconds (ms), and the y-axis represents amplitude in microvolts (μV).

 New Words
 Old Words
Both HOME score and maternal depression met criteria for inclusion in the analyses of FN400 latency. After controlling for these covariates, there was a main effect of Group, F(1,85) = 9.652, p = .003, whereby controls (M = 360.0ms, SD = 31.2) showed significantly faster overall latency than the FIDA group (M = 383.7ms, SD = 40.2) (Figure 2). In addition, there was a main effect of Condition (Figure 2), F(1,85) = 4.841, p = .031, whereby old words (M = 368.8ms, SD = 40.4) elicited significantly faster FN400 latency than new words (M = 378.1ms, SD = 43.8).
Figure 2.
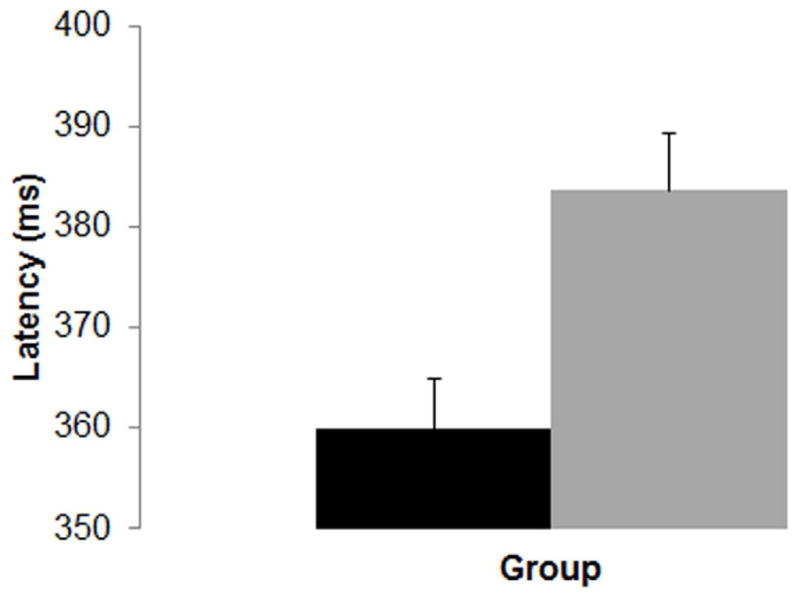
Mean latency to peak amplitude of the FN400 component, collapsed across condition. The x-axis represents ‘group’ and the y-axis represents latency in milliseconds (ms). Error bars represent +1 standard error of the mean.
■ Controls
 FIDA
FIDA
P300
Participants who did not meet the minimum requirement of 10 trials for each of the three midline electrodes (Fz, Cz, and Pz) were excluded from analysis of the P300 component. Therefore, controls n = 42 and FIDA n = 50. After controlling for maternal education and gestational age, there was a main effect of Group for P300 mean amplitude, which was qualified by a Group × Electrode interaction, F(2,87) = 4.878, p = .030. Post hoc comparisons revealed that controls showed larger P300 mean amplitudes than FIDA at electrodes Fz and Cz (Figure 3).
Figure 3.

Topographic distribution of scalp potentials collapsed across memory condition for A, controls and B, FIDA at 699 milliseconds poststimulus. C, Grand averaged ERP waveforms for the mean amplitude of the P300 component collapsed across condition. The x-axis represents latency in milliseconds (ms) and the y-axis represents amplitude in microvolts (μV).

 Controls
 FIDA
FIDA
Discussion
Both the FIDA and control groups performed the recognition memory task with equal accuracy throughout the study, which means that the children in the FIDA group were not behaviorally impaired in their ability to make a new/old distinction. This finding suggests that the memory processes necessary for the task were largely intact in both groups. However, despite comparable accuracy throughout the study, it is important to note that the control group’s response times (RTs) were significantly faster than the FIDA group’s response times during the first block of the experiment (lag 1 and lag 4 manipulation). By the second block of the experiment, there were no statistically significant differences between the groups. Based on previous work within this same population of children, we posit that the RT differences in the first block likely reflect a learning delay that is characteristic of the children in the FIDA group. The RT group differences, which may reflect differences in underlying processes on this relatively easy recognition memory task, could also have implications for the performance of the FIDA group on a more difficult or taxing memory-dependent task, a hypothesis that is not explored in the current study.
To help elucidate the observed difference in response times between the FIDA and control groups on a subset of the task, and to explore other potential neurological effects of early iron deficiency, we next examined group differences in our ERP results. The robust main effect of group for the mean amplitude of the P300 component (Figure 3) suggests that early iron deficiency, which is known to reduce energy metabolism, may have affected the development of neural circuitry in the FIDA group. Deviation from typical development may reduce P300 amplitude, indicating impairments in neuronal processing of both new and old ‘target’ words. Maximal P300 (or P3b) amplitudes are typically quantified primarily at parietal scalp locations because the signal becomes smaller and slower as it propagates towards central and frontal electrodes10. To examine this characteristic pattern of propagation across the scalp, our analyses looked at all three midline electrodes (Pz, Cz, and Fz). The interaction of Electrode and Group for the P300 component revealed topographical differences in the distribution of the P300 between the two groups whereby the signal was smaller for the FIDA group at the central and frontal midline electrodes. Despite this difference in magnitude, follow-up analyses did show the expected pattern of propagation across the scalp whereby (Pz > Cz > Fz) for both the FIDA and control groups.
Analysis of FN400 latency revealed a main effect of group whereby the controls had significantly shorter latency than the FIDA group. In a recognition memory task such as the one used, it is believed that both amplitude and latency of the FN400 may reflect memory searching26. Therefore, longer latency in the FIDA group may suggest a delay in crucial memory searching processes.
We also report a somewhat surprising interaction of Group and Condition for FN400 amplitude. In addition to general memory searching processes as mentioned above, there are several theories as to what the FN400 component represents. Some argue that the FN400 reflects a simple familiarity effect whereby new words have larger negative amplitude than old words27. One more recent theory is that the amplitude of the FN400 is related to activation of explicit semantic memory processes only for stimuli that carry meaningful associations28. In other words, it may be the case that the FN400 component shows a new/old effect for word stimuli that are conceptually familiar to the participant. Given the simple level of vocabulary of our word stimuli and the age of the participants, it is reasonable to argue that differences in semantic memory updating might be a potential explanation for these data. In the current study, the control group showed the expected new/old effect but the FIDA group did not. Thus, it appears as though iron deficiency might impact the development of crucial neural processes involved in accessing semantic memory for conceptually familiar words. Naturally, this interpretation would benefit from study replication.
Overall, our data suggests that early iron deficiency status is associated with slower and smaller neurological and behavioral responses in the FIDA group as compared with the controls. The fact that our electrophysiological findings were more robust than our behavioral findings speaks to the differential sensitivity of these two classes of measures. We argue that ERPs are a sensitive and therefore more accurate measure for detecting the early-onset differences that persisted throughout development.
Myelin dysfunction as a result of iron deficiency could be a mechanism for explaining the between-group differences in ERP latency and amplitude as well as differences in reaction times. The formation of myelin is an ongoing process that can take months or in some regions of the brain, years to complete29,30, suggesting that a perturbation to brain development in the formative years of development could have long-lasting effects. More specifically, any significant change in iron homeostasis during rapid periods of neuronal development can produce alterations in myelin composition and related behaviors that are long-lasting and difficult to reverse despite subsequent treatment. Thus, hypomyelination and its effects on neurotransmission could help to explain some of the ERP differences observed in the current recognition memory study.
An ongoing question in the current field of research is whether or not there is a specific window of time or sensitive period early in development during which brain development is disproportionately affected by iron deficiency or other nutrient deficiencies. In the current sample, the majority of children received iron supplementation at the age of 12-months (N = 36), and the groups who received supplementation at 6- and 18-months of age were much smaller (N = 8 for 6-month-olds and N = 7 for 18 month olds). Given these small sample sizes and the fact that the pre-natal iron status of participants was unknown, the current study cannot separate out the timing effects of iron deficiency or timing effects of the treatment, although work is currently underway in China that may help us address this very vital question.
Nutrient deficiencies during periods of rapid cognitive development can cause long-lasting changes in the brain. Despite the receipt of adequate treatment following their iron deficiency, the FIDA children continued to show differences in cognitive processing and neuronal timing as compared with controls. Importantly, all reported differences were significant after controlling for a comprehensive set of background factors.
Acknowledgments
Supported by a grant from the National Institutes of Health (R01 HD33487). The authors declare no conflicts of interest. The content is solely the responsibility of the authors and does not necessarily represent the official views of the National Institutes of Health.
Footnotes
Publisher's Disclaimer: This is a PDF file of an unedited manuscript that has been accepted for publication. As a service to our customers we are providing this early version of the manuscript. The manuscript will undergo copyediting, typesetting, and review of the resulting proof before it is published in its final citable form. Please note that during the production process errors may be discovered which could affect the content, and all legal disclaimers that apply to the journal pertain.
References
- 1.Todorich B, Pasquini JM, Garcia CI, Paez PM, Connor JR. Oligodendrocytes and myelination: The role of iron. GLIA. 2009;57:467–478. doi: 10.1002/glia.20784. [DOI] [PubMed] [Google Scholar]
- 2.Beard JL. Recent evidence from human and animal studies regarding iron status and infant development. J Nutr. 2007;137:524S–530S. doi: 10.1093/jn/137.2.524S. [DOI] [PubMed] [Google Scholar]
- 3.Lozoff B, Beard J, Connor J, Barbara F, Georgieff M, Schallert T. Long-lasting neural and behavioral effects of iron deficiency in infancy. Nutr Rev. 2006;64:S34–43. doi: 10.1301/nr.2006.may.S34-S43. discussion S72-91. [DOI] [PMC free article] [PubMed] [Google Scholar]
- 4.DeUngria M, Rao R, Wobken JD, Luciana M, Nelson C, Georgieff MK. Perinatal iron deficiency decreases cytochrome c oxidase (CytOx) activity in selected regions of neonatal rat brain. Pediatr Res. 2000;48:169–176. doi: 10.1203/00006450-200008000-00009. [DOI] [PubMed] [Google Scholar]
- 5.Carlson ES, Stead JDH, Neal CR, Petryk A, Georgieff MK. Perinatal iron deficiency results in altered developmental expression of genes mediating energy metabolism and neuronal morphogenesis in hippocampus. Hippocampus. 2007;17:679–691. doi: 10.1002/hipo.20307. [DOI] [PubMed] [Google Scholar]
- 6.Jorgenson LA, Wobken JD, Georgieff MK. Perinatal iron deficiency alters apical dendritic growth in hippocampal CA1 pyramidal neurons. Dev Neurosci. 2003;25:412–420. doi: 10.1159/000075667. [DOI] [PubMed] [Google Scholar]
- 7.Brunette KE, Tran PV, Wobken JD, Carlson ES, Georgieff MK. Gestational and neonatal iron deficiency alters apical dendrite structure of CA1 pyramidal neurons in adult rat hippocampus. Developmental Neuroscience. 2010;32:238–248. doi: 10.1159/000314341. [DOI] [PMC free article] [PubMed] [Google Scholar]
- 8.Algarin C, Peirano P, Garrido M, Pizarro F, Lozoff B. Iron deficiency anemia in infancy: long-lasting effects on auditory and visual system functioning. Pediatr Res. 2003;53:217–223. doi: 10.1203/01.PDR.0000047657.23156.55. [DOI] [PubMed] [Google Scholar]
- 9.Neufang M, Heinze HJ, Duzel E. Electromagnetic correlates of recognition memory processes. Clinical EEG and Neuroscience. 2006;37:300–308. doi: 10.1177/155005940603700407. [DOI] [PubMed] [Google Scholar]
- 10.Cycowicz YM. Memory development and event-related brain potentials in children. Biol Psychol. 2000;54:145–174. doi: 10.1016/s0301-0511(00)00055-7. [DOI] [PubMed] [Google Scholar]
- 11.Burden MJ, Westerlund AJ, Armony-Sivan R, Nelson CA, Jacobsen SW, Lozoff B, et al. An event-related potential study of attention and recognition memory in infants with iron-deficiency anemia. Pediatrics. 2007;120:e336–e335. doi: 10.1542/peds.2006-2525. [DOI] [PMC free article] [PubMed] [Google Scholar]
- 12.Dallman PR, Reeves JD, Driggers DA, Lo YET. Diagnosis of iron deficiency: the limitations of laboratory tests in predicting response to iron treatment in 1-year-old infants. J Pediatr. 1981;98:376–381. doi: 10.1016/s0022-3476(81)80321-6. [DOI] [PubMed] [Google Scholar]
- 13.Roncagliolo M, Garrido M, Walter T, Peirano P, Lozoff B. Evidence of altered central nervous system development in infants with iron deficiency anemia at 6 mo: delayed maturation of auditory brain stem responses. Am J Clin Nutr. 1998;68:683–690. doi: 10.1093/ajcn/68.3.683. [DOI] [PubMed] [Google Scholar]
- 14.Lozoff B, De Andraca I, Castillo M, Smith JB, Walter T, Pino P. Behavioral and developmental effects of preventing iron-deficiency anemia in healthy full-term infants. Pediatrics. 2003;112:846–854. [PubMed] [Google Scholar]
- 15.Gratton G, Coles MGH, Donchin E. A new method for off-line removal of ocular artifact. Electroencephalogr Clin Neurophysiol. 1983;55:468–454. doi: 10.1016/0013-4694(83)90135-9. [DOI] [PubMed] [Google Scholar]
- 16.Stanislaw H, Todorov N. Calculation of signal detection theory measures. Behav Res Meth Ins C. 1999;31:137–149. doi: 10.3758/bf03207704. [DOI] [PubMed] [Google Scholar]
- 17.Jacobson SW, Jacobson JL, Frye KF. Incidence and correlates of breast-feeding in socioeconomically disadvantaged women. Pediatrics. 1991;88:728–26. [PubMed] [Google Scholar]
- 18.Lozoff B, Jimenez E, Wolf AW. Long-term developmental outcome of infants with iron deficiency. New Engl J Med. 1991;325:687–94. doi: 10.1056/NEJM199109053251004. [DOI] [PubMed] [Google Scholar]
- 19.Bradley RH, Caldwell BM, Rock SL, Hamrick HM, Harris P. Home Observation for Measurement of the Environment: Development of a Home Inventory for use with families having children 6 to 10 years old. Contemporary Educational Psychology. 1988;13:58–71. [Google Scholar]
- 20.Wolf A, De Andraca I, Lozoff B. Maternal depression in three Latin American samples. Soc Psych Psych Epid. 2002;37:169–76. doi: 10.1007/s001270200011. [DOI] [PubMed] [Google Scholar]
- 21.Lanzi RG, Pascoe JM, Keltner B, Ramey SL. Correlates of maternal depressive symptoms in a national Head Start program sample. Arch Pediatr Adolesc Med. 1999;153:801–7. doi: 10.1001/archpedi.153.8.801. [DOI] [PubMed] [Google Scholar]
- 22.Bradley RH, Caldwell BM. Home observation for measurement of the environment: A validation study of screening efficiency. Am J Ment Def. 1977;81:417. [PubMed] [Google Scholar]
- 23.Alvarez ML, Muzzo S, Ivanovic D. Escala paramedición del nivel socioeconómico en el área de la salud (Scale for measuring socio-economic level in the area of health) Rev Med Chil. 1985;113:243–249. [PubMed] [Google Scholar]
- 24.Life Sciences Research Office. Assessment of the Iron Nutrition Status of the U.S. Population Based on Data Collected in the Second National Health and Nutrition Survey, 1976–1980. Bethesda: Federation of American Societies for Experimental Biology; 1984. [Google Scholar]
- 25.Looker AC, Dallman P, Carroll MD, Gunter EW, Johnson CL. Prevalence of iron deficiency in the United States. JAMA. 1997;277:973–976. doi: 10.1001/jama.1997.03540360041028. [DOI] [PubMed] [Google Scholar]
- 26.Friedman D. ERPs during continuous recognition memory for words. Biol Psychol. 1990;30:61–87. doi: 10.1016/0301-0511(90)90091-a. [DOI] [PubMed] [Google Scholar]
- 27.Dunn BR, Dunn DA, Languis M, Andrews D. The relation of ERP components to complex memory processing. Brain Cogn. 1998;36:355–376. doi: 10.1006/brcg.1998.0998. [DOI] [PubMed] [Google Scholar]
- 28.Voss JL, Lucas HD, Paller KA. Conceptual Priming and Familiarity: Different Expressions of Memory during Recognition Testing with Distinct Neurophysiological Correlates. J Cognitive Neurosci. 2009;22:2638–2651. doi: 10.1162/jocn.2009.21341. [DOI] [PubMed] [Google Scholar]
- 29.Paus T, Collins DL, Evans AC, Leonard G, Pike B, Zijdenbos A. Maturation of white matter in the human brain: review of magnetic resonance studies. Brain Res Bull. 2001;54:255–266. doi: 10.1016/s0361-9230(00)00434-2. [DOI] [PubMed] [Google Scholar]
- 30.Ortiz E, Pasquini JM, Thompson K, Felt B, Butkus G, Beard J, et al. Effect of manipulation of iron storage, transport, or availability on myelin composition and brain iron content in three different animal models. J Neurosci Res. 2004;77:681–689. doi: 10.1002/jnr.20207. [DOI] [PubMed] [Google Scholar]