Abstract
Image-guided adaptive radiotherapy requires deformable image registration to map radiation dose back and forth between images. The purpose of this study is to develop a novel method to improve the accuracy of an intensity-based image registration algorithm in low-contrast regions. A computational framework has been developed in this study to improve the quality of the “demons” registration. For each voxel in the registration’s target image, the standard deviation of image intensity in a neighborhood of this voxel was calculated. A mask for high-contrast regions was generated based on their standard deviations. In the masked regions, a tetrahedral mesh was refined recursively so that a sufficient number of tetrahedral nodes in these regions can be selected as driving nodes. An elastic system driven by the displacements of the selected nodes was formulated using a finite element method (FEM) and implemented on the refined mesh. The displacements of these driving nodes were generated with the “demons” algorithm. The solution of the system was derived using a conjugated gradient method, and interpolated to generate a displacement vector field for the registered images. The FEM correction method was compared with the “demons” algorithm on the CT images of lung and prostate patients. The performance of the FEM correction relating to the “demons” registration was analyzed based on the physical property of their deformation maps, and quantitatively evaluated through a benchmark model developed specifically for this study. Compared to the benchmark model, the “demons” registration has the maximum error of 1.2 cm, which can be corrected by the FEM method to 0.4 cm, and the average error of the “demons” registration is reduced from 0.17 cm to 0.11 cm. For the CT images of lung and prostate patients, the deformation maps generated by the “demons” algorithm were found unrealistic at several places. In these places, the displacement differences between the “demons” registrations and their FEM corrections were found in the range of 0.4 cm and 1.1cm. The mesh refinement and FEM simulation were implemented in a single thread application which requires about 45 minutes of computation time on a 2.6 GH computer. This study has demonstrated that the finite element method can be integrated with intensity-based image registration algorithms to improve their registration accuracy, especially in low-contrast regions.
Keywords: deformable image registration, finite element method, adaptive radiation therapy
1. Introduction
Anatomical information contained in computed tomography (CT), four-dimensional CT (4DCT) or cone-beam CT (CBCT) images can be integrated and used in a variety of clinical applications [1–3]. For example, in image-guided radiation therapy, images acquired in different imaging modalities can be matched with each other for target delineation; in fractionated radiation therapy, as a patient’s anatomy changes in the course of radiation treatment, radiation dose delivered to each voxel in the patient’s planning CT image could vary from fraction to fraction. To accumulate the total dose delivered to each voxel, images need to be acquired at each treatment fraction and aligned on a voxel-by-voxel basis so that the radiation dose required for the remaining treatment fractions can be re-calculated [4;5]. The voxel-based image alignment can be achieved through deformable image registration (DIR) techniques.
Intensity-based DIR algorithms [6–9] appear commonly in literature partly due to the merit of their fully automatic nature. A typical example is the “demons” registration algorithm, where the registration is driven by the following force equation:
| (1) |
where m and s represent the intensity of two input images, and α is constant [10]. The “demons” force ν is often referred to as a displacement vector that can be updated through an optical flow-based algorithm [11]. The impact of image intensity gradients on the performance of the “demons” registration is obvious. As the gradient of s continuously decreases, ν may tend to zero. Consequently, the registration in low-contrast regions cannot be updated or improved by the “demons” force. In general, for intensity-based DIR algorithms, their intensity metrics are not sensitive to displacement changes in low-contrast regions, and their registration in these regions is achieved by regularization forces for non-parametric algorithms and by interpolations for parametric ones[12;13]. However, there is no any known solution that can ensure accurate registrations in these regions, nor it is possible to detect their potential errors visually.
Finite element modeling [14–16] is a technique that can be used to calculate organ deformation without utilizing image intensity information. The deformation vectors can be calculated purely based on elasticity theory [17]. Different elasticity models have been developed and verified with physical tests, and implemented using finite element methods (FEM). Several groups have utilized FEM techniques to register different organs such as lung [18;19], prostate [16;20], brain[15] and breast[21]. A major challenge to the FEM based registrations is that anatomic structures have complex geometries which make it difficult to configure their boundary conditions in clinical scenarios. To address this issue, Zhang et al [22] took a contact-impact model to simulate the interaction between the organ of interest and its surrounding structures, and generated displacement vectors for lung patients. Al-Mayah et al [23] used a frictionless surface model, and restricted the lung’s deformation by the internal surface of the chest cavity at different respiratory phases. Furthermore, Al-Mayah et al [24] investigated the impact of hyper-elasticity models on registration accuracy. These studies confirmed that FEM is a reliable tool for deformable image registration. It should be noted that some organs are difficult for segmentation and meshing, and measuring their exact boundary conditions is still a challenge [16]. In addition, material properties of high-contrast regions such as lung could also be a concern to computational modeling, especially when the model is configured only at distant boundaries.
In contrast, tissue heterogeneities can help improve intensity-based DIR algorithms. These algorithms can achieve high accuracy in regions with large intensity gradients, but may suffer uncertainties in low-contrast regions [25;26]. The low-contrast regions more likely consist of homogeneous materials which may be fitted well by elasticity-based finite element methods. Because of this reason, we propose and develop a finite element method to correct the errors of intensity-based deformable image registrations in low-contrast regions, and improve the regularity of their deformation maps. Briefly, we will use the “demons” algorithm to “align” image features, and take its resultant displacements in high-contrast regions as boundary constraints to guide the finite element model to simulate the deformation of soft tissues. Since the intensity-based “demons” algorithm and the elasticity-based finite element modeling techniques were developed on the structures of image grids and geometric meshes, respectively, it is necessary to integrate the computational structures used in the two techniques. In this paper, we will describe the development of an integration method for improvement of intensity-based deformable image registrations, and apply the developed method to both high-contrast lung 4DCT images and low-contrast prostate CBCT images.
2. Materials and Methods
The image intensity-based “demons” algorithm and the finite element method have been developed on image grids and structured meshes, respectively. To take the advantages of the two techniques, a point-to-point correspondence between the image grids and the structured meshes must be established and the FEM formulation process must be adjusted. In the following sections, we will describe the details of the proposed method that include segmentation of high-contrast image regions, region-based mesh refinement, formulation and solution of elastic equations with displacements pre-assigned to a large number of internal nodes. We will also develop a benchmark model to evaluate the improvement of the FEM technique over the intensity-based “demons” registration.
2.1. Segmentation of high-contrast regions
Since intensity-based image registrations may get better performance in high-contrast regions, the first step of the proposed method is to identify these contrast regions. The standard deviation σ of image intensity in a target image can be taken as a criterion. The σ(i) at voxel i can be calculated by
| (2) |
where Ĩ(i) is the mean intensity of voxel i over its neighborhood Ri which consists of 6×6×2 voxels. The mean standard deviation σ̃ is the average of the standard deviation σ(i) over the target image domain. The threshold Tc for segmentation of the high-contrast regions was assumed to be 2.0 and 1.3 times of the mean standard deviation σ̃ for lung and prostate images, respectively. The segmented regions were taken as a mask to select the driving nodes of a tetrahedral mesh. The tetrahedral mesh was generated as described below.
A unitary cube was partitioned by ICEM (Ansys Inc., Canonsburg, PA) to generate a prototype tetrahedral mesh that consists of 131614 nodes and 747384 tetrahedrons [27]. Approved by the Institutional Review Board of Henry Ford Health System, this study used 4DCT images acquired from lung cancer patients, and CBCT images from prostate cancer patients. The resolution of the CT images is 0.97 mm × 0.97 mm × 3 mm. For each registration performed on these images, the prototype mesh was scaled to cover the domain of the registration’s target image, and its resultant tetrahedrons had a volume of 100mm3 on average. The resultant mesh is coarse and needs to be refined so that more tetrahedral nodes can be identified in the segmented regions.
2.2. Region-based refinement of tetrahedral meshes
Due to the limitation of computer memory and computational efficiency [15], the scaled tetrahedral mesh cannot be partitioned as fine as that of image grids, but this mesh can be refined in the segmented regions at low computational costs.
For each image voxel in the segmented regions, the tetrahedron of the mesh that contains the center of this voxel is selected as a candidate for refinement, and the volume of the tetrahedron is then calculated. If the volume is greater than a threshold Tv, this tetrahedron is determined as a target for partition. For a consistent tetrahedral mesh, each of its non-boundary triangular faces is shared exactly by two tetrahedrons. As a partition operation adds additional nodes to a face of the target tetrahedron, the neighbor tetrahedron that shares this face with the target is no longer a tetrahedron, and must be divided into sub-tetrahedrons. The same is true for those that share an edge with the target.
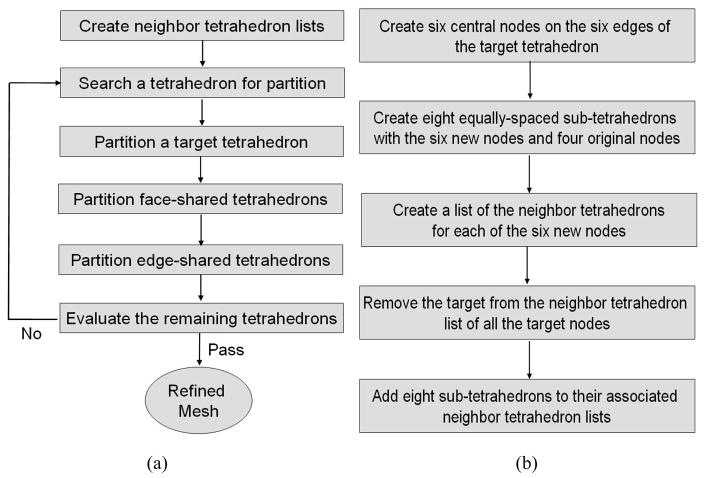
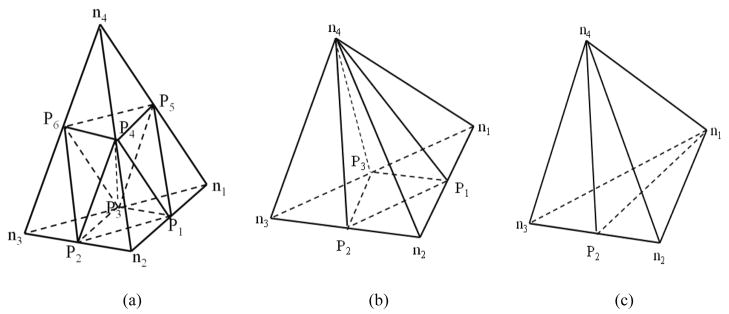
The procedure to refine a tetrahedral mesh is illustrated in Fig 1a. In general, a list of neighbor tetrahedral elements was created for each node in the original tetrahedral mesh. For each image voxel in the segmented region, the tetrahedron that contains the center of this voxel was identified, and the volume of this tetrahedron was calculated. This tetrahedron would be selected as a target for partition if its volume was greater than the threshold Tv. The procedure to partition a target tetrahedron is described in Fig 1b, and the sub-tetrahedrons generated in the target are illustrated in Fig 2a.
Figure 1.
A flowchart of (a) refining a tetrahedral mesh and (b) partitioning a target tetrahedron.
Figure 2.
Refinement of (a) a target tetrahedron, (b) a tetrahedron sharing a face with the target, and (c) a tetrahedron sharing an edge with the target. ni (i=1,…,4) represents an original vertex of the mesh, and Pi (i=1,…,6) represents a new node inserted for tetrahedron partition.
After the target partition, tetrahedrons that share a face with the target need to be partitioned. These tetrahedrons were shared by three of the four neighbor tetrahedron lists built for the target. We divided each of these shared tetrahedrons into four sub-tetrahedrons as shown in Fig 2b, and created and updated neighbor tetrahedron lists for all the associated nodes. Similarly, tetrahedrons that share an edge with the target appeared only in two of the four neighbor tetrahedron lists built for the target. Each of these edge-shared tetrahedrons was divided into two sub-tetrahedrons as shown in Fig 2c. The neighbor tetrahedron lists were then created and updated for all the associated nodes. The partition process was continued until the threshold Tv was reached.
The new tetrahedral elements were formed as shown in Fig 2. To make the final elastic equations solvable, the Jacobian of each element must be a positive-definite matrix. That means the orientations of these new tetrahedrons are consistent with each other. The orientation of a tetrahedral element can be indicated by the determinant of the Jacobian matrix of its four nodes (xi, yi, zi), i=1, …, 4, defined by
| (3) |
If the Jacobian’s determinant is negative, the tetrahedral element needs to switch the order of its last two nodes. With this procedure, the tetrahedral mesh can be refined the in the segmented regions.
2.3. Formulation of an image intensity-guided elastic system
In elasticity theory, deformation of anatomic structures can be described by a system of partial differential equations [17]. These equations can be converted into a weak form and represented by a finite set of basis functions [14]. The basis functions and the elasticity model used in this study were assumed to be linear. The boundary nodes were formed from two parts: the driving nodes selected from the segmented regions, and the nodes located at the boundary of the image domain. The displacements of these driving nodes were computed by intensity-based image registrations. The elastic forces were calculated locally with the displacements of these nodes and treated as external forces. Through a procedure similar to [27], the final algebraic equations can be represented as follows:
| (4) |
where K is the assembled global stiffness matrix [27], F1,…Fk represent the external forces acting on the nodes located at the image boundary, and d1,…,dk are their corresponding displacements. dk+1,…,dn are the displacements of those nodes that are neither on the cubic surface nor in the set of the driving nodes. The material parameters were assigned the same values as in [25], i.e., Young’s moduli were set to 1 MPa for ribs, 1 kPa for lung, and 10 kPa for other soft tissue. The Poisson ratio was 0.38 for lung and 0.49 for other elements. The summation components on the right hand side of Eq. (4) represent external forces calculated from the displacements of these driving nodes. These displacements were derived from a “demons” registration.
In Eq. (4), the driving nodes selected from the segmented regions were treated as boundary nodes, and their correspondent entries in the global stiffness matrix K were removed. To save computer memory, the zero entries of this matrix were suppressed and the remaining non-zero entries were saved into a look-up table that was used during the formulation of these equations. The established equations were solved indirectly using a conjugated gradient method [27].
2.4. Integration of “demons” registration with finite element modeling
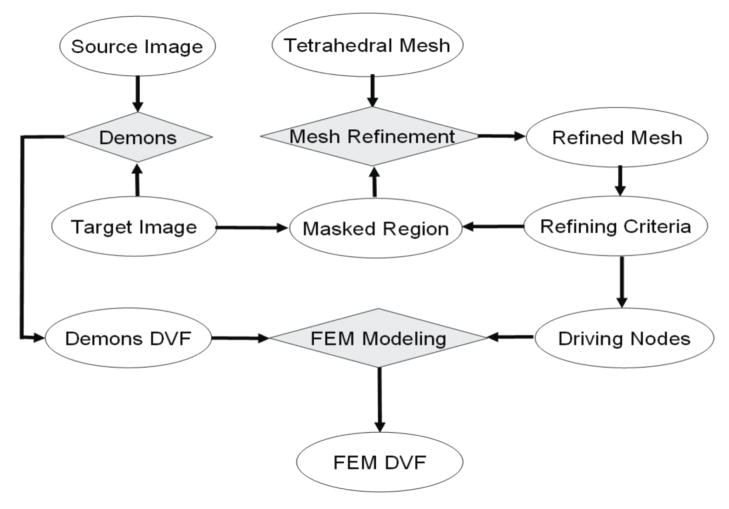
The workflow to integrate an image intensity-based “demons” registration with a finite element modeling procedure is illustrated in Figure 3. The “demons” algorithm was modified from the ITK software package[28] and configured with a four-level resolution. The number of iterations in the four levels was set to 100, 100, 100, and 300, respectively, and the standard deviation of its Gaussian function was set to one. This algorithm was performed to generate displacement vector fields in the domain of its target image. High-gradient regions in the target image were then segmented based on the standard deviations of their intensities, as described in section 2.1.
Figure 3.
the flowchart of the FEM method for correcting deformable image registration errors.
Two look-up tables were established from the voxels of the target image to their corresponding tetrahedral elements and nodes, respectively. The center of each image voxel in the segmented regions was used to divide its corresponding element into four sub-tetrahedrons, each having a positive-definite Jacobian matrix. The volume of the corresponding element was calculated simply from the determinants of the Jacobian matrices of the four sub-tetrahedrons. If the volume calculated is greater than the given threshold Tv, this tetrahedron and its neighbor elements will be divided recursively until the volumes of the resultant tetrahedrons are less than the threshold.
The mesh refinement allows more driving nodes to be selected from high-gradient regions, especially in the skin area. These selected nodes may separate the tetrahedral mesh into disconnected parts, e.g. the inside and outside of the skin. Consequently, external forces added at image boundaries have no direct impact on other parts. For the sake of simplicity, the image boundaries were assumed to be force-free. The displacements of the selected nodes were assigned from the “demons” DVF. Note that if the assigned displacements cause their underlying tetrahedron flipped over, i.e. the sign of the tetrahedron’s Jacobian determinant is changed after deformation, these nodes will be removed from the list of the driving nodes. The displacements of the other nodes in the mesh can be solved from Eq. (4) and interpolated to get the displacement vector field of the target image using a volume-based interpolation method [25]. This algorithm has been implemented with C++ on a Linux workstation.
2.5. Development of a benchmark platform
The goal of the FEM correction method is to reduce the “demons” registration errors in low-contrast regions. Due to the lack of landmarks or features in these regions, conventional feature-based validation methods cannot help assess the performance of these algorithms quantitatively. To evaluate the FEM’s improvement, a benchmark model was developed based on a lung patient’s CT images.
The “demons” registration was performed on the lung patient’s CT images from the end of exhalation (EE) to the end of inhalation (EI). Note that due to lack of physical constraints, the “demons” generated DVF map could be unrealistic, and therefore is not appropriate to serve as a gold standard to validate other registration algorithms directly. To address this issue, a geometric mesh was created on the EI image. The nodes in the high-gradient regions of the EI image were selected as the driving nodes. The “demons” displacements at these nodes were used as boundary constraints to configure a FEM computational model developed on this mesh. A displacement vector field (M-DVF) was then generated from this model, and used to warp the source image (EE) to get a simulation image (SI). The EE and SI images combined with the M-DVF form a benchmark platform. As a typical use of an FEM generated DVF, the M-DVF serves as a gold standard to evaluate registrations performed from the EE image to the SI image.
The benchmark model developed has its diaphragm deformed of amplitude 2.5 cm. A “demons” registration and its FEM correction were then performed on this platform from EE to SI. Consequently, their displacements can be compared with the M-DVF voxel-wisely in the entire image domain that contains both high and low contrast regions.
3. Results
3.1. Mesh refinement in high-contrast regions
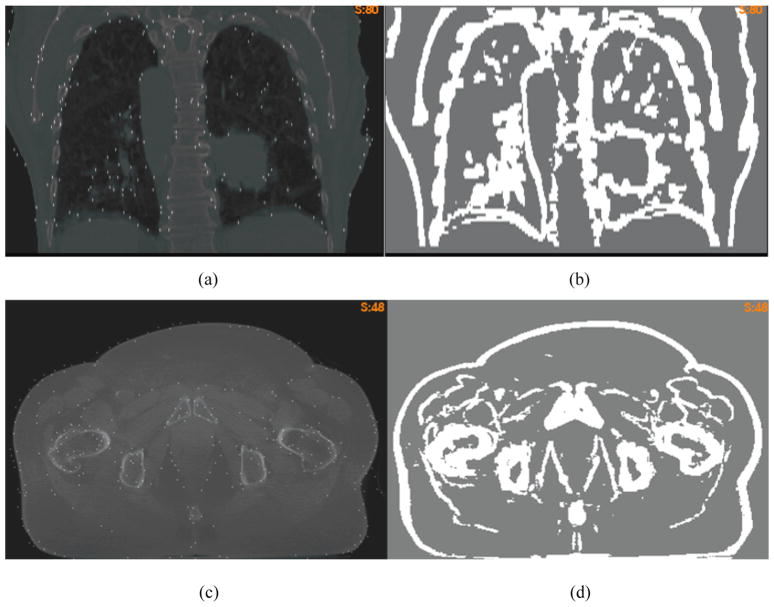
The “demons” registrations and their FEM corrections were tested on lung and prostate CT images, respectively. The standard deviation σ(i) defined by Eq. (2) was calculated at each voxel and averaged over the domain of their target image. To segment high-contrast regions, the threshold Tc was set to 2 for the lung image (Fig 4a) and 1.3 for the prostate image (Fig 4c), respectively. With these thresholds, the segmented regions (Fig 4b and 4d), in general, are coincident with anatomic boundaries where the multi-resolution “demons” algorithm is likely to generate accurate registrations [25].
Figure 4.
(a) the overlay of the lung CT image and the selected nodes; (b) the masked high-contrast regions; (c) and (d) are the corresponding figures of the prostate image.
With the method described in section 2.2, the mesh was refined in the segmented regions, and the volumetric threshold Tv was set to 50. After the refinement, the volume of each target tetrahedron in the segmented regions is at most 50 times of a voxel’s volume. Consequently, the distance between the center of each masked voxel and its corresponding driving node is less than 5 mm on average. The refined mesh consists of 750582 tetrahedrons for the prostate image, and 839155 tetrahedrons for the lung image. The mesh refining process may take about 10 minutes, and can help generate more driving nodes in high-contrast regions. The overlays of these nodes and the target images are shown in Fig 4a and 4c.
3.2. Qualitative analysis of the “demons” errors and their FEM corrections
In this section, the “demons” registrations and their FEM corrections were performed on the CT images of lung and prostate patients. After these registrations and corrections, the source images were embedded with constant-intensity planes, and then warped to the target image using a registration derived DVF. The warped constant-intensity planes may help illustrate the DVF’s behavior.
3.2.1. Correction of erroneous amplitudes
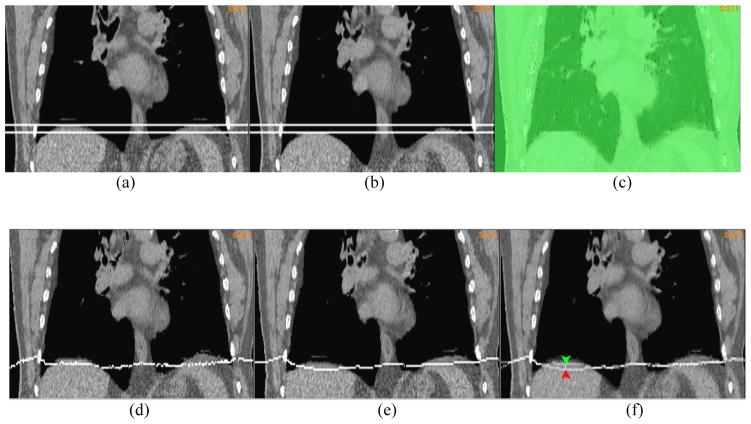
A “demons” registration was performed on the 4DCT image of a lung patient from EE to EI. After the registration, two horizontal planes assigned with a constant intensity were embedded into the 4DCT images at the positions corresponding to the top of the diaphragm in the EE and EI phases, respectively. As illustrated by the two planes in Fig 5a and 5b, the diaphragm’s motion amplitude is 1.2 cm. Since soft tissue is nearly incompressible, the lower level plane in Fig 5a should be pushed down around 1.2cm at the end of inhalation. But, as shown in the image warped by the “demons” DVF (Fig 5d), this plane was moved down only 0.4 cm. The “demons” DVF was then corrected by the FEM with the driving nodes shown in Fig 5c. The image warped by the FEM corrected DVF showed a deformation of 1.2 cm at the center of the diaphragm (Fig 5e). The overlay of the two warped images was shown in Fig 5f.
Figure 5.
The coronal cut of the lung CT image embedded with two planes at (a) the end of exhalation (EE) and (b) the end of inhalation (EI); (c) the overlay of the EI image with the driving nodes; The EE image embedded with the lower-level plane in (a) was warped by (d) the “demons” DVF and (e) the FEM corrected DVF; (f) the overlay of (d) and (e) to illustrate the positional difference between their warped planes;
Fig 6a shows the target image of a “demons” registration for a prostate patient, and Fig 6b is its source image warped by the “demons” DVF. Anatomic features in the two images should be matched to each other if the “demons” registration is accurate. But Figs 6a and 6b show that the features in the two images are not consistent, and the embedded plane warped by the “demons” DVF shows a large, unrealistic deformation. The unrealistically deformed plane was then corrected by the FEM method (Fig 6c). Fig 6d shows that the difference between the “demons” DVF and the FEM corrected DVF is 1.1cm.
Figure 6.
(a) The axial cut of the target CT image for a “demons” registration; (b) and (c) are the plane-embedded source image warped by the “demons” DVF and the FEM corrected DVF, respectively, and (d) illustrated the positional difference between the warped plane in (b) and (c).
3.2.2. Correction of erroneous curvatures
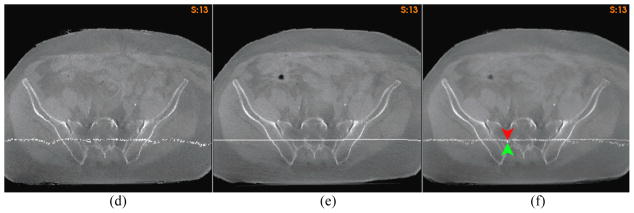
The flatness of a deformation map can be described by its curvature. While the correct curvature at a given physical point usually is unknown, a deformation map that has sharp angles in bone or soft tissues is unrealistic. Such angles can be found in the “demons” deformation maps for registration of homogeneous regions such as liver, soft tissues, and pelvic bones. For example, compared with the FEM corrected DVF, the “demons” has a 6 mm sharp deformation inside the liver (Fig 7c), and more than 4 mm sharp distortions observed inside the pelvic bones and soft tissues (Fig 7f).
Figure 7.
The axial cut of the lung CT image at the liver warped by (a) the “demons” DVF, and (b) the FEM corrected DVF; (c) the overlay of (a) and (b) to illustrate the positional difference between their warped planes; The coronal cut of the prostate CT image warped by (d) the “demons” DVF, and (e) the FEM corrected DVF; (f) the overlay of (d) and (e) to illustrate the positional difference between their warped planes.
3.2.3. Correction of deformation irregularity
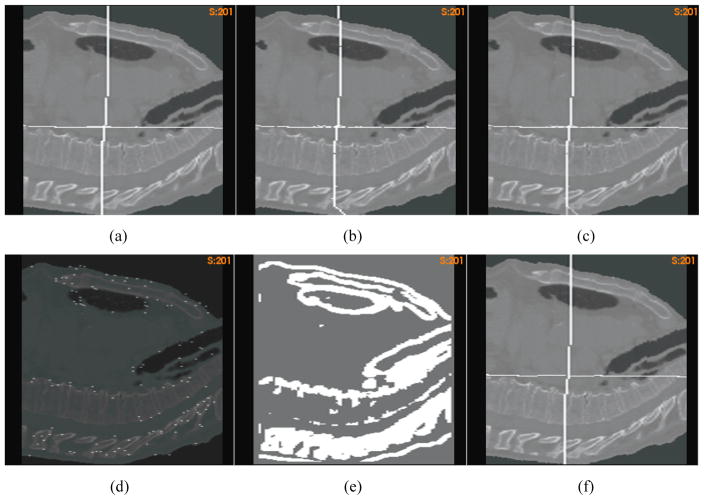
Due to image noises and artifacts, the “demons” algorithm may result in unrealistic deformation maps, and these maps cannot preserve a good continuity or conformality in homogeneous tissues where its “demons” force is weak. As shown in Fig 8, straight planes embedded in a source image could be deformed into a set of discontinuous points spread over a large area. Such irregularities can be observed in the “demons” registrations for both lung and prostate CT images. Fig 8a shows that the plane-embedded lung CT image was warped by the “demons” DVF. The warped plane contains a group of discontinuous points in the heart. These points differ from the FEM corrected results by 7 mm (Fig 8c). Furthermore, it is evident that the CT reconstruction line artifacts disappeared in Fig. 8a due to the displacement uncertainty of the “demons” algorithm, while preserved in Fig. 8b.
Figure 8.
A plane-embedded 4DCT image warped by (a) the “demons” DVF, and (b) the FEM corrected DVF; (c) the overlay of (a) and (b) to illustrate the positional difference between their warped planes; A prostate image embedded with two orthogonal planes warped by (d) the “demons” DVF, and (e) the FEM corrected DVF; (f) the unbalanced energy of the “demons” DVF for the prostate image.
The deformation irregularity of the “demons” registration for the prostate images can be observed through the orthogonal planes embedded in its source image. In the deformed source image (Fig 8d), the warped horizontal plane contained a large number of disconnected points and the perpendicular plane resulted in a forked curve as indicated by the dotted circles in Fig 8d. After the FEM correction, the cut of each deformed plane was restored to a simple curve (Fig 8e), and the topology of the straight planes was preserved.
The irregular deformation of the “demons” algorithm is expected to cause high unbalanced energy (UE) in a FEM computational model [29]. Fig 8f shows the UE map of the “demons” registration for the prostate case. It can be observed that the places of high UE values in Fig 8f correspond to the regions with irregular deformations in Fig 8d. This observation may suggest that when we select the driving nodes for the FEM correction, the tetrahedral nodes that have high UE values should be avoided.
3.3. Quantitative evaluation of the FEM correction method
In the previous sections, the “demons” deformation maps and their FEM corrections have been qualitatively analyzed. However, it is more valuable to have a comprehensive, quantitative evaluation of these deformation maps, especially in low-contrast regions. As discussed in section 2.5, we created a benchmark platform with a computational model whose displacements were taken as a standard DVF. A lung patient’s CT image was taken as a source image which was warped by the standard DVF to create a simulated image. The “demons” registration was performed from the source image to the simulated image. After the registration, the source image was embedded with two orthogonal planes, and then warped by the standard DVF and the “demons” DVF, respectively, with their results shown in Fig 9a and 9b. The overlay of the two warped images (Fig 9c) manifests that the deformation of soft tissue in the posterior region has a significant difference as illustrated by their embedded axial planes.
Figure 9.
The plane-embedded source image warped by (a) the standard DVF and (b) the “demons” DVF, respectively; (c) the overlay of (a) and (b) to illustrate the positional difference between their warped planes; (d) the simulated image overlaid with the driving nodes; (e) the segmented high-contrast region; (f) the plane-embedded source image warped by the FEM corrected displacements.
To correct the “demons” error, an FEM correction was performed with the driving nodes identified from the high-contrast regions (Fig 9e) that were segmented from the simulated image with Tc=2.0. The overlay of the simulated image and the selected driving nodes is shown in Fig 9d. The source image warped by the FEM corrected DVF is shown in Fig 9f, where the abnormal deformation of the “demons” registration in the posterior region has been successfully corrected by the FEM correction algorithm.
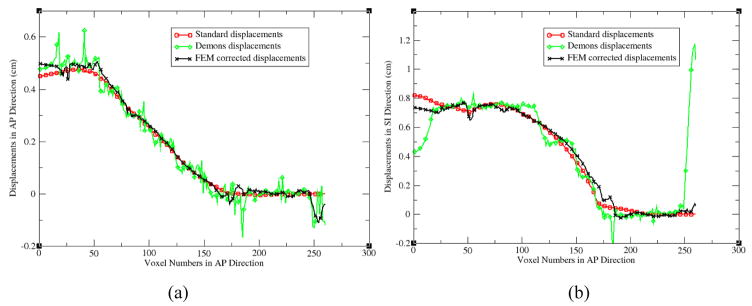
With the standard benchmark model, the “demons” registration and its FEM correction can be quantitatively evaluated at each image voxel. For the AP line across the center of the cardiac region (Fig 9a), the profiles of the standard, “demons” and FEM corrected displacements along this line are shown in Fig 10a and 10b for their displacement components in the AP and SI directions, respectively. From these profiles, it can be found that the FEM corrected displacements are much smoother than the original “demons” displacements (Fig 10a), and the FEM method has corrected the largest displacement error of the “demons” registrations in the posterior region (Fig 9c and Fig 10b). After the FEM correction, the largest error of the “demons” registration relative to the standard displacements has been reduced from 1.2 cm to 0.4 cm.
Figure 10.
The profiles of the standard, “demons”, and FEM corrected displacements along the AP line shown in Fig 9: (a) the AP components and (b) the SI components.
In addition to the largest displacement errors corrected in the posterior region, the “demons” registration also yielded uncertainties in the low-contrast, central cardiac region as marked in Fig 11a. With the FEM regulation, the “demons” uncertainties in the low contrast regions have been corrected (Fig 11b), and the average error of the “demons” registration has been reduced from 0.17cm to 0.11cm.
Figure 11.
Displacement errors from (a) the demons registration, and (b) the FEM correction. (c) Low-contrast regions in red vs. high-contrast regions in blue;
4. Discussion
For intensity-based image registrations, their underlying deformable models are driven by the intensity metric of two images being registered, and these models can be used to generate displacement vectors in the entire image domain [6;30;31]. The impact of the intensity metric on the derived displacements depends on the intensity gradients in the regions of interest. For example, a small change in the intensity metric may cause a large displacement variation in low-contrast regions, so intensity-based DIRs often have large errors in low-gradient [9;25] or high-noise regions [8]. A large number of iterations in optimization may help capture the small intensity change, but this is time consuming and its overall improvement may still be limited by image noises [8].
4.1. Innovation of the FEM correction method
It has been reported that landmarks or high-contrast features in two CT images can be registered quickly with the “demons” algorithm which can converge within 60s [8]. It is, therefore, reasonable to suggest that the displacements of the “demons” registration in these contrasted regions are taken as an input to a purely mechanical model, and the displacements of voxels in low-contrast regions are consequently computed from this model using the finite element method.
To the authors’ knowledge, this is the first study that has an intensity-based registration algorithm followed by a mechanics-based finite element method in a serial order to improve the accuracy of deformable image registration. It was reported that the mean sum of squared differences of image intensities was taken as the external forces that act on the elastic elements to generate a deformation field [28;32], but the virtual forces introduced by the image metric could compromise the integrity of the underlying elasticity model. While it was shown that the compromised quality of the elasticity model can be adjusted by a “demons” registration [33], the final “demons” registration still could have large uncertainties in low-contrast regions. On the other hand, pure mechanics-based FEM registrations were based on segmentation and meshing of individual organs [15;16;18], and their boundary constraints were obtained through surface-contact models [22;23]. With these models, inaccuracies in organ segmentation and mesh generation could be propagated directly into the displacement errors of these FEM registrations. Also the segmentation and meshing of individual organs required in these organ-based registrations could be a challenge in many clinical cases.
In contrast, we created a prototype mesh which can be scaled to cover different image domains. The displacements of the “demons” registrations in high-contrast regions were taken as boundary constraints. The resultant FEM models have the same accuracy as the “demons” registrations in high-contrast regions, but get the “demons” performance improved in low-contrast regions. For computational efficiency, the tetrahedral meshes of these FEM models, in general, are coarser than their underlying image grids. An image voxel in high gradient regions is not necessarily close to a tetrahedral node. If the node that is closest to this voxel is located in low-contrast regions, this node probably is not appropriate to serve as a driving node. To address this issue, we presented a method to refine the mesh based on its underlying image gradients. The region-based mesh refinement allows image intensity information to be used efficiently for FEM modeling.
4.2. Implementation of the FEM correction method
The proposed FEM correction method contains several components such as creating look-up tables between image grids and meshes, mesh refinement, and formulation and numerical solution of system equations. Among these operations, the conjugated-gradient method used to solve the system equations takes most of the computation time. For a mesh consisting of 130K nodes, the FEM optimization may converge within 200 iterations, and its computation time is less than 10 minutes on a 2.6 GH computer. After the mesh refinement, the number of its nodes increased to 160K with the refined tetrahedrons much smaller than other elements. Large volume variations may compromise the regularity of the mesh, and consequently, decrease optimization efficiency. On the refined mesh, the optimizer requires nearly 1000 iterations to converge and its computation time increases to 35 minutes.
For tetrahedron-based FEM modeling, a high-resolution mesh can help improve the modeling’s accuracy. However, if a mesh has a resolution similar to that of the underlying image grid, it could be a challenge with regard to computer memory and computational efficiency. Therefore, we chose to refine the FEM mesh in selected regions as a practical solution. We used the two parameters Tc and Tv to control the mesh’s resolution in high-contrast regions. The refined mesh can help improve the accuracy of the FEM boundary constraints which is crucial for the FEM model to derive correct displacement vectors in other regions. With the refined mesh, the FEM correction requires nearly 5 GB of computer memory.
4.3. Evaluation of the FEM correction method
The presented FEM method is supposed to correct the “demons” registration errors and irregularities in low-contrast regions. To evaluate the efficiency of the FEM corrections, qualitative analysis of the “demons” deformation maps was performed using marked planes embedded in the registration’s source images. Through the planes warped by the pre-derived “demons” DVF, the unrealistic deformation amplitudes, curvatures and mapping irregularities in low-contrast regions were illustrated. It has been shown that these abnormalities can be successfully adjusted by the FEM correction method.
In addition to the case-by-case analysis, we further developed a benchmark platform based on a computational model and a lung CT image. The “demons” algorithm and the FEM correction method were tested on this platform. Their displacements were compared to the benchmark model at each voxel. It has been found that the FEM correction can reduce the mean error of the “demons” registration from 0.17 cm to 0.11 cm and its maximum error from 1.2 cm to 0.4 cm. These results have manifested that the FEM correction method can help improve the accuracy of the “demons” registrations.
Note that contact-surface based FEM modeling has its constraints configured at the lung’s distant boundaries only [23], and the displacements of the internal structures are determined largely by its material model. It has been reported that hyper-elasticity models outperformed the linear material model significantly in the contact-surface based FEM modeling [23]. However, the FEM correction method presented in this study has its constraints defined not only at the lung’s boundaries, but also in the lung’s internal structures (Fig 4a). The increased number of the constrained nodes makes the FEM correction method less dependent on its material model and parameters. In addition, hyper-elasticity models will result in a non-linear algebraic system that could be ten times slower than a linear system [27], so the overall gains of incorporating a non-linear model into the FEM correction method could be limited. Nevertheless, advanced models can help improve the FEM accuracy, especially in regions that are lack of constraints, and therefore should be investigated further in future studies.
As the “demons” algorithm is more accurate in high-contrast regions than in any other places, more driving nodes selected from these contrast regions may help improve the FEM correction method. However, errors may still exist in these regions for the “demons” registration, and these errors may subsequently compromise the accuracy of the FEM correction in other regions, so the displacements of these driving nodes should be pre-evaluated before used for the FEM correction.
4.4. Application of the FEM correction method
In adaptive treatment planning, the total radiation dose delivered can be calculated from energy deposited in previous fractions using a Monte Carlo method [34]. This method counts deposited energy at each particle’s incident location. Consequently, sub-voxel displacement errors could directly impact the reconstructed dose. The method proposed in this study takes the “demons” displacements in high-gradient regions as an input to the FEM model to correct the “demons” irregularities in low-contrast regions. This may help improve the accuracy of dose reconstruction in adaptive treatment planning. Sub-voxel registration uncertainties could also have a major impact on 4DCT-based ventilation images reconstructed with deformable image registration methods [35]. The FEM correction method can reduce the registration uncertainties, and consequently improve the quality of the reconstructed ventilation images.
Image grids coupled with tetrahedral meshes allow the material information of anatomic structures contained in images to be used efficiently for mechanical modeling and analysis. The element-wise analysis helps identify errors in the “demons’ derived deformation maps and consequently correct these errors. Different from conventional FEM registration approaches, the proposed FEM simulation is performed in the image domain with no need of organ-specific segmentation and meshing. It is, therefore, appropriate to be used for Monte Carlo based adaptive treatment planning as well as many other clinical applications.
5. Conclusion
In this study, we have proposed a finite element method that utilizes the displacements of an intensity-based image registration in high-contrast regions to drive a mechanical model to generate a displacement vector field over the entire image domain. The feasibility of this method has been tested on lung and prostate patients. The preliminary results have demonstrated that this method can improve the quality of the “demons” registration significantly, especially in low contrast regions.
Acknowledgments
The authors gratefully acknowledge the financial support from the National Institutes of Health grant number R01 CA140341.
Footnotes
Conflict of Interest: None.
Bibliography
- 1.Peters TM. Image-guidance for surgical procedures. Phys Med Biol. 2006 Jul;51(14):R505–R540. doi: 10.1088/0031-9155/51/14/R01. [DOI] [PubMed] [Google Scholar]
- 2.Kessler ML. Image registration and data fusion in radiation therapy. Br J Radiol. 2006 Sep;79(Spec No 1):S99–108. doi: 10.1259/bjr/70617164. [DOI] [PubMed] [Google Scholar]
- 3.Chen G, Sharp G, Mori S. A review of image-guided radiotherapy. Radiological Physics and Technology. 2009 Jan;2(1):1–12. doi: 10.1007/s12194-008-0045-y. [DOI] [PubMed] [Google Scholar]
- 4.Yan D. Adaptive radiotherapy: merging principle into clinical practice. Semin Radiat Oncol. 2010 Apr;20(2):79–83. doi: 10.1016/j.semradonc.2009.11.001. [DOI] [PubMed] [Google Scholar]
- 5.Zhong H, Weiss E, Siebers JV. Assessment of dose reconstruction errors in image-guided radiation therapy. Phys Med Biol. 2008 Feb;53(3):719–736. doi: 10.1088/0031-9155/53/3/013. [DOI] [PMC free article] [PubMed] [Google Scholar]
- 6.Christensen GE, Rabbitt RD, Miller MI. 3D brain mapping using a deformable neuroanatomy. Phys Med Biol. 1994 Mar;39(3):609–618. doi: 10.1088/0031-9155/39/3/022. [DOI] [PubMed] [Google Scholar]
- 7.Wang H, Dong L, O’Daniel J, Mohan R, Garden AS, Ang KK, Kuban DA, Bonnen M, Chang JY, Cheung R. Validation of an accelerated ‘demons’ algorithm for deformable image registration in radiation therapy. Phys Med Biol. 2005 Jun;50(12):2887–2905. doi: 10.1088/0031-9155/50/12/011. [DOI] [PubMed] [Google Scholar]
- 8.Nithiananthan S, Brock KK, Daly MJ, Chan H, Irish JC, Siewerdsen JH. Demons deformable registration for CBCT-guided procedures in the head and neck: convergence and accuracy. Medical Physics. 2009 Oct;36(10):4755–4764. doi: 10.1118/1.3223631. [DOI] [PMC free article] [PubMed] [Google Scholar]
- 9.Yang D, Lu W, Low DA, Deasy JO, Hope AJ, El NI. 4D-CT motion estimation using deformable image registration and 5D respiratory motion modeling. Medical Physics. 2008 Oct;35(10):4577–4590. doi: 10.1118/1.2977828. [DOI] [PMC free article] [PubMed] [Google Scholar]
- 10.Thirion JP. Image matching as a diffusion process: an analogy with Maxwell’s demons. Medical Image Analysis. 1998 Sep;2(3):243–260. doi: 10.1016/s1361-8415(98)80022-4. [DOI] [PubMed] [Google Scholar]
- 11.Barron JL, Beauchemin SS. Performance of optical flow techniques. International Journal of Computer Vision. 1994;12:43–77. [Google Scholar]
- 12.Rueckert D, Sonoda LI, Hayes C, Hill DL, Leach MO, Hawkes DJ. Nonrigid registration using free-form deformations: application to breast MR images. IEEE Trans Med Imaging. 1999 Aug;18(8):712–721. doi: 10.1109/42.796284. [DOI] [PubMed] [Google Scholar]
- 13.Lu W, Chen ML, Olivera GH, Ruchala KJ, Mackie TR. Fast free-form deformable registration via calculus of variations. Phys Med Biol. 2004 Jul;49(14):3067–3087. doi: 10.1088/0031-9155/49/14/003. [DOI] [PubMed] [Google Scholar]
- 14.Zienkiewicz OC, Taylor RL. Finite Element Method (5th Edition) Volume 1 - The Basis. Elsevier; 2000. [Google Scholar]
- 15.Ferrant M, Nabavi A, Macq B, Jolesz FA, Kikinis R, Warfield SK. Registration of 3-D intraoperative MR images of the brain using a finite-element biomechanical model. IEEE Trans Med Imaging. 2001 Dec;20(12):1384–1397. doi: 10.1109/42.974933. [DOI] [PubMed] [Google Scholar]
- 16.Crouch JR, Pizer SM, Chaney EL, Hu YC, Mageras GS, Zaider M. Automated finite-element analysis for deformable registration of prostate images. IEEE Trans Med Imaging. 2007 Oct;26(10):1379–1390. doi: 10.1109/TMI.2007.898810. [DOI] [PubMed] [Google Scholar]
- 17.Ogden RW. Non-Linear Ealstic Deformations. Ellis Horwood; 1984. [Google Scholar]
- 18.Brock KK, Sharpe MB, Dawson LA, Kim SM, Jaffray DA. Accuracy of finite element model-based multi-organ deformable image registration. Medical Physics. 2005 Jun;32(6):1647–1659. doi: 10.1118/1.1915012. [DOI] [PubMed] [Google Scholar]
- 19.Chi Y, Liang J, Yan D. A material sensitivity study on the accuracy of deformable organ registration using linear biomechanical models. Medical Physics. 2006 Feb;33(2):421–433. doi: 10.1118/1.2163838. [DOI] [PubMed] [Google Scholar]
- 20.Alterovitz R, Goldberg K, Pouliot J, Hsu IC, Kim Y, Noworolski SM, Kurhanewicz J. Registration of MR prostate images with biomechanical modeling and nonlinear parameter estimation. Medical Physics. 2006 Feb;33(2):446–454. doi: 10.1118/1.2163391. [DOI] [PubMed] [Google Scholar]
- 21.Samani A, Bishop J, Yaffe MJ, Plewes DB. Biomechanical 3-D finite element modeling of the human breast using MRI data. IEEE Trans Med Imaging. 2001 Apr;20(4):271–279. doi: 10.1109/42.921476. [DOI] [PubMed] [Google Scholar]
- 22.Zhang T, Orton NP, Mackie TR, Paliwal BR. Technical note: A novel boundary condition using contact elements for finite element based deformable image registration. Medical Physics. 2004 Sep;31(9):2412–2415. doi: 10.1118/1.1774131. [DOI] [PubMed] [Google Scholar]
- 23.Al-Mayah A, Moseley J, Brock KK. Contact surface and material nonlinearity modeling of human lungs. Phys Med Biol. 2008 Jan;53(1):305–317. doi: 10.1088/0031-9155/53/1/022. [DOI] [PubMed] [Google Scholar]
- 24.Al-Mayah A, Moseley J, Velec M, Brock KK. Sliding characteristic and material compressibility of human lung: parametric study and verification. Medical Physics. 2009 Oct;36(10):4625–4633. doi: 10.1118/1.3218761. [DOI] [PMC free article] [PubMed] [Google Scholar]
- 25.Zhong H, Kim J, Chetty IJ. Analysis of deformable image registration accuracy using computational modeling. Medical Physics. 2010 Mar;37(3):970–979. doi: 10.1118/1.3302141. [DOI] [PMC free article] [PubMed] [Google Scholar]
- 26.Kashani R, Hub M, Balter JM, Kessler ML, Dong L, Zhang L, Xing L, Xie Y, Hawkes D, Schnabel JA, McClelland J, Joshi S, Chen Q, Lu W. Objective assessment of deformable image registration in radiotherapy: a multi-institution study. Medical Physics. 2008 Dec;35(12):5944–5953. doi: 10.1118/1.3013563. [DOI] [PMC free article] [PubMed] [Google Scholar]
- 27.Zhong H, Wachowiak MP, Peters TM. A real time finite element based tissue simulation method incorporating nonlinear elastic behavior. Comput Methods Biomech Biomed Engin. 2005 Jun;8(3):177–189. doi: 10.1080/10255840500295852. [DOI] [PubMed] [Google Scholar]
- 28.Ibanez L, Schroeder W, Ng L, Cates J. The ITK Software Guide. 2005 [Google Scholar]
- 29.Zhong H, Peters T, Siebers JV. FEM-based evaluation of deformable image registration for radiation therapy. Phys Med Biol. 2007 Aug;52(16):4721–4738. doi: 10.1088/0031-9155/52/16/001. [DOI] [PubMed] [Google Scholar]
- 30.Kim J, Fessler JA. Intensity-based image registration using robust correlation coefficients. IEEE Trans Med Imaging. 2004 Nov;23(11):1430–1444. doi: 10.1109/TMI.2004.835313. [DOI] [PubMed] [Google Scholar]
- 31.Christensen GE, Rabbitt RD, Miller MI. Deformable templates using large deformation kinematics. IEEE Trans Image Process. 1996;5(10):1435–1447. doi: 10.1109/83.536892. [DOI] [PubMed] [Google Scholar]
- 32.Ferrant M, Warfield SK, Guttmann CRG, Mulkern RV, Jolesz FA, Kikinis R. 3D Image Matching Using a Finite Element Based Elastic Deformation Model. In: Taylor CJ, Colchester ACF, editors. Lecture Notes in Computer Science. 1679. 1999. pp. 202–209. [Google Scholar]
- 33.Teverovskiy LA, Carmichael OT, Aizenstein HJ, Lazar N, Liu Y. 2007. Feature-based vs. Intensity-based Brain Image Registration: Comprehensive Comparison Using Mutual Information; pp. 576–579. [Google Scholar]
- 34.Zhong H, Siebers JV. Monte Carlo dose mapping on deforming anatomy. Phys Med Biol. 2009 Oct;54(19):5815–5830. doi: 10.1088/0031-9155/54/19/010. [DOI] [PMC free article] [PubMed] [Google Scholar]
- 35.Zhong H, Jin JY, Ajlouni M, Movsas B, Chetty IJ. Measurement of regional compliance using 4DCT images for assessment of radiation treatment. Medical Physics. 2011 Mar;38(3):1567–1578. doi: 10.1118/1.3555299. [DOI] [PMC free article] [PubMed] [Google Scholar]


