

Abstract
Objectives
Fluoride (F) releasing dental restoratives are promising to promote remineralization and combat caries. The objectives of this study were to develop nanocomposite containing calcium fluoride nanoparticles (nCaF2), and to investigate the long-term mechanical durability including wear, thermal-cycling and long-term water-aging behavior.
Methods
Two types of fillers were used: nCaF2 with a diameter of 53 nm, and glass particles of 1.4 μm. Four composites were fabricated with fillers of: (1) 0% nCaF2 + 65% glass; (2) 10% nCaF2 + 55% glass; (3) 20% nCaF2 + 45% glass; (4) 30% nCaF2 + 35% glass. Three commercial materials were also tested. Specimens were subjected to thermal-cycling between 5 °C and 60 °C for 105 cycles, three-body wear for 4×10⁵ cycles, and water-aging for 2 years.
Results
After thermal-cycling, the nCaF2 nanocomposites had flexural strengths in the range of 100-150 MPa, five times higher than the 20-30 MPa for resin-modified glass ionomer (RMGI). The wear scar depth showed an increasing trend with increasing nCaF2 filler level. Wear of nCaF2 nanocomposites was within the range of wear for commercial controls. Water-aging decreased the strength of all materials. At 2 years, flexural strength was 94 MPa for nanocomposite with 10% nCaF2, 60 MPa with 20% nCaF2, and 48 MPa with 30% nCaF2. They are 3-6 fold higher than the 15 MPa for RMGI (p < 0.05). SEM revealed air bubbles and cracks in a RMGI, while composite control and nCaF2 nanocomposites appeared dense and solid.
Significance
Combining nCaF2 with glass particles yielded nanocomposites with long-term mechanical properties that were comparable to those of a commercial composite with little F release, and much better than those of RMGI controls. These strong long-term properties, together with their F release being comparable to RMGI as previously reported, indicate that the nCaF2 nanocomposites are promising for load-bearing and caries-inhibiting restorations.
Keywords: Dental nanocomposite, CaF2 nanoparticles, mechanical properties, thermal cycling, three-body wear, water-aging
1. Introduction
Fluoride (F)-releasing restoratives are frequently studied because the F ions could increase the dissolution resistance of the tooth structure, enhance remineralization and hinder demineralization [1-5]. Efforts have been made to develop and improve glass ionomers, resin-modified glass ionomers, and compomers [6-10]. One advantage of these materials is that F ions could be incorporated into the tooth to form fluoroapatite or F-enriched hydroxyapatite, both with lower solubility than hydroxyapatite. Another advantage is that while F ions had little effect on Streptococcus mutans viability, high F ion concentrations significantly reduced the acid production of biofilms [11]. These properties are important in view of the fact that recurrent caries is a major reason for restoration failure [12-14]. The replacement of failed restorations accounts for 50-70% of all restorations that are placed [15,16]. Replacement dentistry costs $5 billion annually in the U.S. [17]. F-releasing restoratives are promising to addressing this problem by promoting remineralization and inhibiting microbial growth and metabolism [9].
While useful for low-load-bearing restorations, glass ionomer cements do not have sufficient mechanical properties to be used in large-load-bearing restorations. It was predicted that “the most intractable problem (for glass ionomers) is likely to be lack of strength and toughness” [18]. Resin-modified glass ionomers were developed with improved mechanical strength, less moisture sensitivity, and better clinical handling properties [19]. However, the mechanical enhancement was rather limited. For example, when traditional and resin-modified glass ionomers were immersed in water for 12 months, it was shown that the microhardness was not enhanced with the addition of resins [20]. Efforts are being made to improve the F-releasing materials [3,5,8,21-25]. Resin composites possess good mechanical properties and wear resistance [26-34]. Therefore, one approach to improving the load-bearing capability of F-releasing restorations is to incorporate F-releasing fillers in resin composites.
Calcium fluoride nanoparticles (nCaF2) were recently synthesized via a spray-drying technique [35] and incorporated into resin composite [24]. The composite containing 20% nCaF2 had a cumulative F release of 2.34 mmol/L at 10 weeks [24]. The initial F release rate was 2 μg/(h·cm2), and the sustained release-rate at 10 weeks was 0.29 μg/(h·cm2). These values matched or exceeded the reported releases of traditional and resin-modified glass ionomers [24]. Immersion in solutions of pH 4 to 7 yielded similar strengths for the nCaF2 nanocomposites, which were significantly higher than the strengths of commercial F-releasing controls [36]. In addition, the nCaF2 nanocomposite was smart and greatly increased the F release at cariogenic low pH when these ions are most needed to inhibit caries [36]. However, the long-term mechanical durability of the nCaF2 nanocomposites has not been reported.
The objective of this study was to investigate the thermal-cycling, three-body wear, and 2-year water-aging behavior of the nCaF2 nanocomposites vs. nCaF2 filler level. It was hypothesized that: (1) Increasing the nCaF2 filler level will decrease the mechanical durability of the nanocomposite and increase the wear amount; (2) The nCaF2 nanocomposites will have less wear than the commercial controls; (3) nCaF2 nanocomposites will possess higher mechanical properties than commercial controls after thermal-cycling or water-aging for two years.
2. Materials and Methods
2.1 Fabrication of nCaF2 nanocomposites
A spray-drying apparatus described recently was used to synthesize the nCaF2 [24,35]. Briefly, a two-liquid nozzle (ViscoMist, Lechler, St. Charles, IL) was employed to allow two solutions to be mixed at the time of atomization. Calcium hydroxide, Ca(OH)2, was used to make the calcium solution [24,35]. Ammonium fluoride, NH4F, was used to prepare the fluoride solution. The two-liquid nozzle sprayed the solution into the heated chamber of the spay-dryer. The reaction of Ca(OH)2 and NH4F led to: Ca(OH)2 + 2NH4F → CaF2 + 2NH3↑ + 2H2O↑. The CaF2 nanoparticles were collected via an electrostatic precipitator (MistBuster, Air Quality Eng., Minneapolis, MN). The NH3 and H2O vapors were removed with the air flow. The nanopowder was confirmed to be CaF2 by X-ray diffraction in a previous study [24]. The nanopowder was dried in air overnight at 110 °C, and multipoint BET particle surface area analyses were performed (AUTOSORB-1, Quantachrome, Boynton Beach, FL) with ultra-high-purity nitrogen as the adsorbate gas and liquid nitrogen as the cryogen. Transmission electron microscopy (TEM, 3010-HREM, JEOL, Peabody, MA) was used to examine the particles.
A monomer consisting of 48.975% Bis-GMA (bisphenol glycidyl dimethacrylate), 48.975% TEGDMA (triethylene glycol dimethacrylate), 0.05% 2,6-di-tert-butyl-4-methylphenol, and 2% benzoyl peroxide formed part I, the initiator, of a two-part chemically-activated resin [24]. Part II, the accelerator resin, consisted of 49.5% Bis-GMA, 49.5% TEGDMA, and 1.0% N,N-dihydroxyethyl-p-toluidine. The two-part chemically-activated system was used because the nCaF2 paste was relatively opaque. Besides nCaF2 fillers, barium boroaluminosilicate glass particles of a median size of 1.4 μm (Caulk/Dentsply, Milford, DE) were used as a co-filler for mechanical reinforcement. Glass particles were silanized with 4% (all mass%, unless otherwise noted) 3-methacryloxypropyltrimethoxysilane and 2% n-propylamine [37]. Four composites were fabricated with the following fillers: (1) 0% nCaF2 + 65% glass; (2) 10% nCaF2 + 55% glass; (3) 20% nCaF2 + 45% glass; (4) 30% nCaF2 + 35% glass. nCaF2 filler levels of 40% or higher were not used because a previous study showed that the composite with 20% nCaF2 had F release comparable to that of a resin-modified glass ionomer. In addition, it is desirable to have at least 35% of glass fillers for reinforcement. Each resin was mixed with the filler particles, and then equal masses of paste I and paste II were mixed to form the chemically-cured composite. For thermal-cycling and water-aging, the mold dimensions were 2 mm × 2 mm × 25 mm. For wear, the mold cavity had a 4-mm diameter and 3-mm depth [38]. Specimens were incubated at 37 °C in a humidor for 1 d prior to treatments as described in subsequent sections.
In addition, three commercial materials were tested as comparative controls. A composite with glass nanoparticles of 40-200 nm (Heliomolar, Ivoclar Vivadent, Amherst, NY) is referred to as “Composite control”. The fillers were silica and ytterbium-trifluoride with a filler level of 66.7%. Heliomolar is indicated for Class I and Class II restorations in the posterior region, and Class III-V restorations. A resin-modified glass ionomer (Vitremer, 3M ESPE, St. Paul, MN) is referred to as “RMGI V”. It consisted of fluoroaluminosilicate glass, and a light-sensitive, aqueous polyalkenoic acid. Indications include Class III, V and root-caries restoration, Class I and II in primary teeth, and core-buildup. A powder/liquid ratio of 2.5/1 was used (filler mass fraction = 71.4%) according to the manufacturer. Another resin-modified glass ionomer (Ketac Nano, 3M) is referred to as “RMGI K”. It consisted of polycarboxilic acid modified with methacrylate groups and fluoroaluminosilicate glass, with a filler level of 69%. It is a two-part, paste/paste system and dispensed using the Clicker Dispensing System. It is recommended for primary teeth restorations, small Class I restorations, and Class III and V restorations. The specimens were photo-cured (Triad 2000, Dentsply, York, PA) for 1 min on each open side. Specimens were incubated in a humidor at 37 °C for 1 d prior to the treatments described below.
Thermal-cycling test
A computer-controlled two-temperature thermal-cycler was used at the Paffenbarger Research Center in the National Institute of Standards and Technology. Two water baths were maintained at temperatures of 5 °C and 60 °C, respectively. The seven materials were treated with 105 thermal cycles. Each cycle consisted of 15 seconds (s) immersion in each water bath and a travel time of 8 s [39]. The two temperatures were chosen to approximate the minimum and maximum temperatures found in the oral cavity. The water baths were constantly stirred with stirrers, and the variation in the temperature of each water bath was within 1 °C of the set temperature. All specimens for this test were first immersed in distilled water at 37 °C for 1 d. Then the specimens were divided into two groups. Group 1 had no thermal-cycling and was fractured in three-point flexure. Group 1 is designated as “Before thermal-cycling”. Group 2 was subjected to thermal-cycling as described above, and then fractured in three-point flexure. Group 2 is referred to as “After thermal-cycling”. The specimens of both groups were tested in three-point flexure in the same manner.
Flexural testing
A three-point flexural test was used to measure the flexural strength and elastic modulus on a computer-controlled Universal Testing Machine at a crosshead-speed of 1 mm/min and a 20-mm span (5500R, MTS, Cary, NC). Flexural strength was calculated as: S = 3PmaxL/(2bh2), where Pmax is the fracture load, L is span, b is specimen width and h is thickness. Elastic modulus was calculated as: E = (P/d)(L3/[4bh3]), where load P divided by displacement d is the slope of the load-displacement curve in the linear elastic region.
Three-body wear test
Wear was tested using a four-station wear apparatus (Caulk/Dentsply, Milford, DE) [38], similar to that previously described [40]. Each composite disk (diameter = 4 mm, thickness = 3 mm) was surrounded by a brass ring filled with a water slurry containing 63% of polymethyl methacrylate (PMMA) beads (mean size = 44 μm). A carbide steel pin with a tip diameter of 3 mm was loaded onto the specimen, which was submerged in the slurry of PMMA beads in each of the four stations. The pin was pressed down against the PMMA beads on the specimen surface and rotated 30 °. Upon reaching a maximum load of 76 N, the pin was counter-rotated during unloading and moved upward back to its original position. Each specimen was subjected to 4×10⁵ wear cycles following previous studies [38,40]. This type of wear produced a “dimple-like” wear scar into the specimen surface. The diameter and depth of each wear scar were measured via a computer-controlled profilometer (Mahr, Cincinnati, OH) equipped with a 5 μm diamond stylus. For each worn impression, profilometric tracings were made at intervals of 50 μm in two directions perpendicular to each other, with the unworn surface of the specimen as the baseline. The maximum values in the two perpendicular directions were then averaged to yield the maximum wear scar depth and the maximum diameter for each wear scar [38,40].
Water-aging
Specimens were immersed in distilled water at 37 °C for 0 d, 1 d, 1 month, 3 months, 6 months, 12 months, 18 months, and 24 months. The 0 d group refers to specimens that were incubated at 37 °C for 1 d in a humidor without immersion and then tested in flexure. For the immersion specimens, each group of six specimens of the same material was immersed in 200 mL of water in a sealed polyethylene container, following a previous study [41]. The water was changed once every week. At the end of each time period, the specimens were fractured using the aforementioned three-point flexural test to measure the flexural strength and elastic modulus. The immersed bars were tested within a few minutes after being taken out of the water and fractured while being wet.
SEM and statistics
Scanning electron microscopy (SEM) was used to examine the specimens after water-aging treatment. Both the specimen external surfaces and the fractured cross-sections were sputter-coated with platinum and palladium, and examined in a SEM (Quanta 200, FEI Company, Hillsboro, OR).
One-way and two-way ANOVA were performed to detect the significant effects of the variables. Tukey’s multiple comparison test was used to compare the data at a p value of 0.05.
RESULTS
TEM images of the nCaF2 are shown in Fig. 1. Examples of nCaF2 are shown in Fig. 1A with particle sizes of the order of 10 nm. Some larger particles were present with an example in Fig. 1B, having sizes of about 100-300 nm. These particle sizes are consistent with the BET measurement which obtained a specific surface area of 35.5 m2/g, yielding a particle size of 53 nm. The larger particles appeared to have been formed by numerous fine particles, which likely were fused together in the spray-drying chamber before the fine particles were fully dried. An example of a mixture of fine particles and large particles are shown in Fig. 1C.
Figure 1.
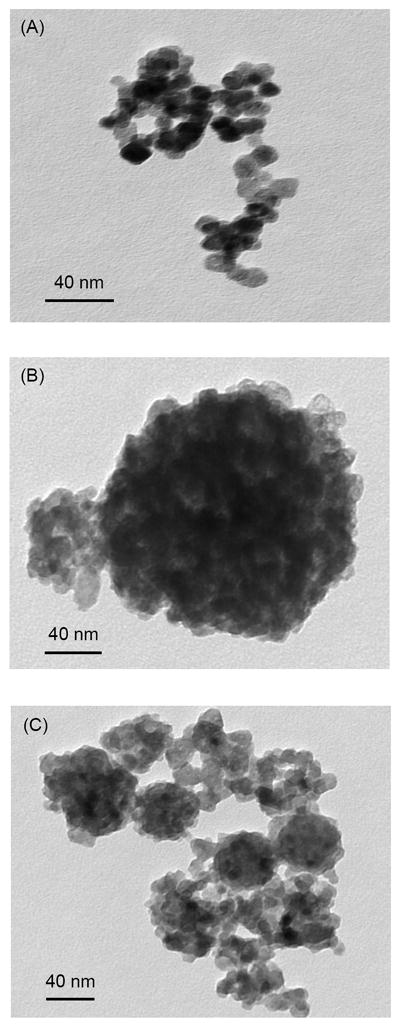
TEM images of CaF2 nanoparticles (nCaF2) synthesized using the spray-drying technique and collected via the electrostatic precipitator. (A) Fine nCaF2 particles. (B) Relatively large nCaF2 particles. (C) A mixture of fine and large particles.
Fig. 2 plots the thermal-cycling results. In Fig. 2A, the flexural strength of nCaF2 nanocomposite showed a decreasing trend with increasing nCaF2 filler level, because the glass filler level was decreasing from 65% to 35%. The strengths of composites with 0%, 10% and 20% of nCaF2 were not significantly different from each other (p > 0.1). The strength at 30% nCaF2 was significantly lower than that at 0% nCaF2 (p < 0.05). Composite control had a strength similar to that of the nanocomposite with 30% nCaF2 (p > 0.1). The strength of composite control was significantly lower than those at 0%, 10% and 20% of nCaF2 (p < 0.05). All nCaF2 nanocomposites had strengths in the range of 100-150 MPa, about 5 times higher than the 20-30 MPa for the commercial resin-modified glass ionomers.
Figure 2.
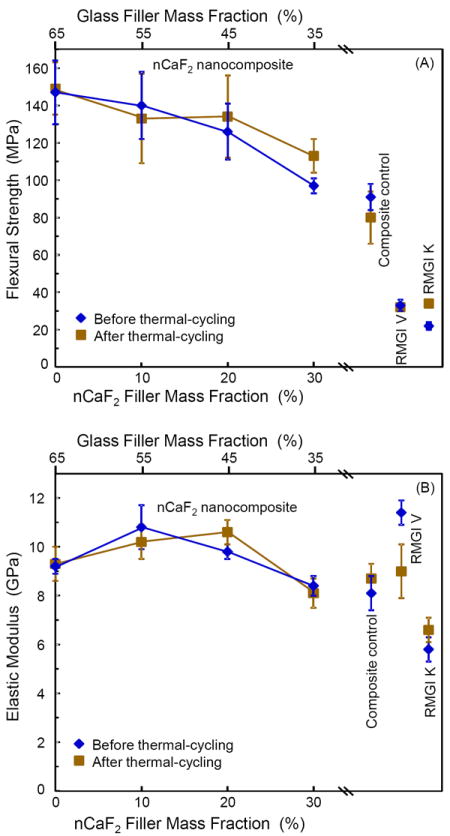
Mechanical properties before and after thermal-cycling. (A) Flexural strength, and (B) elastic modulus. In each plot, the upper axis lists the glass filler level in the nCaF2 nanocomposite, and the lower axis lists the corresponding nCaF2 filler level. Values for the three commercial controls are included near the right axis. Each value is the mean of six measurements, with the error bar showing one standard deviation (mean ± sd; n = 6).
Most materials showed no significant difference in strength before and after thermal-cycling. Only the nanocomposite with 30% nCaF2 and RMGI K had a slightly higher strength after thermal-cycling. The same is true for elastic modulus in Fig. 2B, where in general the materials had similar moduli before and after thermal-cycling. The nCaF2 nanocomposites had moduli that were within the range of the moduli of commercial controls.
Fig. 3 plots the three-body wear of nCaF2 nanocomposite vs. filler level, along with the controls. Both the wear scar depth in Fig. 3A and wear width in Fig. 3B showed an increasing trend with decreasing the glass filler level. The composite with 0% and 10% nCaF2 had wear depths similar to that of composite control (p > 0.1). All the nCaF2 nanocomposites had wear depths that were not significantly different from that of RMGI V (p > 0.1). RMGI K had higher wear than all the other materials (p < 0.05). The wear width showed a similar trend, with RMGI V having a similar wear width to those of the nCaF2 nanocomposites (p > 0.1).
Figure 3.
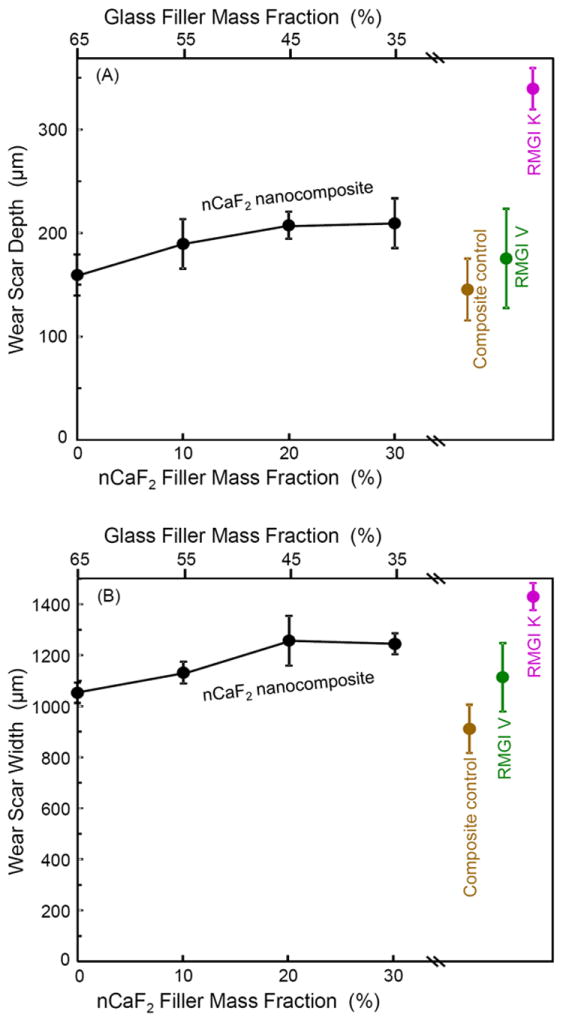
Three-body wear of nCaF2 nanocomposites and the controls. Wear produced a dimple-like scar into the composite surface. (A) Wear scar depth, and (B) wear scar width. In each plot, the upper axis lists the glass filler level in the nCaF2 nanocomposite, and the lower axis lists the corresponding nCaF2 filler level. Each value is mean ± sd; n = 6.
The 2-year water-aging results are plotted in Fig. 4A-B for flexural strength, and Fig. 4C-D for elastic modulus. The strength showed a generally decreasing trend with increasing water-aging time. For example, the nanocomposite with 20% nCaF2 had strength (mean ± sd; n = 6) of (125 ± 16) MPa without immersion, (109 ± 17) MPa after 6 months of immersion, (91 ± 23) MPa after 1 year of immersion, and (60 ± 13) MPa after 2 years of immersion.
Figure 4.
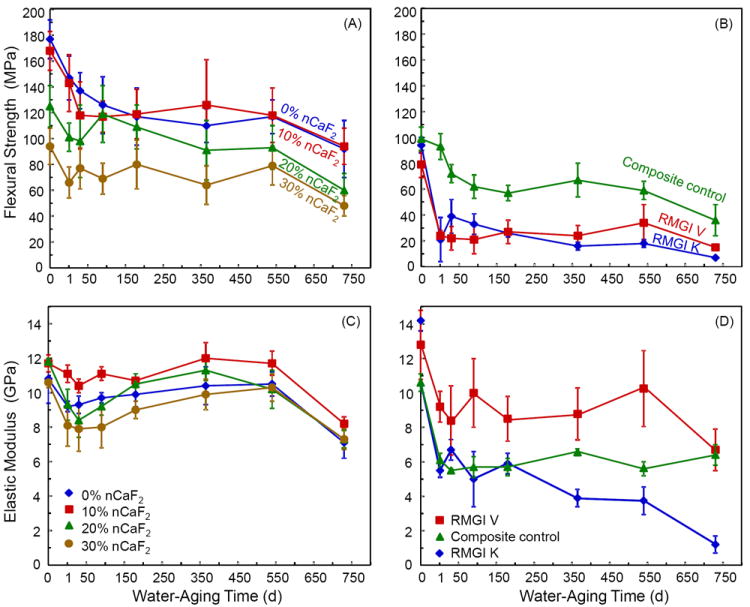
Long-term water-aging results of the nCaF2 nanocomposites and the control materials. Specimens were immersed in water at 37 °C for up to two years. (A and B) Flexural strength, and (C and D) elastic modulus. For each property, the seven materials were separated into two plots for clarity. Each value is mean ± sd; n = 6.
At each immersion time period, the nCaF2 nanocomposites had strengths slightly higher than composite control, and much higher than RMGI V and RMGI K. At 2 years, flexural strengths for the seven materials were: (92 ± 22) MPa for 0% nCaF2, (94 ± 14) MPa for 10% nCaF2, (60 ± 13) MPa for 20% nCaF2, (48 ± 8) MPa for 30% nCaF2, (36 ± 12) MPa for composite control, (15 ± 2) MPa for RMGI V, and (7 ± 3) MPa for RMGI K. The elastic moduli are plotted in Fig. 4C and Fig. 4D. In water-aging from 1 d to 2 years, the percentage of decrease in modulus is smaller than the percentage of decrease in strength. In addition, nCaF2 nanocomposites, composite control, and RMGI V had smaller modulus losses than RMGI K.
SEM was used to examine the external surface and the fracture surface (cross-section) of the water-aged specimens. Typical SEM micrographs are shown in Fig. 5 for RMGI K. Cracks were found in the external surface of RMGI K specimens from 1 d to 2 years. An example of these cracks (arrows) is shown in Fig. 5A at 2 years. Voids that appeared to be air bubbles were seen in the fracture surfaces of RMGI K from 1 d to 2 years, with an example in Fig. 5B at 1 d. The fracture surface of RMGI K contained cracks, with examples (arrows) in Fig. 5C at 2 years.
Figure 5.
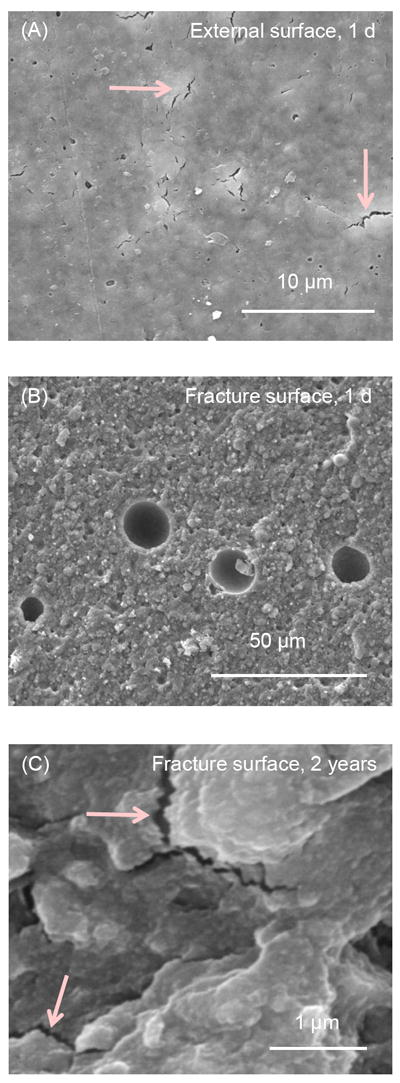
SEM micrographs for RMGI K. The specimen surface was referred to as the “external surface”. The interior of the specimen opened by three-point flexure is referred to as the “fracture surface”. (A) External surface after 2 years of immersion showed the existence of cracks. (B) Fracture surface at 1 d had voids that appeared to be air bubbles. (C) Fracture surface at 2 years had cracks, with examples indicated by the arrows.
Fig. 6 shows SEM micrographs for composite control. In Fig. 6A at 1 d, the external surface appeared relatively smooth and free of cracks such as those in Fig. 5. The external surface of composite control was similar from 1 d to 2 years. The fracture surface was free of air bubbles, and an example is shown in Fig. 6B. However, occasional flaws or irregular voids were found in the fracture surface of composite control, with an example shown in Fig. 6C at 2 years.
Figure 6.
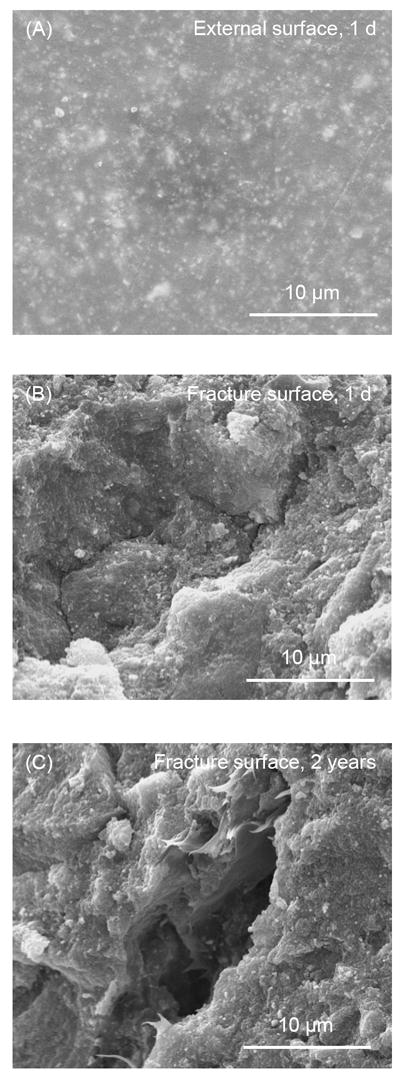
SEM micrographs for the composite control. (A) The external surface at 1 d was relatively smooth and free of cracks. Immersion for 2 years did not noticeably change the appearance of composite control. (B) Fracture surface at 2 years was free of the circular air bubbles. (C) Occasional flaws were noticed in the fracture surface of composite control. This example is in a specimen after 2 years of water-aging.
SEM images for the nCaF2 nanocomposite are shown in Fig. 7, at an intermediate nCaF2 filler level of 20%. The nCaF2 nanocomposite appeared similar to composite control, with smooth and crack-free surfaces. A typical external surface is shown in Fig. 7A at 1 d. There was no obvious change in the surfaces from 1 d to 2 years. The fracture surface of nCaF2 nanocomposite appeared dense and solid, without air bubbles or voids. Examples of fracture surfaces are shown in Fig. 7B at 1 d, and Fig. 7C at 2 years. No cracks or signs of matrix disintegration were found in the nCaF2 nanocomposite with immersion from 1 d to 2 years.
Figure 7.
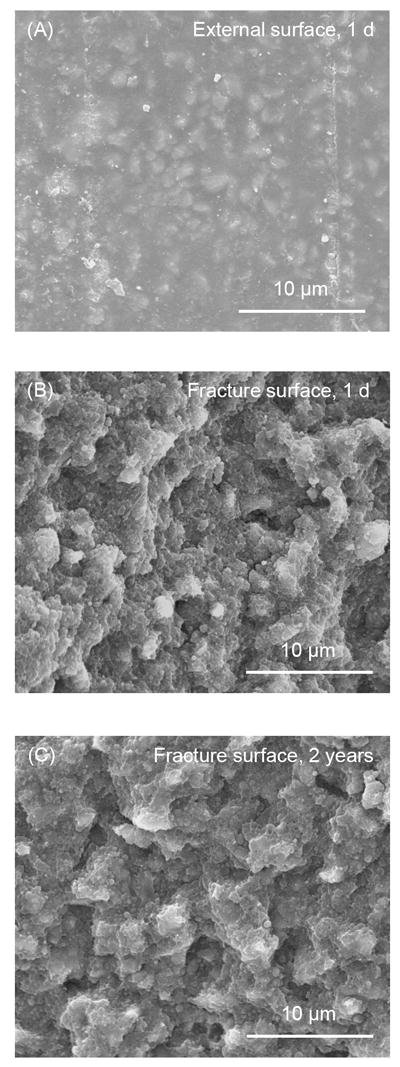
SEM micrographs for nCaF2 nanocomposites, at an intermediate nCaF2 filler level of 20%. External and fracture surfaces for the nCaF2 nanocomposites were similar to those of the composite control. (A) The external surfaces were smooth and crack-free from 1 d to 2 years. This example is for a specimen immersed for 1 d. Fracture surfaces of nCaF2 nanocomposite appeared dense and solid, and were generally free of air bubbles and other voids, with examples shown in (B) at 1 d, and (C) at 2 years.
DISCUSSION
F-releasing materials are a promising class of dental restoratives because the F ions can enrich neighboring tooth structure and render them more resistant to decay [1-5], and can hinder the metabolic activity of acidogenic biofilms [11]. Therefore, extensive studies have been performed to develop and improve F-releasing restoratives [3,5-8,10,22,25]. Glass ionomers and resin-modified glass ionomers have relatively lower mechanical properties, and hence are limited to low-load-bearing restorations and in patients with a high caries risk. F-releasing composites have better load-bearing capabilities, but their F release was minimal. The new nCaF2 nanocomposites have the rare combination of high levels of F release and yet being mechanically strong. In the present study, the long-term mechanical durability of nCaF2 nanocomposites, including thermal-cycling, wear, and water-aging, was investigated for the first time.
Recent studies showed that the new nCaF2 nanocomposites had F release that matched or exceeded those of commercial F-releasing restoratives [24]. The long-term F release rates at 70-84 d were 1.13 μg/(cm2·day) and 0.50 μg/(cm2·day) for nanocomposite containing 30% and 20% nCaF2, respectively, similar to the 0.65 μg/(cm2·day) of RMGI V [36]. These F release rates were two orders of magnitude higher than the 0.006 μg/(cm2·day) for the F-releasing composite control (Heliomolar). The previous study showed that the strengths of nCaF2 nanocomposites were nearly 3-fold that of resin-modified glass ionomer, and were comparable to, or higher than, that of a commercial composite with little F-release [36]. However, the previous studies did not investigate the long-term mechanical durability of the nCaF2 nanocomposites.
Thermal-cycling could create internal stresses in a composite which could potentially degrade the composite over time. Daily drinks such as ice water and icy soda could approach a temperature of 0 °C. Hot soup, tea and coffee could surpass a temperature of 60 °C. For a composite in a tooth cavity, the difference in thermal expansion between the restoration and the surrounding tooth structure may contribute to restoration-tooth debonding and microleakage. In addition, for the composite itself, there are internal stresses due to thermal expansion differences between the resin and the filler particles. For example, the thermal coefficient of expansion is about 8 to 12 × 10-6 /°C for glass and ceramic fillers, and 76 × 10-6 /°C for acrylic resin [42,43]. With increasing temperature, the filler particle would expand less than the resin matrix. With decreasing temperature, the resin matrix would shrink more than the filler. In the present study, the seven materials were subjected to 105 thermal-cycles between 5 °C and 60 °C. None of the seven materials showed any significant decrease in mechanical properties due to thermal-cycling; only RMGI V showed a small decrease in elastic modulus. Hence, the internal stresses due to thermal-cycling between a relatively small temperature range of 5-60 °C did not cause significant damage to these restorative materials. In addition, dwelling at a temperature of 60 °C could cause further polymerization and increase the degree of conversion for the resins. Therefore, there were two competing factors in thermal-cycling: The water immersion and cyclic thermal stresses that could degrade the material and decrease the mechanical properties; and the high temperature of 60 °C that could improve the degree of conversion and enhance the mechanical properties. Fig. 2 indeed showed that several materials had slightly higher strength and modulus after thermal-cycling. However, the changes in either direction were relatively small. In general, the results in Fig. 2 demonstrated that the flexural strengths of the novel nCaF2 nanocomposites moderately exceeded that of the commercial composite control, and were 3-4 fold that of resin-modified glass ionomers, both before and after thermal-cycling.
Oral wear is another key property for restorations [28,40,44-48]. Wear is directly related to the functionality of restorative materials, and excessive wear and material loss would cause the restoration to lose contour and be out of occlusion. Efforts were made to improve the occlusal wear resistance of restorative materials [38,45,47]. In addition, wear testing methods were developed to simulate in vivo wear conditions [28,40,44,46,48]. It was demonstrated that three-body wear using artificial food slurries yielded wear amounts that corresponded well with the clinical wear results [40,44,45]. Regarding the correlation between these in vitro wear values and clinical wear, a previous study [40] used the same type of wear machine as that of the present study, and compared the results with in vivo data. They found that the 4×10⁵ cycles of in vitro wear values agreed with the in vivo wear values over a three-year period. The nCaF2 nanocomposites had wear depth and width that were slightly larger than the composite control, matched those of RMGI V, and were significantly less than those of RMGI K. Hence, the wear of CaF2 nanocomposites was within the range of wear of the commercial controls.
Dental composites in vivo function in a wet oral environment which could degrade the restorations [31,34,49-51]. It is established that composites could be weakened by long-term water-aging, which could degrade the fillers [41,49], soften the resin due to the plasticizing action of water [50], and cause hydrolytic breakdown of the interfaces between the fillers and the resin matrix [20,31,50]. Because the present study focused on nCaF2 nanocomposites, a commercial nanocomposite with F release and a nano-structured resin-modified glass ionomer cement were selected as controls; it should be noted that other F-releasing composites are also available which may possess different properties. A recent study examined three commercial composites which showed F release and recharge when aged in deionized water and lactic acid [10]. During immersion for 3 months, the F-releasing composites had significantly higher mechanical properties than glass ionomer cements [10], consistent with the results of the present study. These results confirm the importance of glass filler reinforcement. Incorporating glass reinforcement particles in the nCaF2 composite effectively increased the mechanical properties. Indeed, at 2 years, the strength of nCaF2 nanocomposite was significantly higher with higher glass filler levels (Fig. 4A). Furthermore, the mechanical properties of glass particle-reinforced nCaF2 nanocomposites were significantly higher than those of the resin-modified glass ionomers, which did not have stable glass particles for reinforcement.
The results in Figs. 2-4 suggest that it is beneficial to incorporate both F-releasing fillers and non-releasing glass fillers in the same restorative material, in order to obtain good mechanical properties for the F-releasing restorative. The key is that the restorative should not rely on fillers that release ions to provide mechanical properties. Instead, the restorative should rely on strong and non-releasing fillers for mechanical properties. The dilemma, however, is that the restorative that contain sufficient amounts of releasing fillers does not have enough room in the matrix to incorporate reinforcing fillers. On the other hand, restoratives that contain sufficient amounts of reinforcing fillers do not have much room in the matrix to accommodate F-releasing fillers. This results in restoratives that have either high levels of F release but are mechanically weak, or high mechanical properties but with little F release. To date, the material that has high mechanical properties and high F release is yet to be developed. Fortunately, the new generation of nanoparticles with ion release may provide the solution to achieving both high levels of F release and strong and long-lasting mechanical properties in the same composite.
This is because the small size of nCaF2 with a high surface area can contribute to a high level of ion release even at a low filler level in the composite. A recent study showed that the Ca and PO4 ion release were greatly increased when the particle size was reduced from 0.88 μm to 0.11 μm, while the type of resin and the filler level were kept the same [37]. The nCaF2 of the present study had a mean diameter of 53 nm, and a specific surface area A = 35.5 m2/g. For the purpose of illustration, assume a traditional particle size d = 1 μm. With the CaF2 density ρ = 3.18 g/cm3, the specific surface area would be A = 6/(d ρ) = 1.9 m2/g for the traditional CaF2 particles with 1 μm in size. Hence, compared to traditional micron-sized particles, the nCaF2 had a specific surface area that was nearly 20-fold larger. This large surface area allowed the use of relatively low filler levels of 10-30% for nCaF2 to achieve F release that was comparable to resin-modified glass ionomers [36]. As a result, there is significant room left in the resin matrix for reinforcement glass fillers to increase the mechanical properties. The present study showed that, indeed, the higher the glass filler level, the higher the strength during thermal-cycling and two-year water-aging, and the better the wear resistance. With the incorporation of both nCaF2 and glass fillers, the nanocomposite relied on the glass fillers, not the nCaF2 fillers, for mechanical reinforcement. The nCaF2 paste was relatively opaque with a greyish color, possibly caused by metal ions in the spray-drying process. Further effort is needed to improve the spray-drying technique and develop esthetic nanoparticles capable of high levels of F release. In addition, further study should optimize the nCaF2 nanocomposite structure. For example, while using 20% nCaF2, the glass filler level could possibly be increased from the current 45% to 50% or 55%, to further improve the long-term durability for load-bearing restorations, while maintaining the F release to inhibit caries.
Summary
Two types of fillers (nCaF2 nanoparticles with a diameter of 53 nm, and glass particles with a size of 1.4 μm) were incorporated into a resin to develop F-releasing nanocomposite with load-bearing capabilities. The rationale was to address the need that restoratives with high levels of F release are mechanically weak, restoratives with large load-bearing capabilities had no or little F release, and the restorative with both high F-release and high mechanical properties is not available. The nanocomposites of this study exhibited strong mechanical durability when tested in thermal-cycling, wear, and water-aging for 2 years. Thermal-cycling between 5 °C and 60 °C for 105 cycles did not degrade the flexural strength and elastic modulus of the nanocomposites. Three-body wear depth and width of the nCaF2 nanocomposites were within the range of the commercial controls. Increasing the immersion time from 1 d to 2 years decreased the mechanical properties of all the seven materials tested. At 2 years, the strengths of nCaF2 nanocomposites were moderately higher than that of the control composite, and 3-6 fold higher than those of resin-modified glass ionomers. Recent studies showed that nCaF2 nanocomposite with 20-30% nCaF2 had F release rates comparable to that of a resin-modified glass ionomer. The strong long-term mechanical properties and high F release suggest that the new nCaF2 nanocomposites are promising for stress-bearing and caries-inhibiting restorations.
Supplementary Material
SEM micrographs for experimental composite filled with 0% nCaF2 + 65% glass. (A) The external surfaces of the specimens were smooth and crack-free from 1 d to 2 years. This example is for a specimen immersed for 1 d. The fracture surfaces appeared to be dense and solid, and were generally free of air bubbles and other voids, with examples shown in (B) at 1 d, and (C) at 2 years.
SEM micrographs for nanocomposite filled with 10% nCaF2 + 55% glass. (A) The external surfaces were smooth and crack-free from 1 d to 2 years. The example shown in (A) was immersed for 1 d; specimens immersed for 2 years had similar appearances. The fracture surfaces were dense and solid, and were generally free of air bubbles and other voids. Examples of the fracture surfaces are shown in (B) at 1 d, and (C) at 2 years.
SEM micrographs for nanocomposite filled with 30% nCaF2 + 35% glass. (A) The external surfaces of the composite were smooth and crack-free from 1 d to 2 years. The example shown in (A) was immersed for 1 d. Specimens immersed for 2 years appeared similar to that at 1 d. Examples of fracture surfaces are shown in (B) at 1 d, and (C) at 2 years. The fracture surfaces appeared to be dense and solid.
SEM micrographs for RMGI V. The external surfaces of the specimens contained cracks, with an example shown in (A) at 1 d. Arrows indicate cracks. Such cracks were observed in all specimens from 1 d to 2 years of immersion. Similar cracks were also observed in the fracture surfaces: (B) 1 d, and (C) 2 years.
Acknowledgments
We gratefully thank Dr. L. Sun, Dr. G. E. Schumacker, Kathleen Hoffman, and A. A. Giuseppetti of the American Dental Association Foundation for discussions and experimental assistance. We acknowledge the technical support of the Core Imaging Facility of the University of Maryland Baltimore. We are grateful to Esstech (Essington, PA) and Dr. Sibel Antonson at Ivoclar Vivadent (Amherst, NY) for donating the materials. This study was supported by NIH R01DE14190 and R01DE17974 (HX) and the University of Maryland School of Dentistry.
Footnotes
Publisher's Disclaimer: This is a PDF file of an unedited manuscript that has been accepted for publication. As a service to our customers we are providing this early version of the manuscript. The manuscript will undergo copyediting, typesetting, and review of the resulting proof before it is published in its final citable form. Please note that during the production process errors may be discovered which could affect the content, and all legal disclaimers that apply to the journal pertain.
References
- 1.Glasspoole EA, Erickson RL, Davidson CL. A fluoride-releasing composite for dental applications. Dent Mater. 2001;17:127–133. doi: 10.1016/s0109-5641(00)00051-8. [DOI] [PubMed] [Google Scholar]
- 2.Kielbassa AM, Schulte-Monting J, García-Godoy F, Meyer-Lueckel H. Initial in situ secondary caries formation: Effect of various fluoride-containing restorative materials. Oper Dent. 2003;28:765–772. [PubMed] [Google Scholar]
- 3.Tyas MJ. Clinical evaluation of glass-ionomer cement restorations. J Applied Oral Sci. 2006;14:10–13. doi: 10.1590/s1678-77572006000700003. [DOI] [PubMed] [Google Scholar]
- 4.Ten Cate JM, Buijs MJ, Miller CC, Exterkate RAM. Elevated fluoride products enhance remineralization of advanced enamel lesions. J Dent Res. 2008;87:943–947. doi: 10.1177/154405910808701019. [DOI] [PubMed] [Google Scholar]
- 5.Ling L, Xu X, Choi GY, Billodeaux D, Guo G, Diwan RM. Novel F-releasing composite with improved mechanical properties. J Dent Res. 2009;88:83–88. doi: 10.1177/0022034508328254. [DOI] [PMC free article] [PubMed] [Google Scholar]
- 6.Asmussen E, Peutzfeldt A. Long-term fluoride release from a glass ionomer cement, a compomer, and from experimental resin composites. Acta Odontol Scand. 2002;60:93–97. doi: 10.1080/000163502753509482. [DOI] [PubMed] [Google Scholar]
- 7.Itota T, Carrick TE, Yoshiyama M, McCabe JF. Fluoride release and recharge in giomer, compomer and resin composite. Dent Mater. 2004;20:789–795. doi: 10.1016/j.dental.2003.11.009. [DOI] [PubMed] [Google Scholar]
- 8.Anusavice KJ, Zhang NZ, Shen C. Effect of CaF2 content on rate of fluoride release from filled resins. J Dent Res. 2005;84:440–444. doi: 10.1177/154405910508400508. [DOI] [PubMed] [Google Scholar]
- 9.Wiegand A, Buchalla W, Attin T. Review on fluoride-releasing restorative materials – fluoride release and uptake characteristics, antibacterial activity and influence on caries formation. Dent Mater. 2007;23:343–362. doi: 10.1016/j.dental.2006.01.022. [DOI] [PubMed] [Google Scholar]
- 10.Naoum S, Ellakwa A, Martin F, Swain M. Fluoride release, recharge and mechanical properties of various fluoride-containing resin composites. Oper Dent. 2011;36:422–432. doi: 10.2341/10-414-L. [DOI] [PubMed] [Google Scholar]
- 11.Deng DM, van Loveren C, ten Cate JM. Caries-preventive agents induce remineralization of dentin in a biofilm model. Caries Res. 2005;39:216–223. doi: 10.1159/000084801. [DOI] [PubMed] [Google Scholar]
- 12.Mjör IA, Moorhead JE, Dahl JE. Reasons for replacement of restorations in permanent teeth in general dental practice. International Dent J. 2000;50:361–366. doi: 10.1111/j.1875-595x.2000.tb00569.x. [DOI] [PubMed] [Google Scholar]
- 13.Sarrett DC. Clinical challenges and the relevance of materials testing for posterior composite restorations. Dent Mater. 2005;21:9–20. doi: 10.1016/j.dental.2004.10.001. [DOI] [PubMed] [Google Scholar]
- 14.Sakaguchi RL. Review of the current status and challenges for dental posterior restorative composites: clinical, chemistry, and physical behavior considerations. Dent Mater. 2005;21:3–6. doi: 10.1016/j.dental.2004.10.008. [DOI] [PubMed] [Google Scholar]
- 15.Deligeorgi V, Mjor IA, Wilson NH. An overview of reasons for the placement and replacement of restorations. Prim Dent Care. 2001;8:5–11. doi: 10.1308/135576101771799335. [DOI] [PubMed] [Google Scholar]
- 16.Frost PM. An audit on the placement and replacement of restorations in a general dental practice. Prim Dent Care. 2002;9:31–36. doi: 10.1308/135576102322547548. [DOI] [PubMed] [Google Scholar]
- 17.Jokstad A, Bayne S, Blunck U, Tyas M, Wilson N. Quality of dental restorations. FDI Commision Projects 2-95. International Dent J. 2001;51:117–158. doi: 10.1002/j.1875-595x.2001.tb00832.x. [DOI] [PubMed] [Google Scholar]
- 18.Wilson AD, McLean JW. Glass-ionomer cement. Chicago: Quintessence Pub Co; 1988. [Google Scholar]
- 19.Smith DC. Development of glass ionomer cement systems. Biomaterials. 1998;19:467–478. doi: 10.1016/s0142-9612(97)00126-9. [DOI] [PubMed] [Google Scholar]
- 20.Ellakuria J, Triana R, Minguez N, Soler I, Ibaseta G, Maza J, García-Godoy F. Effect of one-year water storage on the surface microhardness of resin-modified versus conventional glass-ionomer cements. Dent Mater. 2003;19:286–290. doi: 10.1016/s0109-5641(02)00042-8. [DOI] [PubMed] [Google Scholar]
- 21.Carey CM, Spencer M, Gove RJ, Eichmiller FC. Fluoride release from a resin-modified glass ionomer cement in a continuous-flow system: Effect of pH. J Dent Res. 2003;82:829–832. doi: 10.1177/154405910308201013. [DOI] [PubMed] [Google Scholar]
- 22.Xu X, Ling L, Wang R, Burgess JO. Formation and characterization of a novel fluoride-releasing dental composite. Dent Mater. 2006;22:1014–1023. doi: 10.1016/j.dental.2005.11.027. [DOI] [PubMed] [Google Scholar]
- 23.Xie D, Yang Y, Zhao J, Park JG, Zhang JT. A novel comonomer-free light-cured glass-ionomer cement for reduced cytotoxicity and enhanced mechanical strength. Dent Mater. 2007;23:994–1003. doi: 10.1016/j.dental.2006.09.001. [DOI] [PubMed] [Google Scholar]
- 24.Xu HHK, Moreau JL, Sun L, Chow LC. Strength and fluoride release characteristics of a calcium fluoride based dental nanocomposite. Biomaterials. 2008;29:4261–4267. doi: 10.1016/j.biomaterials.2008.07.037. [DOI] [PMC free article] [PubMed] [Google Scholar]
- 25.Xie D, Weng Y, Guo X, Zhao J, Gregory RL, Zheng C. Preparation and evaluation of a novel glass-ionomer cement with antibacterial functions. Dent Mater. 2011;27:487–496. doi: 10.1016/j.dental.2011.02.006. [DOI] [PubMed] [Google Scholar]
- 26.Ferracane JL. Resin composite - State of the art. Dent Mater. 2011;27:29–38. doi: 10.1016/j.dental.2010.10.020. [DOI] [PubMed] [Google Scholar]
- 27.Bayne SC, Thompson JY, Swift EJ, Jr, Stamatiades P, Wilkerson M. A characterization of first-generation flowable composites. J Am Dent Assoc. 1998;129:567–577. doi: 10.14219/jada.archive.1998.0274. [DOI] [PubMed] [Google Scholar]
- 28.Lim BS, Ferracane JL, Condon JR, Adey JD. Effect of filler fraction and filler surface treatment on wear of microfilled composites. Dent Mater. 2002;18:1–11. doi: 10.1016/s0109-5641(00)00103-2. [DOI] [PubMed] [Google Scholar]
- 29.Watts DC, Marouf AS, Al-Hindi AM. Photo-polymerization shrinkage-stress kinetics in resin-composites: methods development. Dent Mater. 2003;19:1–11. doi: 10.1016/s0109-5641(02)00123-9. [DOI] [PubMed] [Google Scholar]
- 30.Lu H, Stansbury JW, Bowman CN. Impact of curing protocol on conversion and shrinkage stress. J Dent Res. 2005;84:822–826. doi: 10.1177/154405910508400908. [DOI] [PubMed] [Google Scholar]
- 31.Drummond JL. Degradation, fatigue, and failure of resin dental composite materials. J Dent Res. 2008;87:710–719. doi: 10.1177/154405910808700802. [DOI] [PMC free article] [PubMed] [Google Scholar]
- 32.Xu HHK, Weir MD, Sun S, Moreau JL, Takagi S, Chow LC, Antonucci JM. Strong nanocomposites with Ca, PO4 and F release for caries inhibition. J Dent Res. 2010;89:19–28. doi: 10.1177/0022034509351969. [DOI] [PMC free article] [PubMed] [Google Scholar]
- 33.Moraes RR, Garcia JW, Barros MD, Lewis SH, Pfeifer CS, Liu JC, Stansbury JW. Control of polymerization shrinkage and stress in nanogel-modified monomer and composite materials. Dent Mater. 2011;27:509–519. doi: 10.1016/j.dental.2011.01.006. [DOI] [PMC free article] [PubMed] [Google Scholar]
- 34.Wei YJ, Silikas N, Zhang ZT, Watts DC. Hygroscopic dimensional changes of self-adhering and new resin-matrix composites during water sorption/desorption cycles. Dent Mater. 2011;27:259–266. doi: 10.1016/j.dental.2010.10.015. [DOI] [PubMed] [Google Scholar]
- 35.Sun L, Chow LC. Preparation and properties of nano-sized calcium fluoride for dental applications. Dent Mater. 2008;24:111–116. doi: 10.1016/j.dental.2007.03.003. [DOI] [PMC free article] [PubMed] [Google Scholar]
- 36.Xu HHK, Moreau JL, Sun L, Chow LC. Novel CaF2 nanocomposite with high strength and F ion release. J Dent Res. 2010;89:739–745. doi: 10.1177/0022034510364490. [DOI] [PMC free article] [PubMed] [Google Scholar]
- 37.Xu HHK, Weir MD, Sun L. Nanocomposites with Ca-PO4 release: Effects of reinforcement, dicalcium phosphate particle size and silanization. Dent Mater. 2007;23:1482–1491. doi: 10.1016/j.dental.2007.01.002. [DOI] [PMC free article] [PubMed] [Google Scholar]
- 38.Xu HHK, Quinn JB, Giuseppetti AA. Wear and mechanical properties of nano-silica-fused whisker composites. Journal of Dental Research. 2004;83:930–935. doi: 10.1177/154405910408301208. [DOI] [PubMed] [Google Scholar]
- 39.Xu HHK, Eichmiller FC, Smith DT, Schumacher GE, Giuseppetti AA, Antonucci JM. Effect of thermal cycling on whisker-reinforced dental resin composites. J Mater Sci: Mater in Medicine. 2002;13:875–883. doi: 10.1023/a:1016504530133. [DOI] [PubMed] [Google Scholar]
- 40.Leinfelder KF, Suzuki S. In vitro wear device for determining posterior composite wear. J Am Dent Assoc. 1999;130:1347–1353. doi: 10.14219/jada.archive.1999.0406. [DOI] [PubMed] [Google Scholar]
- 41.Xu HHK. Long-term water aging of whisker-reinforced polymer-matrix composites. J Dent Res. 2003;82:48–52. doi: 10.1177/154405910308200111. [DOI] [PubMed] [Google Scholar]
- 42.Powers JM, Sakaguchi RL. Craig’s Restorative Dental Materials. 12. Mosby; St, Louis, Missouri: 2006. p. 41. [Google Scholar]
- 43.Ferracane JL. Materials in Dentistry. 2. Lippinott Williams & Wilkins; Baltimore, MD: 2001. p. 21. [Google Scholar]
- 44.Condon JR, Ferracane JL. Evaluation of composite wear with a new multi-mode oral wear simulator. Dent Mater. 1996;12:218–226. doi: 10.1016/s0109-5641(96)80026-1. [DOI] [PubMed] [Google Scholar]
- 45.de Gee AJ, Van Duinen RNB, Werner A, Davidson CL. Early and long-term wear of conventional and resin-modified glass ionomers. J Dent Res. 1996;75:1613–1619. doi: 10.1177/00220345960750081401. [DOI] [PubMed] [Google Scholar]
- 46.Ruddell DE, Maloney MM, Thompson JY. Effect of novel filler particles on the mechanical and wear properties of dental composites. Dent Mater. 2002;18:72–80. doi: 10.1016/s0109-5641(01)00022-7. [DOI] [PubMed] [Google Scholar]
- 47.Niheia T, Dabanoglub A, Teranakaa T, Kuratac S, Ohashia K, Kondod Y, Yoshinod N, Hickel R, Kunzelmann KH. Three-body-wear resistance of the experimental composites containing filler treated with hydrophobic silane coupling agents. Dent Mater. 2008;24:760–764. doi: 10.1016/j.dental.2007.09.001. [DOI] [PubMed] [Google Scholar]
- 48.Heintzea SD, Barkmeierb WW, Lattab MA, Rousson V. Round robin test: Wear of nine dental restorative materials in six different wear simulators - Supplement to the round robin test of 2005. Dent Mater. 2011;27:e1–e9. doi: 10.1016/j.dental.2010.09.003. [DOI] [PubMed] [Google Scholar]
- 49.Calais JG, Söderholm KJ. Influence of filler type and water exposure on flexural strength of experimental composite resins. J Dent Res. 1988;67:836–840. doi: 10.1177/00220345880670050801. [DOI] [PubMed] [Google Scholar]
- 50.Ferracane JL, Berge HX, Condon JR. In vitro aging of dental composites in water - Effect of degree of conversion, filler volume, and filler/matrix coupling. J Biomed Mater Res. 1998;42:465–472. doi: 10.1002/(sici)1097-4636(19981205)42:3<465::aid-jbm17>3.0.co;2-f. [DOI] [PubMed] [Google Scholar]
- 51.Sideridou ID, Karabela MM, Vouvoudi EC. Physical properties of current dental nanohybrid and nanofill light-cured resin composites. Dent Mater. 2011;27:598–607. doi: 10.1016/j.dental.2011.02.015. [DOI] [PubMed] [Google Scholar]
Associated Data
This section collects any data citations, data availability statements, or supplementary materials included in this article.
Supplementary Materials
SEM micrographs for experimental composite filled with 0% nCaF2 + 65% glass. (A) The external surfaces of the specimens were smooth and crack-free from 1 d to 2 years. This example is for a specimen immersed for 1 d. The fracture surfaces appeared to be dense and solid, and were generally free of air bubbles and other voids, with examples shown in (B) at 1 d, and (C) at 2 years.
SEM micrographs for nanocomposite filled with 10% nCaF2 + 55% glass. (A) The external surfaces were smooth and crack-free from 1 d to 2 years. The example shown in (A) was immersed for 1 d; specimens immersed for 2 years had similar appearances. The fracture surfaces were dense and solid, and were generally free of air bubbles and other voids. Examples of the fracture surfaces are shown in (B) at 1 d, and (C) at 2 years.
SEM micrographs for nanocomposite filled with 30% nCaF2 + 35% glass. (A) The external surfaces of the composite were smooth and crack-free from 1 d to 2 years. The example shown in (A) was immersed for 1 d. Specimens immersed for 2 years appeared similar to that at 1 d. Examples of fracture surfaces are shown in (B) at 1 d, and (C) at 2 years. The fracture surfaces appeared to be dense and solid.
SEM micrographs for RMGI V. The external surfaces of the specimens contained cracks, with an example shown in (A) at 1 d. Arrows indicate cracks. Such cracks were observed in all specimens from 1 d to 2 years of immersion. Similar cracks were also observed in the fracture surfaces: (B) 1 d, and (C) 2 years.