

Abstract
Positive feedback is a common mechanism enabling biological systems to respond to stimuli in a switch-like manner. Such systems are often characterized by the requisite formation of a heterodimer where only one of the pair is subject to feedback. This ASymmetric Self-UpREgulation (ASSURE) motif is central to many biological systems, including cholesterol homeostasis (LXRα/RXRα), adipocyte differentiation (PPARγ/RXRα), development and differentiation (RAR/RXR), myogenesis (MyoD/E12) and cellular antiviral defense (IRF3/IRF7). To understand why this motif is so prevalent, we examined its properties in an evolutionarily conserved transcriptional regulatory network in yeast (Oaf1p/Pip2p). We demonstrate that the asymmetry in positive feedback confers a competitive advantage and allows the system to robustly increase its responsiveness while precisely tuning the response to a consistent level in the presence of varying stimuli. This study reveals evolutionary advantages for the ASSURE motif, and mechanisms for control, that are relevant to pharmacologic intervention and synthetic biology applications.
Keywords: heterodimer, kinetic model, positive feedback, regulatory network motif, robustness
Introduction
Positive feedback systems are ubiquitous in biology. They play critical regulatory roles in signaling, transcription, metabolism and molecular assembly. In positive feedback systems, input signals trigger a chain of signaling or regulatory events, which loop back and amplify the system response. In biological networks they serve to transform environmental signals to all-or-none switches (Ferrell and Machleder, 1998; Xiong and Ferrell, 2003) and can slow ‘switch on’ times (Maeda and Sano, 2006) and ‘switch off’ times (Siciliano et al, 2011). In combination, fast and slow positive feedback loops can buffer against a noisy input to produce a reliable response (Brandman et al, 2005). A common feature of biological positive feedback systems is that they contain an element where two factors combinatorially (e.g. as a heterodimeric complex) regulate the expression level or activity of their targets and only one factor is upregulated by the heterodimer (Figure 1). Several examples of networks with this feature are listed in Table I; we term this network motif ASSURE for ASymmetric Self-UpREgulation. As suggested for nuclear receptors, many ASSURE motifs appear to have evolved, through gene duplications followed by specialization, from regulators that previously acted as homodimers (Laudet et al, 1992).
Figure 1.

Schematic representations of three examples the ASSURE biomolecular regulatory systems composed of asymmetric positive feedback loops. (A) Fatty acid response and peroxisome biogenesis in budding yeast; (B) Adipocyte differentiation; (C) Myogenesis. Each system leads to the production of a heterodimer, which feeds back on one arm of the network conferring self-upregulation and control of the biological response. In each case a signal (represented by a filled circle) activates a transcription factor (oval). The factor forms a heterodimer with its partner (circle) and together this complex positively feeds back (dashed arrow) and activates genes involved in the biological response (dashed arrow).
Table 1. Examples of biomolecular systems with the asymmetric positive feedback network motif.
| System | Asymmetric positive feedback | Type | References |
|---|---|---|---|
| Fatty acid response and peroxisome biogenesis in budding yeast | Fatty acid+Oaf1p↔Oaf1p*Oaf1p*+Pip2p↔heterodimer→PIP2 gene | I | (Phelps et al, 2006; Rottensteiner et al, 1997; Smith et al, 2007) |
| Adipocyte differentiation | Agonist+PPARγ↔ PPARγ*Agonist+RXRα↔RXRα*PPARγ*+RXRα(RXRα*)↔heterodimer→PPARγ gene | I/II | (Westin et al, 1998;Wakabayashi et al, 2009) |
| Cholesterol homeostasis in human macrophages | Agonist+LXRα↔LXRα*LXRα*+RXRα↔heterodimer→LXRα gene | I/II | (Whitney et al, 2001) |
| Early development and differentiation (human) | Agonist+RAR↔RAR*RAR*+RXR↔heterodimer→RAR gene | I/II | (de The et al, 1990) |
| Early development and differentiation (mice) | Agonist+RAR↔RAR*RAR*+RXR↔heterodimer→RAR gene | I/II | (Hoffmann et al, 1990; Leroy et al, 1991a; Leroy et al, 1991b) |
| Early development and differentiation (zebrafish) | Agonist+RAR↔RAR*RAR*+RXR↔heterodimer→RAR gene | I/II | (Linville et al, 2009) |
| Cellular antiviral defense | Signal+IRF3→IRF3*Signal+IRF7→IRF7*IRF3*+IRF7*↔heterodimer→IFNβ gene→IFNβ→STAT1, STAT2, IRF9→IRF7 gene | I/II | (Honda and Taniguchi, 2006; Tamura et al, 2008) |
| Myogenesis | Signal+MyoD→MyoD*MyoD*+E12↔heterodimer→MyoD gene | II | (Benayoun et al, 1998) |
| Control of the synaptic plasticity in Drosophila | Signal+Fos→Fos*Signal+Jun→Jun*Fos*+Jun*↔heterodimer→CREB geneCREB→CREB and Fos genes | I/II | (Sanyal et al, 2002; Sheng and Greenberg, 1990) |
| Filamentous growth regulation in yeast | Signal (low nitrogen, butanol, etc.)+Tec1→Tec1*Signal+Ste12→Ste12*Tec1*+Ste12*→TEC1 | I/II | (Madhani and Fink, 1997; Prinz et al, 2004; Zeitlinger et al, 2003) |
| Cell proliferation and growth | c-Myc --∣ miRNA-22 --∣ MYCBP→c-Myc+MAX→target genes | II | (Xiong et al, 2010) |
| Antioxidant response (HepG2 cells) | ROS→KEAP1-Nrf2→Nrf2→Nrf2/small Maf→p62gene→p62→Nrf2 gene | II | (Alam et al, 1999; Jain et al, 2010; Motohashi et al, 2002) |
| Response to xenobiotics: reduction of arsenic-induced cytotoxicity (HeLa cells) | iAsIII→ Nrf2 activation (KEAP1-Nrf2→Nrf2)→Nrf2/smallMaf→HO-1 gene→HO-1→Nrf2 gene | II | (Abiko et al, 2010; Alam et al, 1999; Motohashi et al, 2002) |
| White-opaque phenotypic switching in Candida albicans | Signal (loss of the mating type locus heterozygosity)→Wor1Wor1+Mcm1→WOR1 | II | (Morschhauser, 2010; Tuch et al, 2008; Zordan et al, 2007) |
| Cell cycle (G1→S phase transition) and tumor suppression control | E2F1+DP1↔E2F1/DP1E2F1/DP1+pRB↔pRB/E2F1/DP1Growth stimulatory signals→pRB/E2F1/DP1→E2F1/DP1+pRB→E2F1 gene | II | (Helin et al, 1993; Johnson et al, 1994; Krek et al, 1993) |
CREB, cAMP response element-binding; DP, differentiation regulated transcription factor protein; E2F, E2 transcription factor; HO-1, heme oxigenase-1; IRF, interferon regulatory factor; iAsIII, inorganic arsenite; KEAP, Kelch-like ECH-associated protein; LXR, liver X receptor; MAX, c-Myc-associated factor X; MCM, minichromosome maintenance; MYCBP, c-Myc-binding protein; Nrf2 (NFE2L2), Nuclear factor (erythroid-derived 2)-like 2; OAF, oleate-activated transcription factor; PIP, peroxisome induction pathway; PPAR, peroxisome proliferator-activated receptor; pRB, retinoblastoma protein; RAR, retinoic acid receptor; ROS, reactive oxygen species; RXR, retinoid X receptor; STAT, signal transducer and activator of transcription; TEC, transposon enhancement control; WOR, White-Opaque Regulator; ↔, dimerization; →, upregulation/activation; -∣, downregulation.
An additional, common feature of these network motifs is that one of the proteins of the heterodimeric regulatory complex is responsible for sensing the input signal. In such cases, there are two possible variations of the ASSURE network motif that are defined based on the direction of the feedback loop. In ASSURE I, the heterodimer upregulates the synthesis of the signal sensor partner; in ASSURE II, the heterodimer upregulates the synthesis of the signal sensor itself. The core of the fatty acid-responsive gene regulatory network in the budding yeast Saccharomyces cerevisiae is an example of ASSURE I. A heterodimer of Oaf1p and Pip2p (Phelps et al, 2006; Smith et al, 2007), is activated by the direct binding of fatty acid (oleate) to the Oaf1p ligand binding domain (Phelps et al, 2006). The active Oaf1p/Pip2p hetorodimer upregulates the expression of the PIP2 gene but not the OAF1 gene (Figure 1A) (Rottensteiner et al, 1997).
Peroxisome proliferators in mammals exemplify the ASSURE II network motif. For example, the nuclear receptors peroxisome proliferator-activated receptor γ (PPARγ) and its partner protein retinoid X receptor α (RXRα) form a heterodimer which is activated by ligand binding (e.g., certain arachidonic acid metabolites or oxidized fatty acids) to PPARγ and the active PPARγ/RXRα heterodimer upregulates the expression of the PPARγ gene (Figure 1B) (Wakabayashi et al, 2009). Another example of an ASSURE II network motif is composed of myogenic transcription factors MyoD and E12. During myogenic differentiation, MyoD is activated by Mos kinase phosphorylation and forms a heterodimer with E12, and together they upregulate the expression of the gene encoding MyoD (Figure 1C) (Benayoun et al, 1998).
Because of the prevalence and the wide range of systems in which the ASSURE network motif is found, we asked what features may be responsible for its presumed evolutionary advantages. Here, we studied both experimentally and using computational modeling, the behavior of systems controlled by the ASSURE I or II motif and systems in which both regulatory molecules in the pair are self-upregulated. We demonstrate that the asymmetry in positive feedback motifs provides the system with precise, tunable and robust control of responses to stimuli that allows the system to reliably execute its physiological program and that this motif leads to a fitness advantage.
Results
To investigate possible functional implications of the ASSURE network motif we developed mathematical models of four different biomolecular regulatory systems where the network response to a stimulus involves homo- or heterodimerization of transcription factors (Figure 2A–D). In the first system, the sensor molecule P is activated by an extracellular or an intracellular signaling species (Signal) and forms a homodimer that upregulates its targets without feedback (Figure 2A). The second system is composed of the same players, but the homodimer feeds back in a positive manner to increase the synthesis of P (symmetric positive feedback (SPF)) (Figure 2B). The remaining two systems represent versions of the ASSURE network motif (Figure 2C and D, ). In ASSURE I, the sensor molecule (P 1) is activated by the Signal and forms a heterodimer with protein (P 2), which upregulates the synthesis of P 2 and additional targets (Figure 2C). In ASSURE II, the sensor molecule (P 1) is activated by the Signal and forms a heterodimer with protein (P 2), which positively upregulates the synthesis of P 1 and additional targets (Figure 2D). Constraints associated with the general machinery of gene expression and protein synthesis are accounted for in the models by representing the fractional activity of genes using a saturation function (see Materials and Methods).
Figure 2.

Theoretical prediction of the precisely tunable and robust response of the biomolecular network with the ASSURE network motif. (A) A network where a sensor molecule P activated by an extra- or intracellular signal (Signal) forms a homodimer that upregulates its targets (a network without feedback). (B) A network where a sensor molecule P activated by Signal forms a homodimer that upregulates its own synthesis and targets (dashed arrows). (C) A network where a sensor molecule (P 1) activated by Signal forms a heterodimer with a protein (P 2) that upregulates the synthesis of P 2 and targets (ASSURE I). (D) A network where a sensor molecule (P 1) activated by Signal forms a heterodimer with a protein (P 2) that upregulates the synthesis of P 1 and targets (ASSURE II). (E) Stimulus applied to each system. (F) Responses of each system to the stimulus. Responses of ASSURE I and II are equal when Signal>>P 1 and/or the dissociation constant K sp is low, indicating the high affinity between Signal and P 1. (G) Color coded variation of initial P 1 level in the ASSURE I system (inset) and corresponding responses of each system to the stimulus. (H) Effect of K d (the dissociation constant of homo- and heterodimerization) variation on the symmetric positive feedback and the ASSURE system responses to the stimulus. The difference between the low and high K d is five orders of magnitude (low K d =10−5 a.u. and high K d =1 a.u.) (see also Supplementary Figures 2 and 3). (I) Response time (τ0.5) probability density for the SPF and ASSURE models, respectively, calculated based on the model responses with 10 000 random parameter sets (Supplementary Table 1; Supplementary Figure 9).
To investigate the effects of network topology on network function, models describing the four network classes were compared in a mathematically controlled fashion, i.e., using equivalent parameters save for the specific parameter encoding the difference in model topology (Henceforth, in the mathematical models, we will use a species’s symbol (e.g., Signal) to represent its concentration.). Model simulations revealed that the kinetic characteristics of the responses from ASSURE I and ASSURE II network motifs are identical under typical physiological conditions (i.e. when Signal >>P 1 and/or the dissociation constant for binding of P 1 by Signal (K sp) is low (indicating a high affinity)) (Figures 2E and F). This assumption is based on the fact that activating ligands are typically in higher abundance than their targets (e.g., protein receptors) and affinities between ligands and receptors are also typically high (e.g., K d for oleate binding to Oaf1p is 1.65 × 10⁻⁸ M (Phelps et al, 2006); K d for nitrolinoleic acid binding to PPARγ is 1.33 × 10⁻⁷ M (Schopfer et al, 2005); K d for 22(R)-hydroxycholesterol binding to LXRα and is 2.5 × 10⁻⁷ M (Bramlett et al, 2003)). In simulations where the ligand concentration is low (Signal<<P 1) and/or the affinity between the ligand and the sensor is low (high K sp) the responses of ASSURE I and ASSURE II are distinct; ASSURE I is more responsive due to the relatively high concentration of the sensor protein P 1 (Supplementary Figure 1).
Model simulations revealed several characteristics of the ASSURE network motif that would be expected to confer advantages over other motifs. The ASSURE motif has properties typical of other positive feedback networks (including symmetric positive feedback motifs), which confer sigmoidal all-or-none like responses to stimuli. The ASSURE motif is also tunable, like the motif with no feedback; the maximum level of the response is dictated by the abundance of one partner of the heterodimeric pair (i.e., the protein that is not subject to positive feedback, P 1 in ASSURE I and P 2 in ASSURE II) (Figures 2F and G; Supplementary Figure 2). In addition, in the ASSURE motifs, the member of the heterodimer that is not subject to positive feedback is assumed to be at higher constitutive levels than the inducible partner. This ‘ready state’ efficiently shifts the equilibrium for the reaction pair P 1+P 2⇔P 1P 2 toward the formation of heterodimer, increasing the responsiveness of the ASSURE network compared to the SPF network. The network controlled by the ASSURE motif therefore responds more rapidly and reaches a plateau earlier than a network controlled by symmetric positive feedback.
To address whether the ASSURE system response time (τ0.5) would be robust to changes in the partner interaction strength, we investigated the response in the context of changes to the dissociation constant (K d) of the heterodimer formed between P 1 and P 2. A wide range of K d values have little effect on the response of the systems with the asymmetric positive feedback. By contrast, the response of the symmetric positive feedback motif is sensitive to changes in K d (Figure 2H; Supplementary Figures 3 and 4). In addition, the sensitivity of the ASSURE response time to changes in the affinity of dimerization is not significantly altered by changes in the number of molecules of the heterodimerizing partner (whose expression is not upregulated) (Supplementary Figure 5). In the ASSURE network, the lower sensitivity of the response time with respect to changes in K d is likely due to the imbalance in the abundance of P 1 and P 2. The ‘ready state’ ensures that the system can operate efficiently at lower affinity between P 1 and P 2, facilitating evolvability.
Exploration of the effects of changing multiple model parameters on the temporal responses of the SPF and ASSURE models revealed the same pattern of robust responses in the ASSURE system (Supplementary Figures 6 and 7). Interestingly, for some parameter sets, the SPF model does not respond to the stimulus whereas the ASSURE model for the same parameter sets readily responds (see the high K d values in Supplementary Figures 6, 7 and 8).
We next investigated, in the context of a model of evolutionary variations to pathway kinetic parameters, whether there is a difference between the ASSURE and SPF networks in terms of the frequencies with which network perturbations would lead to substantially slower network induction or inability to induce. Across randomly parameterized SPF and ASSURE models, the distribution of response times of the ASSURE model is significantly different (P<10−4) than the distribution of response times of the SPF model, with the ASSURE model’s τ0.5 distribution having a much smaller right tail (Figure 2I; Supplementary Figures 9A and B; Supplementary Table 1). Thus, randomly parameterized SPF networks were more likely to be slow at inducing (τ0.5>15 min) than were ASSURE networks. The coefficient of variation of the ASSURE τ0.5 distribution was 21.4% lower than the coefficient of variation of the SPF τ0.5 distribution. Furthermore, across random parameterizations, the frequency with which the SPF model failed to respond was higher than for the ASSURE model (Supplementary Figure 9C).
Next, to gain insight into the ‘evolvability’ of the motifs, we studied how random single parameter changes would affect the response times for the SPF and ASSURE models with randomly generated parameter sets. For each model class, an ensemble of models was generated by randomly generating vectors of parameter values (Supplementary Table 1), and the response time of each model in the ensemble was calculated. Then, for each model, a single parameter, selected at random, was perturbed by a random amount, to simulate a single evolutionary change, and the resulting change Δτ0.5 was calculated. This analysis revealed that the distribution of the Δτ0.5 values for the SPF model class had a markedly longer tail than the distribution for the ASSURE model class (P<10−4), indicating that the response times of models of the ASSURE class are, overall, less affected by single parameter perturbations than models of the SPF class (Supplementary Figure 10A). Moreover, single-parameter perturbations in models of the SPF class were more likely to cause a failure to respond, than were single-parameter perturbations in models of the ASSURE class (Supplementary Figure 10B).
Steady-state bifurcation analysis of the SPF and ASSURE models revealed that both models have parameter ranges in which they have bistable responses (which would correspond to heterogeneous responses across a cell population (Acar et al, 2005)); however, the ASSURE system shows bistability over a significantly smaller range of k a and K d parameter values compared to the SPF model (Supplementary Figure 11). This property of the ASSURE system may be indicative of additional advantages for this motif, namely, preserving the system’s monostability and controllability, over a wide range of heterodimer affinities (K d) and activities (k a) that are subject to change during evolution.
To experimentally validate the ASSURE network motif role, we compared the responses of a wild-type (WT) ASSURE I network (Figure 3A) and an engineered version that mimics the symmetric feedback network (Figure 3B and Supplementary Figure 12). The WT ASSURE I network forms the core of the fatty acid-responsive gene regulatory network in S. cerevisiae. A heterodimer of Oaf1p/Pip2p, is activated by the direct binding of oleate to the Oaf1p ligand binding domain and the activated Oaf1p/Pip2p heterodimer upregulates the expression of the PIP2 gene (Rottensteiner et al, 1997). In the engineered strain the OAF1 gene is placed under control of the PIP2 promoter so that it is also positively upregulated by the activated Oaf1p/Pip2p heterodimer, forming a ‘symmetric’ positive feedback loop (Figures 3B and C). The symmetric positive feedback type I (SPF I) model, the analog of the engineered experimental system, reproduces exactly the SPF model when the degradation rates are equal (k uP1=k uP2). While the kinetics of the SPF I model change relative to the SPF model when k uP1≠k uP2, the characteristics of the response remain the same (Supplementary Figure 12). Thus, in these models homo- and heterodimers can be treated equivalently within a set of given parameters. Oaf1p half-life is 55 min (Beyer et al, 2004) slightly more than that of Pip2p (40 min) (Belle et al, 2007). This difference in protein degradation is compensated for by the opposite differences in the half-lives of corresponding mRNAs (15 min for OAF1 mRNA and 22 min for PIP2 mRNA (Holstege et al, 1998)). The comparable levels of Oaf1p and Pip2p make the engineered strain a reasonable system to explore the symmetric feedback network.
Figure 3.
Experimental validation of the ASSURE network motif role. (A) Wild-type Oaf1p-Pip2p ASSURE network motif. (B) Engineered strain where the OAF1 gene is under control of the PIP2 promoter. (C) Oaf1p under the control of the PIP2 promoter is induced in response to oleate incubation. Samples were grown in YPB low glucose (0.15%) over a 6 h time course. Those samples to which 0.2% oleate was added show an increase in the amount of Oaf1p-myc detected by Western blot analysis relative to the uninduced sample. Gsp1p is used as a load control. (D) Response of the wild-type (diamonds) and engineered (dashes) budding yeast cells to oleate induction. The time course of Pot1p protein level was measured in individual cells using flow cytometry in the wild-type strain with a Pot1p-GFP reporter and in the engineered strain with the same reporter under oleate growth conditions. Error bars represent standard error of means of Pot1p-GFP protein level from six independent replicates. (E) The presence of the ASSURE network motif enables a competitive fitness advantage. Cells from wild type and engineered strains were mixed 1:1 and grown under time varying oleate and glucose conditions. At the indicated times cells were transferred between YPBO (0.2% oleate) and YPBD (0.15% glucose). At 24, 48 and 72 h, multiple replicates of equal volumes of dilutions were plated onto YPD and YPD with 400 ug/ml Hygromycin B (Sigma) medium, to select for the engineered strain (see Material and Methods). Source data is available for this figure in the Supplementary Information.

The oleate response of the WT and engineered strains was measured at the protein level using flow cytometry, replicated 6 times over a matrix of varying conditions (Figure 3D and Supplementary Figure 13). Despite the potential for additional control mechanisms operating in the context of the larger cellular network, for example the differences in response times between the early log phase and mid/late log phase cultures (Supplementary Figure 13), the in vivo responses measured here mirrored the predictions from the model simulations discussed above. While both the ASSURE I and engineered ‘symmetric’ feedback motifs yielded switch-like responses, the ASSURE I motif yielded a response that was more rapid (τ0.2∼3 h) and controlled, whereas the engineered motif led to a slower response (τ0.2∼8 h) and to the overproduction of the target protein (Figure 3D).
To address the role of the ASSURE motif in the context of a cellular phenotype we hypothesized that the altered kinetics of the transcriptional response would result in a decreased competitive advantage of the engineered strain. To test this hypothesis we performed fitness assays in which the wild type and engineered strains were co-cultured in conditions that alternated between oleate and glucose carbon sources (Figure 3E). An advantage of this experimental design is that it is internally controlled; both strains are co-subjected to the same experimental conditions (see Materials and Methods). The engineered strain was specifically disadvantaged under oleate growth conditions compared to the wild type strain (Figure 3E) while under glucose growth conditions no fitness disadvantage for the engineered strain was observed (Supplementary Figure 14). In an environment that is switching back and forth between oleic acid as the sole carbon source and glucose as sole carbon source, the organism has to repeatedly activate the peroxisome biogenesis gene regulatory network and induce peroxisomes. We interpret these data to indicate that the kinetics of the response conferred by the ASSURE motif endow the system with a fitness advantage, contributing to its use and evolutionary persistence in a wide range of organisms and regulatory networks.
Discussion
Here, we theoretically and experimentally investigated dynamical properties of the highly prevalent ASSURE network motif, which lies at the heart of numerous networks controlling many essential biological functions. In the ASSURE motif, a heterodimer forms in response to a signal to regulate the activity of downstream targets; one component of the heterodimer acts as a sensor of the signal, and one (and only one) component is also the target of feedback regulation by the heterodimer itself. This motif confers numerous fundamental properties including precise, tunable and robust control of responses to environmental stimuli and is central to many different biological processes (Table I). It seems likely that this is because of the properties we have exposed here. For example, RAR binding to retinoic acid induces formation of the nuclear receptor RAR/RXR heterodimer, which in turn regulates numerous aspects of vertebrate morphogenesis, growth, cellular differentiation, and tissue homeostasis (Mark et al, 2006). The regulatory circuit is predicted to be robust and controlled, ensuring the appropriate execution of developmental programs.
In the immune system, the host innate response is often considered a double-edged sword (Kobayashi and Flavell, 2004; Liew et al, 2005). A rapid host defense against harmful pathogens is essential, but at the same time, if the immune response is unregulated, the overproduction of proinflammatory cytokines may result in inflammation-associated sequelae (Kobayashi and Flavell, 2004). IRF3 and IRF7 are central regulators of certain chemokine genes and type I interferon (INF) genes that are essential for host antiviral response (Janeway and Medzhitov, 2002; Tamura et al, 2008); IRF3 and IRF7 form an ASSURE motif. IRF3 levels are constitutive, whereas IRF7 is expressed at a low level under normal conditions (Honda and Taniguchi, 2006; Tamura et al, 2008). When activated, an IRF3/IRF7 heterodimer forms leading to the upregulation of the type I interferons IFN-α and IFN-β, triggering a positive-feedback upregulation of IRF7, which in turn leads to the full induction of type I IFN genes during the host antiviral response (Tamura et al, 2008). While in this case the activation occurs through phosphorylation, and feedback on IRF7 occurs indirectly by interferons, the essential features of the motif remain. The system response is predicted to be reliably controlled, which is critical for balanced yet rapid, antiviral and inflammatory responses.
Importantly, the ASSURE network motif ‘buffers against’ variations in the affinity between partners in the heterodimer. This buffering feature of the motif can enable the evolution of new activities and partners through gene duplication. In principle both proteins of a heterodimer in the ASSURE network motif can bind ligands, which could, in turn, alter the affinity of the heterodimer. For example, PPAR/RXR heterodimers can be activated by PPAR or RXR ligands (Westin et al, 1998) and even if different ligands alter the K d of the heterodimer (Yue et al, 2005) the ASSURE network behavior would remain essentially unchanged.
On the other hand, the control and robustness of the ASSURE system are highly sensitive to the abundance of the protein that is not subject to feedback upregulation, with increased abundance leading to stronger responses. From an evolutionary standpoint there are many factors that can operate to control levels of the constitutive protein (synthesis, turnover, localization etc.). We expect that these factors contribute in combination to control and buffer systems that contain the ASSURE network motif. Indeed in our experimental exploration of induction parameters by flow cytometry (Supplementary Figure 13), we identified conditions that change the response types within the predicted range of profiles (Figure 3 and Supplementary Figures 12). In addition, the ASSURE network motif properties discovered here are applicable to any combinatorial up or down regulatory event where two or more factors are involved, including cofactors/coactivators, and at least one component is not subject to feedback, but feedback is dependent on that component.
Investigation of the ASSURE network in the model system of yeast responding to oleate demonstrated that this network contributes to a fitness advantage, which at least partially explains its prevalence and reuse in many biological systems. Comparing the dynamics of transcription from the natural ASSURE network and the engineered SPF validated the predictions made from in silico studies. Specifically, a key difference between these motifs is the response times upon induction with oleate. These altered transcriptional rates likely result in a fitness disadvantage through a multitude of downstream effects such as delayed organelle biogenesis, potential increases in reactive oxygen species at early time points or a potential increase in the translational burden at later time points. Accordingly, delayed expression of targets of Oaf1p and Pip2p, conferred by, for example deletion of the histone variant Htz1 (Wan et al, 2009; Saleem et al, 2010) leads to a delay in biogenesis and reduced viability in oleate conditions (Smith et al, 2006; Lockshon et al, 2007). Another key difference between these motifs is the ability to control the level of the response. More of the reporter protein, Pot1p-GFP, was observed in the engineered strain at later stages of induction, which may also underlie the oleate specific competitive disadvantage of this strain. Regardless, the relative poor performance of cells in which the ASSURE network has been replaced is founded in differences in transcription, with the ASSURE motif contributing to fast response times and constraining the level of the system response.
Understanding the dynamical properties of the ASSURE network motif also has value in rational drug design and development of optimal treatment procedures. For example, PPARγ, a nuclear receptor which forms an ASSURE network motif in combination with RXR, has been implicated in the pathology of numerous diseases including atherosclerosis, diabetes and cancer and is a prominent and widely studied drug target (Varga and Nagy, 2008). We predict, based on this study, that PPARγ/RXR-based responses would be relatively insensitive to drug concentration differences, and as concentrations of a drug or other xenobiotics increase, the core PPARγ/RXR-based response would be similar. In addition, we expect that the core PPARγ/RXR-based response would be tolerant to the introduction of a drug that affects the affinity between PPARγ and RXR.
The persistence of the ASSURE network motif through evolution and its central role in many diverse regulatory systems are evidence of the advantages conferred by the dynamical features we describe here. Moreover, as biological regulatory systems are increasingly harnessed in synthetic biology applications, the precise control and robustness of the ASSURE network motif make it an attractive tool for synthetic molecular regulatory systems with predetermined and tunable functions.
Materials and methods
Strain construction
An engineered cassette consisting of the HPH gene amplified from the pFA6a-hphNT1 (Janke et al, 2004), and a 500 bp region upstream from the start of the PIP2 ORF, which herein is described as the PIP2 promoter, was constructed by assembly PCR (Supplementary Table 2). This cassette contained 40 bp of homology facilitating integration of the construct into the OAF1 5′ UTR and OAF1 ORF. Correct integration of the engineered promoter was confirmed by both diagnostic PCR and DNA sequencing.
Positive clones containing the OAF1 ORF under the control of the PIP2 promoter were then transformed with a PCR cassette which incorporates GFP at the 3′ end of the oleate responsive gene POT1. The functionality of this construct was tested by inducing the cells with oleate and observing the GFP signal by flow cytometry and the localization of Pot1p-GFP to peroxisomes by fluorescence microscopy. Construction of the wild-type Pot1p-GFP strain was described previously (Saleem et al, 2008). The wild type and engineered strains are genetically identical, with the exception of the insertion of the PIP2 promoter at the 5′ end of the OAF1 ORF (and an HPH drug resistance gene upstream of the ectopic PIP2 promoter) in the engineered strain, which generates the SPF I topology (Supplementary Figure 12) with respect to the oleate responsive transcription factors, Oaf1p and Pip2p.
OAF1 was genomically tagged by homologous recombination, using an integration cassette with OAF1 3′ ORF and 3′ UTR homology (Supplementary Table 2), amplified from the pFA6-13MYC plasmid (Wan et al, 2009). Correct integration of the myc tag was confirmed by both diagnostic PCR and DNA sequencing.
Cell culture, protein extraction and western blot analysis
Cells were grown overnight in YPBD (0.3% yeast extract, 0.5% peptone, 0.5% potassium phosphate buffer, pH 6.0, 2% glucose) to an OD600 of approximately 1.0. For protein extractions, cells were transferred to YPB-low glucose (0.15%) and either grown in YPB-low glucose (0.15%) only or induced with 0.2% oleate, 0.5% Tween 40. Samples were collected at the indicated times (Figure 3C), the media removed and the cells resuspended in a lysis solution of 264 mM NaOH, 152 mM 2-mercaptoethanol. After a 10 min incubation on ice, tricholoracetic acid was added to a final concentration of 6% and proteins precipitated for 10 additional minutes on ice. Precipitated proteins were pelleted by centrifugation and resuspended in a solution of 6.5% SDS, 0.5 M Tris base and 15% glycerol. The samples were heated at 95 °C and proteins resolved on 4–12% gradient gels. Myc-tagged Oaf1p was detected by western blot analysis using an anti c-Myc 9E10 mouse monoclonal antibody (Abcam). An anti Gsp1p rabbit polyclonal antibody was used to detect Gsp1p as a load control.
Flow cytometry
Six replicates of each strain were assayed over a matrix of experimental conditions, varying pre-culture conditions (2% glucose or 0.15% glucose), cell densities (OD600 of 0.4, 0.8, or 1.6) and oleate concentrations (0.2% or 1%) (Supplementary Figure 13). At the indicated time points (Figure 3D and Supplementary Figure 13), 20 μl of induced cells were added to 100 μl of dH2O in a 96-well flat-bottomed plate and analyzed by flow cytometry for total GFP fluorescence. Flow cytometry was done using a FACSCalibur (BD Biosciences) with the following parameters: forward scatter, E0 haploid linear scale; side scatter, 520 V linear scale; fluorescence, 490 V logarithmic scale. Cells were loaded onto the FACSCalibur using the high throughput sampler (BD Biosciences). The high throughput sampler was run in standard mode, sampling 10 μl at a rate of 2 μl/s for a total event count of 10 000 cells.
Competition assay
The competitive fitness of the wild type versus the engineered strains was investigated under time varying oleate and glucose conditions. Cells from wild type and engineered strains were mixed 1:1 and grown in YPD to an OD600 of approximately 0.5. At the times indicated in Figure 3E, cells were transferred between YPBO and YPBD (0.15% glucose). At 0, 24, 48 and 72 h, the cultures were sampled and then reseeded at 1:5 to ensure they did not reach saturation. For sampling, 10 technical and two biological replicates of equal volumes of dilutions were plated onto YPD, which is nonselective and allows both strains to grow equally, and YPD with 400 ug/ml Hygromycin B (HPH; Sigma) medium, to select for the engineered strain. Under conditions in which the engineered strain showed no advantage or disadvantage the expected number of colonies on the YPD-HPH plate would be half of the number of colonies on the YPD plate.
Mathematical modeling
The ordinary differential equations for the ‘No feedback’, symmetric and asymmetric feedback systems are as follows:
‘No feedback’ model:
 |
SPF model:
 |
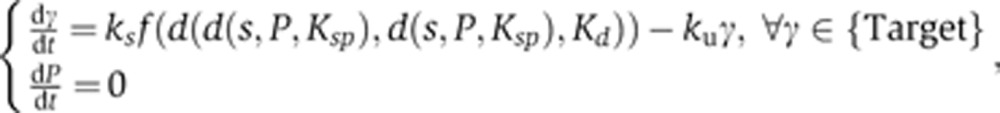
ASSURE I model:
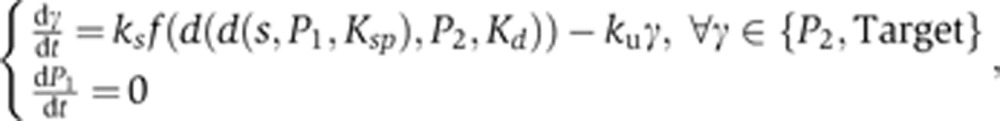 |
ASSURE II model:
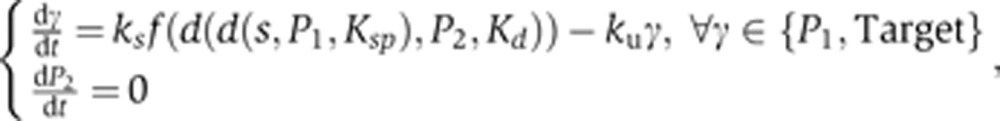 |
SPF I model (see Supplementary Figure 12):
 |
where d(x, y, K) represents the quasi-steady-state concentration of the heterodimer between x and y with the dissociation constant K calculated using the following equation:
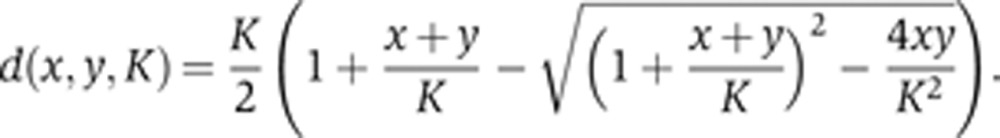 |
d(x, y, K) is a solution of the quadratic equation (x−d) (y−d) = Kd that is derived from the steady-state assumption for the reversible biomolecular reaction  . In the case of a homodimer, x=y.
f(z) represents a fractional activity of the target gene which is a function of the activator z. f(z) is calculated using the following equation:
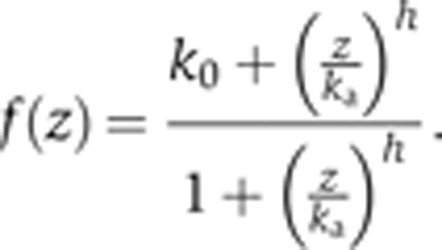 |
For example, f(d(d(s,P 1,K sp),P 2,K d)) represents the fractional activity of the ASSURE target gene that is a function of the concentration of the heterodimer between P 2 and another heterodimer between s and P 1 in the model with K d and K sp dissociation constants, respectively.
Parameter values for results presented in Figure 2 are following: k s=10 min−1, k u=0.1 min−1, k 0=0.1, k a=40 a.u., h=2, K sp=10−3 a.u., K d=10−5 a.u., s=103 a.u. The unregulated component of the heterodimer (P 1 in ASSURE I and P 2 in ASSURE II) is set to a corresponding constant value. The Equations were solved numerically with Matlab 7.9.0. The models are available in SBML format at BioModels database (http://www.ebi.ac.uk/biomodels-main/) (SPF ID: MODEL1203010000; ASSURE I ID: MODEL1203010001; ASSURE II ID: MODEL1203010002; ‘No Feedback’ ID: MODEL1203010003; SPF I ID: MODEL1203010004).
Computational analysis
The response time (τx) was calculated as the time that the system takes to reach x portion of its response between the initial and steady-state levels. A P-value for the comparison of the distributions of τ0.5 values for the SPF and ASSURE models in Figure 2I was calculated based on the two-sample Kolmogorov-Smirnov test using the kstest2 MATLAB routine. The response time probability density in Figure 2I was estimated using the ksdensity MATLAB routine.
Supplementary Material
Acknowledgments
We thank J Smith, V Litvak and I Shmulevich for helpful discussions and comments on the manuscript. This study was supported by NIH/NIGMS (R01-GM075152, U54-2U54RR022220 and P50-GM076547).
Author contributions: AVR and JDA designed the research. AVR developed mathematical models and performed numerical simulations. AVR and SAR performed theoretical and computational analysis. RAS and KS built the engineered strain and performed experiments. AVR, RAS, SAR and JDA wrote the manuscript.
References
- Abiko Y, Shinkai Y, Sumi D, Kumagai Y (2010) Reduction of arsenic-induced cytotoxicity through Nrf2/HO-1 signaling in HepG2 cells. J Toxicol Sci 35: 419–423 [DOI] [PubMed] [Google Scholar]
- Acar M, Becskei A, van Oudenaarden A (2005) Enhancement of cellular memory by reducing stochastic transitions. Nature 435: 228–232 [DOI] [PubMed] [Google Scholar]
- Alam J, Stewart D, Touchard C, Boinapally S, Choi AM, Cook JL (1999) Nrf2, a Cap'n'Collar transcription factor, regulates induction of the heme oxygenase-1 gene. J Biol Chem 274: 26071–26078 [DOI] [PubMed] [Google Scholar]
- Belle A, Tanay A, Bitincka L, Shamir R, O'Shea EK (2007) Quantification of protein half-lives in the budding yeast proteome. Proc Natl Acad Sci USA 103: 13004–13009 [DOI] [PMC free article] [PubMed] [Google Scholar]
- Benayoun B, Pelpel K, Solhonne B, Guillier M, Leibovitch SA (1998) Overexpression of Mos(rat) proto-oncogene product enhances the positive autoregulatory loop of MyoD. FEBS Lett 437: 39–43 [DOI] [PubMed] [Google Scholar]
- Beyer A, Hollunder J, Nasheuer H-P, Wilhelm T (2004) Post-transcriptional expression regulation in the yeast Saccharomyces cerevisiae on a genomic scale. Mol Cell Proteomics 3: 1083–1092 [DOI] [PubMed] [Google Scholar]
- Bramlett KS, Houck KA, Borchert KM, Dowless MS, Kulanthaivel P, Zhang Y, Beyer TP, Schmidt R, Thomas JS, Michael LF, Barr R, Montrose C, Eacho PI, Cao G, Burris TP (2003) A natural product ligand of the oxysterol receptor, liver X receptor. J Pharmacol Exp Ther 307: 291–296 [DOI] [PubMed] [Google Scholar]
- Brandman O, Ferrell JE Jr, Li R, Meyer T (2005) Interlinked fast and slow positive feedback loops drive reliable cell decisions. Science 310: 496–498 [DOI] [PMC free article] [PubMed] [Google Scholar]
- de The H, Vivanco-Ruiz MM, Tiollais P, Stunnenberg H, Dejean A (1990) Identification of a retinoic acid responsive element in the retinoic acid receptor beta gene. Nature 343: 177–180 [DOI] [PubMed] [Google Scholar]
- Ferrell JE Jr, Machleder EM (1998) The biochemical basis of an all-or-none cell fate switch in Xenopus oocytes. Science 280: 895–898 [DOI] [PubMed] [Google Scholar]
- Helin K, Wu CL, Fattaey AR, Lees JA, Dynlacht BD, Ngwu C, Harlow E (1993) Heterodimerization of the transcription factors E2F-1 and DP-1 leads to cooperative trans-activation. Genes Dev 7: 1850–1861 [DOI] [PubMed] [Google Scholar]
- Hoffmann B, Lehmann JM, Zhang XK, Hermann T, Husmann M, Graupner G, Pfahl M (1990) A retinoic acid receptor-specific element controls the retinoic acid receptor-beta promoter. Mol Endocrinol 4: 1727–1736 [DOI] [PubMed] [Google Scholar]
- Holstege FCP, Jennings EG, Wyrick JJ, Lee TI, Hengartner CJ, Green MR, Golub TR, Lander ES, Young RA (1998) Dissecting the regulatory circuitry of a eukaryotic genome. Cell 95: 717–728 [DOI] [PubMed] [Google Scholar]
- Honda K, Taniguchi T (2006) IRFs: master regulators of signalling by Toll-like receptors and cytosolic pattern-recognition receptors. Nat Rev Immunol 6: 644–658 [DOI] [PubMed] [Google Scholar]
- Jain A, Lamark T, Sjottem E, Larsen KB, Awuh JA, Overvatn A, McMahon M, Hayes JD, Johansen T (2010) p62/SQSTM1 is a target gene for transcription factor NRF2 and creates a positive feedback loop by inducing antioxidant response element-driven gene transcription. J Biol Chem 285: 22576–22591 [DOI] [PMC free article] [PubMed] [Google Scholar]
- Janeway CA Jr, Medzhitov R (2002) Innate immune recognition. Annu Rev Immunol 20: 197–216 [DOI] [PubMed] [Google Scholar]
- Janke C, Magiera MM, Rathfelder N, Taxis C, Reber S, Maekawa H, Moreno-Borchart A, Doenges G, Schwob E, Schiebel E, Knop M (2004) A versatile toolbox for PCR-based tagging of yeast genes: new fluorescent proteins, more markers and promoter substitution cassettes. Yeast 21: 947–962 [DOI] [PubMed] [Google Scholar]
- Johnson DG, Ohtani K, Nevins JR (1994) Autoregulatory control of E2F1 expression in response to positive and negative regulators of cell cycle progression. Genes Dev 8: 1514–1525 [DOI] [PubMed] [Google Scholar]
- Kobayashi KS, Flavell RA (2004) Shielding the double-edged sword: negative regulation of the innate immune system. J Leukoc Biol 75: 428–433 [DOI] [PubMed] [Google Scholar]
- Krek W, Livingston DM, Shirodkar S (1993) Binding to DNA and the retinoblastoma gene product promoted by complex formation of different E2F family members. Science 262: 1557–1560 [DOI] [PubMed] [Google Scholar]
- Laudet V, Hanni C, Coll J, Catzeflis F, Stehelin D (1992) Evolution of the nuclear receptor gene superfamily. EMBO J 11: 1003–1013 [DOI] [PMC free article] [PubMed] [Google Scholar]
- Leroy P, Krust A, Zelent A, Mendelsohn C, Garnier JM, Kastner P, Dierich A, Chambon P (1991a) Multiple isoforms of the mouse retinoic acid receptor alpha are generated by alternative splicing and differential induction by retinoic acid. EMBO J 10: 59–69 [DOI] [PMC free article] [PubMed] [Google Scholar]
- Leroy P, Nakshatri H, Chambon P (1991b) Mouse retinoic acid receptor alpha 2 isoform is transcribed from a promoter that contains a retinoic acid response element. Proc Natl Acad Sci USA 88: 10138–10142 [DOI] [PMC free article] [PubMed] [Google Scholar]
- Liew FY, Xu D, Brint EK, O'Neill LA (2005) Negative regulation of toll-like receptor-mediated immune responses. Nat Rev Immunol 5: 446–458 [DOI] [PubMed] [Google Scholar]
- Linville A, Radtke K, Waxman JS, Yelon D, Schilling TF (2009) Combinatorial roles for zebrafish retinoic acid receptors in the hindbrain, limbs and pharyngeal arches. Dev Biol 325: 60–70 [DOI] [PMC free article] [PubMed] [Google Scholar]
- Lockshon D, Surface LE, Kerr EO, Kaeberlein M, Kennedy BK (2007) The sensitivity of yeast mutants to oleic acid implicates the peroxisome and other processes in membrane function. Genetics 175: 77–91 [DOI] [PMC free article] [PubMed] [Google Scholar]
- Madhani HD, Fink GR (1997) Combinatorial control required for the specificity of yeast MAPK signaling. Science 275: 1314–1317 [DOI] [PubMed] [Google Scholar]
- Maeda YT, Sano M (2006) Regulatory dynamics of synthetic gene networks with positive feedback. J Mol Biol 359: 1107–1124 [DOI] [PubMed] [Google Scholar]
- Mark M, Ghyselinck NB, Chambon P (2006) Function of retinoid nuclear receptors: lessons from genetic and pharmacological dissections of the retinoic acid signaling pathway during mouse embryogenesis. Annu Rev Pharmacol Toxicol 46: 451–480 [DOI] [PubMed] [Google Scholar]
- Morschhauser J (2010) Regulation of white-opaque switching in Candida albicans. Med Microbiol Immunol 199: 165–172 [DOI] [PubMed] [Google Scholar]
- Motohashi H, O'Connor T, Katsuoka F, Engel JD, Yamamoto M (2002) Integration and diversity of the regulatory network composed of Maf and CNC families of transcription factors. Gene 294: 1–12 [DOI] [PubMed] [Google Scholar]
- Phelps C, Gburcik V, Suslova E, Dudek P, Forafonov F, Bot N, MacLean M, Fagan RJ, Picard D (2006) Fungi and animals may share a common ancestor to nuclear receptors. Proc Natl Acad Sci USA 103: 7077–7081 [DOI] [PMC free article] [PubMed] [Google Scholar]
- Prinz S, Avila-Campillo I, Aldridge C, Srinivasan A, Dimitrov K, Siegel AF, Galitski T (2004) Control of yeast filamentous-form growth by modules in an integrated molecular network. Genome Res 14: 380–390 [DOI] [PMC free article] [PubMed] [Google Scholar]
- Rottensteiner H, Kal AJ, Hamilton B, Ruis H, Tabak HF (1997) A heterodimer of the Zn2Cys6 transcription factors Pip2p and Oaf1p controls induction of genes encoding peroxisomal proteins in Saccharomyces cerevisiae. Eur J Biochem 247: 776–783 [DOI] [PubMed] [Google Scholar]
- Saleem RA, Knoblach B, Mast FD, Smith JJ, Boyle J, Dobson CM, Long-O'Donnell R, Rachubinski RA, Aitchison JD (2008) Genome-wide analysis of signaling networks regulating fatty acid-induced gene expression and organelle biogenesis. J Cell Biol 181: 281–292 [DOI] [PMC free article] [PubMed] [Google Scholar]
- Saleem RA, Long-O'Donnell R, Dilworth DJ, Armstrong AM, Jamakhandi AP, Wan Y, Knijnenburg TA, Niemisto A, Boyle J, Rachubinski RA, Shmulevich I, Aitchison JD (2010) Genome-wide analysis of effectors of peroxisome biogenesis. PLoS One 5: e11953. [DOI] [PMC free article] [PubMed] [Google Scholar]
- Sanyal S, Sandstrom DJ, Hoeffer CA, Ramaswami M (2002) AP-1 functions upstream of CREB to control synaptic plasticity in Drosophila. Nature 416: 870–874 [DOI] [PubMed] [Google Scholar]
- Schopfer FJ, Lin Y, Baker PR, Cui T, Garcia-Barrio M, Zhang J, Chen K, Chen YE, Freeman BA (2005) Nitrolinoleic acid: an endogenous peroxisome proliferator-activated receptor gamma ligand. Proc Natl Acad Sci USA 102: 2340–2345 [DOI] [PMC free article] [PubMed] [Google Scholar]
- Sheng M, Greenberg ME (1990) The regulation and function of c-fos and other immediate early genes in the nervous system. Neuron 4: 477–485 [DOI] [PubMed] [Google Scholar]
- Siciliano V, Menolascina F, Marucci L, Fracassi C, Garzilli I, Moretti MN, di Bernardo D (2011) Construction and modelling of an inducible positive feedback loop stably integrated in a mammalian cell-line. PLoS Comput Biol 7: e1002074. [DOI] [PMC free article] [PubMed] [Google Scholar]
- Smith JJ, Ramsey SA, Marelli M, Marzolf B, Hwang D, Saleem RA, Rachubinski RA, Aitchison JD (2007) Transcriptional responses to fatty acid are coordinated by combinatorial control. Mol Syst Biol 3: 115; DOI: 10.1038/msb4100157 [DOI] [PMC free article] [PubMed] [Google Scholar]
- Smith JJ, Sydorskyy Y, Marelli M, Hwang D, Bolouri H, Rachubinski RA, Aitchison JD (2006) Expression and functional profiling reveal distinct gene classes involved in fatty acid metabolism. Mol Syst Biol 2: 2006.0009; DOI: 10.1038/msb4100051 [DOI] [PMC free article] [PubMed] [Google Scholar]
- Tamura T, Yanai H, Savitsky D, Taniguchi T (2008) The IRF family transcription factors in immunity and oncogenesis. Annu Rev Immunol 26: 535–584 [DOI] [PubMed] [Google Scholar]
- Tuch BB, Galgoczy DJ, Hernday AD, Li H, Johnson AD (2008) The evolution of combinatorial gene regulation in fungi. PLoS Biol 6: e38. [DOI] [PMC free article] [PubMed] [Google Scholar]
- Varga T, Nagy L (2008) Nuclear receptors, transcription factors linking lipid metabolism and immunity: the case of peroxisome proliferator-activated receptor gamma. Eur J Clin Invest 38: 695–707 [DOI] [PubMed] [Google Scholar]
- Wakabayashi K, Okamura M, Tsutsumi S, Nishikawa NS, Tanaka T, Sakakibara I, Kitakami J, Ihara S, Hashimoto Y, Hamakubo T, Kodama T, Aburatani H, Sakai J (2009) The peroxisome proliferator-activated receptor gamma/retinoid X receptor alpha heterodimer targets the histone modification enzyme PR-Set7/Setd8 gene and regulates adipogenesis through a positive feedback loop. Mol Cell Biol 29: 3544–3555 [DOI] [PMC free article] [PubMed] [Google Scholar]
- Wan Y, Saleem RA, Ratushny AV, Roda O, Smith JJ, Lin CH, Chiang JH, Aitchison JD (2009) Role of the histone variant H2A.Z/Htz1p in TBP recruitment, chromatin dynamics, and regulated expression of oleate-responsive genes. Mol Cell Biol 29: 2346–2358 [DOI] [PMC free article] [PubMed] [Google Scholar]
- Westin S, Kurokawa R, Nolte RT, Wisely GB, McInerney EM, Rose DW, Milburn MV, Rosenfeld MG, Glass CK (1998) Interactions controlling the assembly of nuclear-receptor heterodimers and co-activators. Nature 395: 199–202 [DOI] [PubMed] [Google Scholar]
- Whitney KD, Watson MA, Goodwin B, Galardi CM, Maglich JM, Wilson JG, Willson TM, Collins JL, Kliewer SA (2001) Liver X receptor (LXR) regulation of the LXRalpha gene in human macrophages. J Biol Chem 276: 43509–43515 [DOI] [PubMed] [Google Scholar]
- Xiong J, Du Q, Liang Z (2010) Tumor-suppressive microRNA-22 inhibits the transcription of E-box-containing c-Myc target genes by silencing c-Myc binding protein. Oncogene 29: 4980–4988 [DOI] [PubMed] [Google Scholar]
- Xiong W, Ferrell JE Jr (2003) A positive-feedback-based bistable ‘memory module’ that governs a cell fate decision. Nature 426: 460–465 [DOI] [PubMed] [Google Scholar]
- Yue L, Ye F, Gui C, Luo H, Cai J, Shen J, Chen K, Shen X, Jiang H (2005) Ligand-binding regulation of LXR/RXR and LXR/PPAR heterodimerizations: SPR technology-based kinetic analysis correlated with molecular dynamics simulation. Protein Sci 14: 812–822 [DOI] [PMC free article] [PubMed] [Google Scholar]
- Zeitlinger J, Simon I, Harbison CT, Hannett NM, Volkert TL, Fink GR, Young RA (2003) Program-specific distribution of a transcription factor dependent on partner transcription factor and MAPK signaling. Cell 113: 395–404 [DOI] [PubMed] [Google Scholar]
- Zordan RE, Miller MG, Galgoczy DJ, Tuch BB, Johnson AD (2007) Interlocking transcriptional feedback loops control white-opaque switching in Candida albicans. PLoS Biol 5: e256. [DOI] [PMC free article] [PubMed] [Google Scholar]
Associated Data
This section collects any data citations, data availability statements, or supplementary materials included in this article.