Abstract
Obesity is the major risk factor for metabolic syndrome and through it diabetes as well as cardiovascular disease. Visceral fat (VF) rather than subcutaneous fat (SF) is the major predictor of adverse events. Currently, the reference standard for measuring VF is abdominal X-ray computed tomography (CT) or magnetic resonance imaging (MRI), requiring highly used clinical equipment. Dual-energy X-ray absorptiometry (DXA) can accurately measure body composition with high-precision, low X-ray exposure, and short-scanning time. The purpose of this study was to validate a new fully automated method whereby abdominal VF can be measured by DXA. Furthermore, we explored the association between DXA-derived abdominal VF and several other indices for obesity: BMI, waist circumference, waist-to-hip ratio, and DXA-derived total abdominal fat (AF), and SF. We studied 124 adult men and women, aged 18–90 years, representing a wide range of BMI values (18.5–40 kg/m2) measured with both DXA and CT in a fasting state within a one hour interval. The coefficient of determination (r2) for regression of CT on DXA values was 0.959 for females, 0.949 for males, and 0.957 combined. The 95% confidence interval for r was 0.968 to 0.985 for the combined data. The 95% confidence interval for the mean of the differences between CT and DXA VF volume was −96.0 to −16.3 cm3. Bland–Altman bias was +67 cm3 for females and +43 cm3 for males. The 95% limits of agreement were −339 to +472 cm3 for females and −379 to +465 cm3 for males. Combined, the bias was +56 cm3 with 95% limits of agreement of −355 to +468 cm3. The correlations between DXA-derived VF and BMI, waist circumference, waist-to-hip ratio, and DXA-derived AF and SF ranged from poor to modest. We conclude that DXA can measure abdominal VF precisely in both men and women. This simple noninvasive method with virtually no radiation can therefore be used to measure VF in individual patients and help define diabetes and cardiovascular risk.
Introduction
Obesity is the major risk factor for the metabolic syndrome and, through it, diabetes as well as cardiovascular disease. It is becoming clear that the distribution of body fat is more important in this regard than simply the amount of fat. For instance, android rather than gynoid distribution of fat is more often associated with the metabolic syndrome, diabetes, and cardiovascular disease (1,2,3,4,5,6). Therefore, anthropometric measurements such as the waist size and the waist-to-hip ratio have been shown in epidemiological studies to predict adverse outcomes (5,7,8).
More recently it has been demonstrated that even within abdominal fat (AF), it is visceral fat (VF) rather than subcutaneous fat (SF) that is the major predictor of adverse events (9,10,11,12,13,14,15). Currently, the most commonly used imaging technique for measuring VF is abdominal X-ray computed tomography (CT) (16,17,18,19,20). Although this technique has been well validated it is not optimal as a screening tool for VF because of radiation dose, manual image analysis to separate SF and VF, and the need for access to heavily utilized clinical equipment. While magnetic resonance imaging (MRI), which has also been used for measurement of VF measurement (21,22), avoids the radiation exposure encountered with CT, analysis is still largely manual and time-consuming, and as with CT, requires heavily utilized clinical equipment.
Dual-energy X-ray absorptiometry (DXA) can accurately measure body composition with high-precision, low X-ray exposure, and short-scanning time (23,24,25,26). DXA subdivides soft tissue into lean and fat compartments in order to allow whole body and regional measurement of body composition. Earlier attempts at using DXA measured total AF and did not utilize algorithms that segment AF into VF and SF (27,28). As a result DXA-derived total AF was not found to offer an advantage over anthropometric measurements.
Herein, we describe a newly developed fully automated method for segmenting AF into SF and VF within the android region using DXA that has been approved for clinical use by the US Food and Drug Administration. Using this approach we can measure total body fat, total AF, abdominal SF, and abdominal VF. We validated our newly developed method against CT in a patient population with a wide range of BMI. Furthermore, we explored the association between DXA-derived VF and BMI, waist circumference, waist-to-hip ratio, and DXA-derived AF and SF.
Methods and Procedures
Patient population and protocol
The protocol was approved by the Institutional Review Board of the Oregon Health and Science University, Portland, OR, and all subjects provided written informed consent. The study population included 124 adult men and women volunteers, aged 18–90 years, recruited from a wide range of BMI values (18.5–40 kg/m2). For each subject, height, weight, and hip and waist circumferences were measured. They were then imaged with DXA and CT in a random order within a one hour interval in the fasting state.
Sample size calculation
Sample size was calculated to reliably determine whether the correlation coefficient between DXA and CT exceeded a lower limit of r = 0.90. Using an internal engineering dataset, we conservatively estimated the correlations between DXA and CT VF volume for the study population as r = 0.961 for males and r = 0.954 for females. Calculating the power of a one-tailed test of the correlation against the value 0.90, α = 0.05, applying Fisher's Z-transformation and using a power of 90% as a basis for calculating sample size, the results indicated that a sample consisting of 60 subjects of each gender would suffice if the true correlation were 0.95 or greater.
DXA measurements
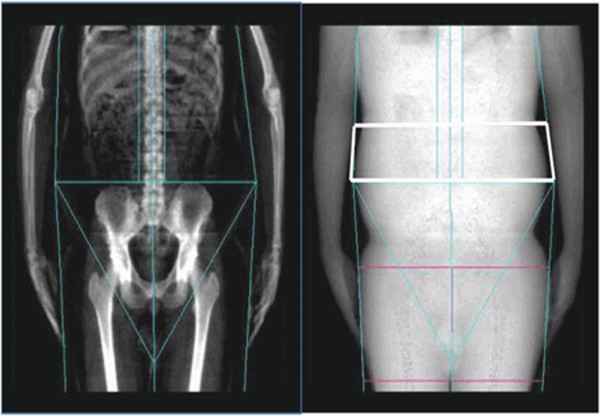
Total body imaging was acquired using the GE Healthcare Lunar iDXA and analyzed using enCORE software version 13.6. Daily quality control scans were acquired during the study period. No hardware or software changes were made during the course of the trial. Subjects were scanned using standard imaging and positioning protocols. For measuring android fat, a region-of-interest is automatically defined whose caudal limit is placed at the top of the iliac crest and its height is set to 20% of the distance from the top of the iliac crest to the base of the skull to define its cephalad limit (Figure 1). Abdominal SF and VF were estimated within the android region. Fat mass data from DXA was transformed into CT adipose tissue volume using a constant correction factor (0.94 g/cm3). This constant is generally consistent with the density of adipose tissue (29) and represents a value that was optimized in our training algorithm and not altered in the validation procedure.
Figure 1.
Sample dual-energy X-ray absorptiometry (DXA) bone and tissue images. The straight lines defined by the skeletal image (left) represent automated DXA regions of interest. Base of android region is keyed off of top of the iliac crest, shown as the top of the pelvic triangle. The android region is highlighted with solid white line on DXA soft tissue image (right).
CT measurements
CT scans were acquired using a Philips iCT 256 scanner running Extended Brilliance Workspace software version 3.0.0. A noncontrast enhanced standard abdominal scan was performed using 120 kVp, and 5-mm slice thickness. Subjects were placed in the supine position with arms above their head. Contiguous cross-sectional abdominal images were captured over 150 mm of the abdomen, beginning at the top of S1 and moving towards the head.
CT images were segmented using a semiautomated method to remove the subcutaneous AF, and the remaining tissue volumes were reconstructed from DICOM images using the GE Healthcare Advantage Workstation (version 4.1). To account for differences in patient positioning and variation in attenuation across subjects, a subject-specific threshold in Hounsfield units was developed based on manual selection of a region of high confidence VF in a single slice. The threshold was set for each patient at 2 s.d. from the mean VF Hounsfield value in the region-of-interest. This threshold was applied to all slices and the volume of VF was reported.
All CT data was analyzed by a single operator. Approximately 20% of the data (27 subjects) were randomly selected for verification of CT results by a second operator. The average difference in VF volume between the two testers was 3.3%. This agrees with previous reports in the literature showing 3% difference using similar methods (30,31).
Data analysis
CT data were transferred to GE Global Research Center (Niskayuna, NY), and DXA data were transferred to GE Healthcare Lunar (Madison, WI). CT and DXA images were not shared between the two centers in order to minimize any potential bias in the algorithm development and validation process.
Modeling of VF estimation
Prior to the start of the study, an internal engineering dataset was used to model the relationship between DXA estimated and CT measured VF volumes. Because the model relies on geometric assumptions of fat distribution in the abdomen, modeling parameters were optimized separately for females and males. For each sex, analysis of the clinical dataset consisted of two predefined phases. In the first phase, a small sample of the clinical dataset was identified that reflected population heterogeneity in several key areas including age, height, weight, and BMI. This subsample was used to estimate algorithm performance and ultimately was added to the internal engineering dataset to refine the DXA modeling parameters. In the second phase of analysis, validation was performed using the remaining dataset.
The android region contains both VF and SF. Generally, the SF forms a layer of nonuniform thickness around the abdominal cavity, which contains the VF. Our VF algorithm uses measurements of the total abdominal thickness, based on X-ray attenuation, and the width of the SF layer along the lateral extent of the abdomen along with empirically derived geometric constants to estimate the quantity of SF in the android region. VF is computed by subtracting SF from the total AF in the android region. The geometric assumptions of the model are based on comparing DXA and CT image volumes from a training set of images obtained from two independent clinical sites.
Statistical methods
Continuous variables were expressed as mean ± 1 s.d. Measurements were compared using paired t-tests with critical value of P = 0.05 used for assessing significant differences. Bland−Altman analysis was used to assess magnitude bias in the sample as a whole. Subgroup analysis was conducted to assess agreement in men and women separately. Pearson's correlation coefficients were computed comparing DXA VF to clinical parameters of interest.
Results
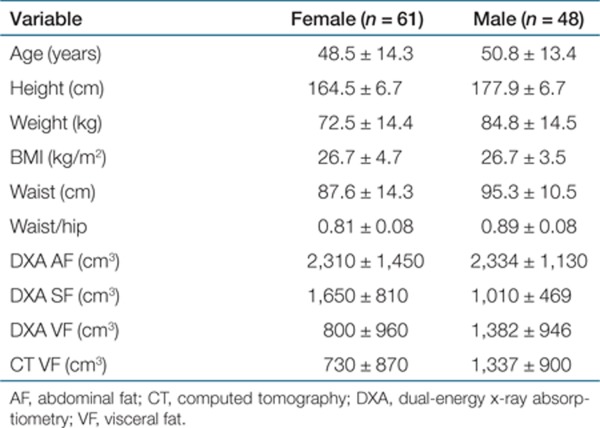
Table 1 describes the study cohort. Five of the study subjects were excluded because of defects in the CT scan (metal artifacts, no iliac crest present). A subsample of males (n = 10) was included in the VF algorithm development cohort. The remaining 109 subjects (61 females and 48 males) represented the validation cohort. All results reported are for the validation cohort only that consisted of 100 whites, 5 Hispanics, and 4 Asians. There were no African-Americans in the group.
Table 1. Descriptive statistics in the validation subjects (mean ± 1 s.d.).
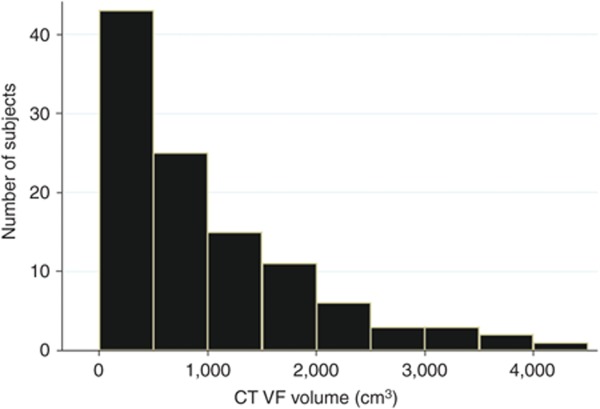
Due to the lack of practical selection techniques, subjects were not recruited on the basis of VF volume, albeit for the purposes of validation, a wide range of VF values is ideal to demonstrate utility of the measurement tool in a clinically relevant population. Figure 2 shows the distribution of VF volume among the subjects. Although the distribution is skewed, there was a wide range, with values ranging from 42 to 4,126 cm3 in females and 183 to 3,846 cm3 in males.
Figure 2.
Histogram of visceral fat (VF) volumes measured by computed tomography (CT). This data highlights the wide distribution of VF within our population of subjects with BMI 20–40 kg/m2.
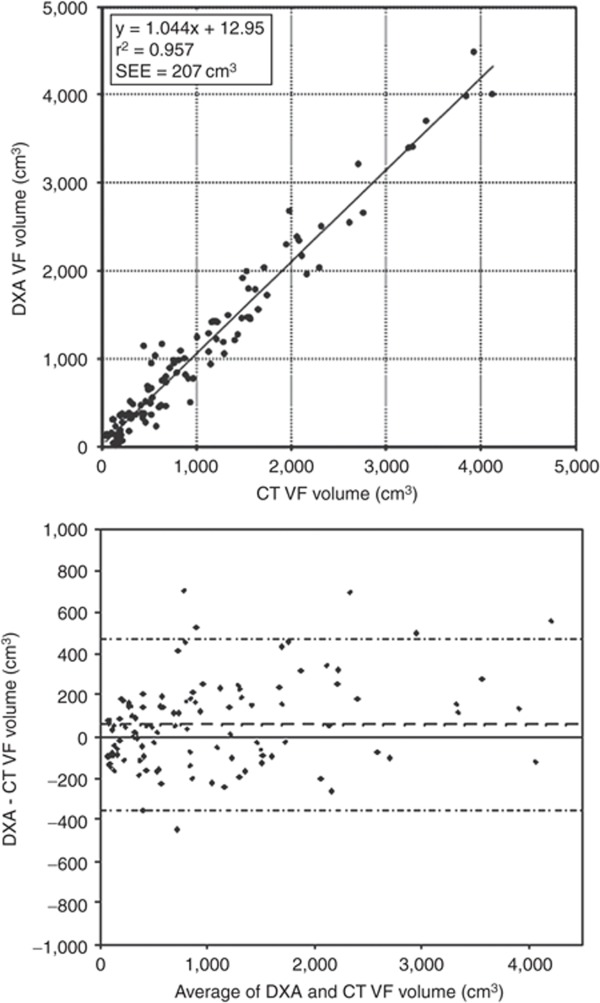
The primary endpoint of this study was agreement between DXA estimated and CT measured VF volume (Figure 3). The coefficient of determination (r2) for regression of CT on DXA values was 0.959 for females, 0.949 for males and 0.957 combined. The 95% confidence interval for r was 0.968 to 0.985 for the combined data (Figure 3a).
Figure 3.
Comparison of CT and DXA VF. Top: Correlation plot of dual-energy X-ray absorptiometry (DXA) visceral fat (VF) validation data against computed tomography (CT) for the combined dataset. Bottom: Bland–Altman plot of DXA VF validation data against CT for the combined dataset. SEE is defined as standard error of estimate = sqrt (regression error mean square).
Bland–Altman analysis was conducted to characterize differences between DXA and CT VF measurements over the range of VF volumes included in the analysis. The 95% confidence interval for the mean of the differences between CT and DXA VF volume was –96.0 to –16.3 cm3. Bland–Altman bias (CT as standard method) was +67 cm3 for females and +43 cm3 for males. The 95% limits of agreement were –339 to +472 cm3 for females and –379 to +465 cm3 for males. Combined, the bias was +567 cm3 with 95% limits of agreement of –355 to +468 cm3 (Figure 3b).
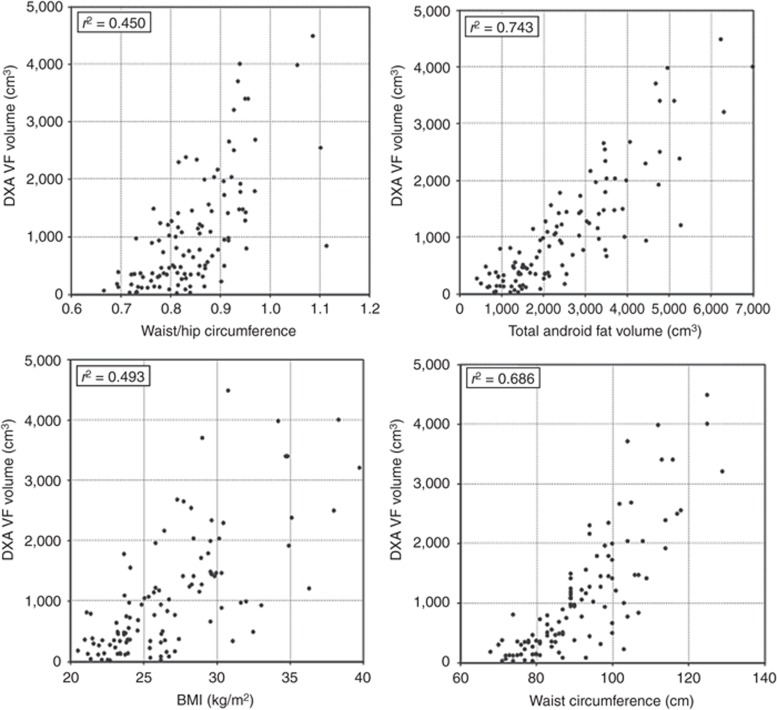
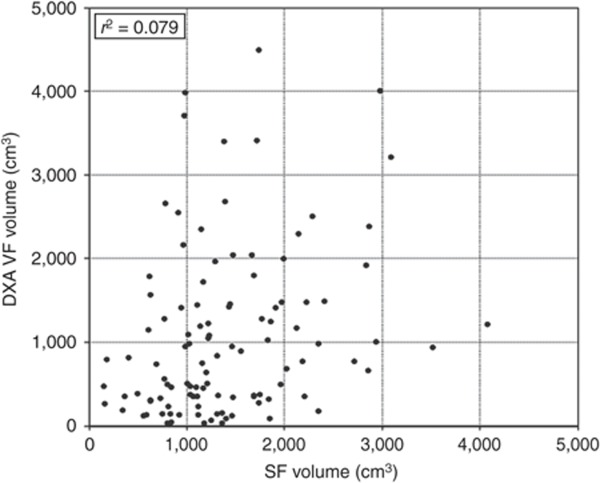
We further explored the relationships between VF and several other indices of total and central adiposity: BMI, waist circumference, waist-to-hip ratio, total DXA-derived AF, and DXA-derived SF. Whereas the DXA VF values were significantly correlated to varying degrees with all other indices, the scatter was large. Figure 4 shows the correlations between DXA VF values and BMI, waist circumference, waist-to-hip ratio, and DXA AF. Figure 5 shows the weak association between DXA-derived VF and SF.
Figure 4.
Correlation plots for dual-energy X-ray absorptiometry (DXA)-estimated visceral fat (VF) and BMI, waist circumference, waist-to-hip ratio, and DXA-estimated abdominal fat (AF).
Figure 5.
Correlation plot between dual-energy X-ray absorptiometry (DXA)-estimated visceral fat (VF) and subcutaneous fat (SF).
Discussion
In this report, we describe a new fully automated approach to quantify VF using DXA. We validated this method against CT, which is one of the current gold standards for quantifying VF. There was a strong agreement between DXA and CT across both genders and a wide range of BMI's. The average difference between techniques was 56 cm3, which is small relative to the average VF observed in our subjects (~1 kg). Relative to waist circumference, a common surrogate marker for abdominal obesity, the DXA values were better correlated with CT VF (r2 = 0.957 vs. 0.686). This is likely due to the inability of waist circumference to discriminate between VF and SF, which were not well correlated with each other in our study population.
DXA offers several advantages relative to CT or MRI for the measurement of VF. The cost of a DXA instrument is substantially lower than that of CT or MRI. Having such a system within an office-based practice or a research enterprise will, therefore, be more cost-effective and efficient rather than sharing a hospital-based CT or MRI system. DXA units can also be installed in a standard 100 sq. ft. room. The VF analysis is generated automatically soon after the total body scan, allowing the clinician to immediately access the VF information and communicate results (including images) to the patient while they are still in the office. DXA also exposes subjects to a much lower radiation dose relative to volumetric CT (0.96 µSv for a Standard Mode Total body DXA exam vs. 3,100 µSV of radiation for an abdominal CT scan), making it suitable for repeated measurements. Whereas MRI has the advantage of no ionizing radiation, it has drawbacks that make it unattractive for incorporation into use for routine screening including expense, procedure time, and availability of systems. Consequently DXA could be used as a low-cost screening tool for quantification of VF and other adipose tissue in the clinical setting.
VF is now recognized as a risk factor for the metabolic syndrome, diabetes, and cardiovascular disease (1,2,3,4,5,6,7,8). Interestingly even in nonobese individuals it has been associated with hypertension, abnormal glucose tolerance, insulin resistance, metabolic syndrome, and low high-density lipoprotein levels (9,32,33,34,35,36,37,39). The exact reason for the propensity of VF to be associated with metabolic and cardiovascular abnormalities remains speculative, but compared to SF, VF is more metabolically active, more sensitive to lipolysis, more resistant to insulin, and has a greater capacity to take up glucose and generate free fatty acids (40). It is inversely correlated with adiponectin (41) and directly correlated with leptin and high-sensitivity C-reactive protein (37). VF is also more sensitive to weight loss and to effects of drugs such as pioglitazone (42).
Study limitations
There are several limitations in this study. First, while enrollment for the study was open, we had a small representation of nonwhite subjects, which is consistent with Oregon demographics (1.8% African American, 3.7% Asian, and 1.4% American Indian). However, racial identity was not considered to be among the most important recruiting criteria, since the basic assumptions of the VF algorithm require only an elliptical distribution of abdominal fat. Whereas, to our knowledge, there is no evidence that this assumption is specific to one ethnic group, larger scale studies need to be done in different ethnic groups to confirm the generalizability of our algorithm.
Second, we also did not include morbidly obese (BMI >40 kg/m2) or subjects under age 18 in this trial. It may be useful to expand into these populations in the future. Finally, since our DXA VF measurement is fully automated, it cannot be tested for observer variability. However, in a series of phantom studies, precision estimates accounting for inter- and intrascanner differences were ~40 g on a 1 kg VF mass.
Summary
Heretofore, there has been no readily available method to quantify VF. Hence crude measures such as BMI, waist circumference, and the waist-to-hip ratio have been used to obtain an assessment of metabolic and cardiovascular risk. As can be seen from our results, these measurements do not reflect VF in a reliable manner and, importantly, SF has no significant relation with VF. A more reliable measurement of both metabolic and cardiovascular risk could potentially result from a direct measurement of VF. Further studies are needed to determine whether VF estimation offers incremental value to other more standard measures of metabolic and cardiovascular risk in patients.
Acknowledgments
This work was supported by a grant from GE Healthcare, Madison, WI.
M.P.R., W.K.W., and D.L.E. are employees of the funding company, GE Healthcare, or its affiliates. All the other authors declared no conflict of interest.
REFERENCES
- Krotkiewski M, Björntorp P, Sjöström L, Smith U. Impact of obesity on metabolism in men and women. Importance of regional adipose tissue distribution. J Clin Invest. 1983;72:1150–1162. doi: 10.1172/JCI111040. [DOI] [PMC free article] [PubMed] [Google Scholar]
- Lapidus L, Bengtsson C, Larsson B.et al. Distribution of adipose tissue and risk of cardiovascular disease and death: a 12 year follow up of participants in the population study of women in Gothenburg, Sweden Br Med J (Clin Res Ed) 19842891257–1261. [DOI] [PMC free article] [PubMed] [Google Scholar]
- Larsson B, Svärdsudd K, Welin L.et al. Abdominal adipose tissue distribution, obesity, and risk of cardiovascular disease and death: 13 year follow up of participants in the study of men born in 1913 Br Med J (Clin Res Ed) 19842881401–1404. [DOI] [PMC free article] [PubMed] [Google Scholar]
- Després JP, Moorjani S, Ferland M.et al. Adipose tissue distribution and plasma lipoprotein levels in obese women. Importance of intra-abdominal fat Arteriosclerosis 19899203–210. [DOI] [PubMed] [Google Scholar]
- Janssen I, Katzmarzyk PT, Ross R. Waist circumference and not body mass index explains obesity-related health risk. Am J Clin Nutr. 2004;79:379–384. doi: 10.1093/ajcn/79.3.379. [DOI] [PubMed] [Google Scholar]
- Kuk JL, Katzmarzyk PT, Nichaman MZ.et al. Visceral fat is an independent predictor of all-cause mortality in men Obesity (Silver Spring) 200614336–341. [DOI] [PubMed] [Google Scholar]
- Poirier P, Després JP. Waist circumference, visceral obesity, and cardiovascular risk. J Cardiopulm Rehabil. 2003;23:161–169. doi: 10.1097/00008483-200305000-00001. [DOI] [PubMed] [Google Scholar]
- Hayashi T, Boyko EJ, McNeely MJ.et al. Minimum waist and visceral fat values for identifying Japanese Americans at risk for the metabolic syndrome Diabetes Care 200730120–127. [DOI] [PubMed] [Google Scholar]
- Nakamura T, Tokunaga K, Shimomura I.et al. Contribution of visceral fat accumulation to the development of coronary artery disease in non-obese men Atherosclerosis 1994107239–246. [DOI] [PubMed] [Google Scholar]
- Boyko EJ, Fujimoto WY, Leonetti DL, Newell-Morris L. Visceral adiposity and risk of type 2 diabetes: a prospective study among Japanese Americans. Diabetes Care. 2000;23:465–471. doi: 10.2337/diacare.23.4.465. [DOI] [PubMed] [Google Scholar]
- Vega GL, Adams-Huet B, Peshock R.et al. Influence of body fat content and distribution on variation in metabolic risk J Clin Endocrinol Metab 2006914459–4466. [DOI] [PubMed] [Google Scholar]
- Pascot A, Lemieux S, Lemieux I.et al. Age-related increase in visceral adipose tissue and body fat and the metabolic risk profile of premenopausal women Diabetes Care 1999221471–1478. [DOI] [PubMed] [Google Scholar]
- Patel S, Unwin N, Bhopal R.et al. A comparison of proxy measures of abdominal obesity in Chinese, European and South Asian adults Diabet Med 199916853–860. [DOI] [PubMed] [Google Scholar]
- Després JP, Moorjani S, Lupien PJ.et al. Regional distribution of body fat, plasma lipoproteins, and cardiovascular disease Arteriosclerosis 199010497–511. [DOI] [PubMed] [Google Scholar]
- Després JP, Lemieux I. Abdominal obesity and metabolic syndrome. Nature. 2006;444:881–887. doi: 10.1038/nature05488. [DOI] [PubMed] [Google Scholar]
- Borkan GA, Gerzof SG, Robbins AH.et al. Assessment of abdominal fat content by computed tomography Am J Clin Nutr 198236172–177. [DOI] [PubMed] [Google Scholar]
- Grauer WO, Moss AA, Cann CE, Goldberg HI. Quantification of body fat distribution in the abdomen using computed tomography. Am J Clin Nutr. 1984;39:631–637. doi: 10.1093/ajcn/39.4.631. [DOI] [PubMed] [Google Scholar]
- Sjöström L, Kvist H, Cederblad A, Tylén U. Determination of total adipose tissue and body fat in women by computed tomography, 40K, and tritium. Am J Physiol. 1986;250:E736–E745. doi: 10.1152/ajpendo.1986.250.6.E736. [DOI] [PubMed] [Google Scholar]
- Kvist H, Chowdhury B, Grangård U, Tylén U, Sjöström L. Total and visceral adipose-tissue volumes derived from measurements with computed tomography in adult men and women: predictive equations. Am J Clin Nutr. 1988;48:1351–1361. doi: 10.1093/ajcn/48.6.1351. [DOI] [PubMed] [Google Scholar]
- Maurovich-Horvat P, Massaro J, Fox CS.et al. Comparison of anthropometric, area- and volume-based assessment of abdominal subcutaneous and visceral adipose tissue volumes using multi-detector computed tomography Int J Obes (Lond) 200731500–506. [DOI] [PubMed] [Google Scholar]
- Kullberg J, Ahlström H, Johansson L, Frimmel H. Automated and reproducible segmentation of visceral and subcutaneous adipose tissue from abdominal MRI. Int J Obes (Lond) 2007;31:1806–1817. doi: 10.1038/sj.ijo.0803671. [DOI] [PubMed] [Google Scholar]
- Liou TH, Chan WP, Pan LC.et al. Fully automated large-scale assessment of visceral and subcutaneous abdominal adipose tissue by magnetic resonance imaging Int J Obes (Lond) 200630844–852. [DOI] [PubMed] [Google Scholar]
- Mazess RB, Peppler WW, Gibbons M. Total body composition by dual-photon (153Gd) absorptiometry. Am J Clin Nutr. 1984;40:834–839. doi: 10.1093/ajcn/40.4.834. [DOI] [PubMed] [Google Scholar]
- Gotfredsen A, Jensen J, Borg J, Christiansen C. Measurement of lean body mass and total body fat using dual photon absorptiometry. Metab Clin Exp. 1986;35:88–93. doi: 10.1016/0026-0495(86)90101-0. [DOI] [PubMed] [Google Scholar]
- Heymsfield SB, Wang J, Heshka S, Kehayias JJ, Pierson RN. Dual-photon absorptiometry: comparison of bone mineral and soft tissue mass measurements in vivo with established methods. Am J Clin Nutr. 1989;49:1283–1289. doi: 10.1093/ajcn/49.6.1283. [DOI] [PubMed] [Google Scholar]
- Mazess RB, Barden HS, Bisek JP, Hanson J. Dual-energy x-ray absorptiometry for total-body and regional bone-mineral and soft-tissue composition. Am J Clin Nutr. 1990;51:1106–1112. doi: 10.1093/ajcn/51.6.1106. [DOI] [PubMed] [Google Scholar]
- Snijder MB, Visser M, Dekker JM.et al. The prediction of visceral fat by dual-energy X-ray absorptiometry in the elderly: a comparison with computed tomography and anthropometry Int J Obes Relat Metab Disord 200226984–993. [DOI] [PubMed] [Google Scholar]
- Clasey JL, Bouchard C, Teates CD.et al. The use of anthropometric and dual-energy X-ray absorptiometry (DXA) measures to estimate total abdominal and abdominal visceral fat in men and women Obes Res 19997256–264. [DOI] [PubMed] [Google Scholar]
- Martin AD, Daniel MZ, Drinkwater DT, Clarys JP. Adipose tissue density, estimated adipose lipid fraction and whole body adiposity in male cadavers. Int J Obes Relat Metab Disord. 1994;18:79–83. [PubMed] [Google Scholar]
- Yoshizumi T, Nakamura T, Yamane M.et al. Abdominal fat: standardized technique for measurement at CT Radiology 1999211283–286. [DOI] [PubMed] [Google Scholar]
- Potretzke AM, Schmitz KH, Jensen MD. Preventing overestimation of pixels in computed tomography assessment of visceral fat. Obes Res. 2004;12:1698–1701. doi: 10.1038/oby.2004.210. [DOI] [PubMed] [Google Scholar]
- Ding J, Visser M, Kritchevsky SB.et al. The association of regional fat depots with hypertension in older persons of white and African American ethnicity Am J Hypertens 200417971–976. [DOI] [PubMed] [Google Scholar]
- Hayashi T, Boyko EJ, Leonetti DL.et al. Visceral adiposity and the prevalence of hypertension in Japanese Americans Circulation 20031081718–1723. [DOI] [PubMed] [Google Scholar]
- Hayashi T, Boyko EJ, Leonetti DL.et al. Visceral adiposity and the risk of impaired glucose tolerance: a prospective study among Japanese Americans Diabetes Care 200326650–655. [DOI] [PubMed] [Google Scholar]
- Pascot A, Després JP, Lemieux I.et al. Contribution of visceral obesity to the deterioration of the metabolic risk profile in men with impaired glucose tolerance Diabetologia 2000431126–1135. [DOI] [PubMed] [Google Scholar]
- Pascot A, Lemieux I, Prud'homme D.et al. Reduced HDL particle size as an additional feature of the atherogenic dyslipidemia of abdominal obesity J Lipid Res 2001422007–2014. [PubMed] [Google Scholar]
- Kobayashi H, Nakamura T, Miyaoka K.et al. Visceral fat accumulation contributes to insulin resistance, small-sized low-density lipoprotein, and progression of coronary artery disease in middle-aged non-obese Japanese men Jpn Circ J 200165193–199. [DOI] [PubMed] [Google Scholar]
- Goodpaster BH, Krishnaswami S, Harris TB.et al. Obesity, regional body fat distribution, and the metabolic syndrome in older men and women Arch Intern Med 2005165777–783. [DOI] [PubMed] [Google Scholar]
- Goodpaster BH, Krishnaswami S, Resnick H.et al. Association between regional adipose tissue distribution and both type 2 diabetes and impaired glucose tolerance in elderly men and women Diabetes Care 200326372–379. [DOI] [PubMed] [Google Scholar]
- Ibrahim MM. Subcutaneous and visceral adipose tissue: structural and functional differences. Obes Rev. 2010;11:11–18. doi: 10.1111/j.1467-789X.2009.00623.x. [DOI] [PubMed] [Google Scholar]
- Kanaya AM, Harris T, Goodpaster BH, Tylavsky F, Cummings SR, Health, Aging, and Body Composition (ABC) Study Adipocytokines attenuate the association between visceral adiposity and diabetes in older adults. Diabetes Care. 2004;27:1375–1380. doi: 10.2337/diacare.27.6.1375. [DOI] [PubMed] [Google Scholar]
- Miyazaki Y, Mahankali A, Matsuda M.et al. Effect of pioglitazone on abdominal fat distribution and insulin sensitivity in type 2 diabetic patients J Clin Endocrinol Metab 2002872784–2791. [DOI] [PubMed] [Google Scholar]


