

Abstract
Growth is a priority trait from the point of view of genetic improvement. Molecular markers linked to quantitative trait loci (QTL) have been regarded as useful for marker-assisted selection in complex traits as growth. Polymorphisms have been studied in five candidate genes influencing growth in gilthead seabream (Sparus aurata): the growth hormone (GH), insulin-like growth factor-1 (IGF-1), myostatin (MSTN-1), prolactin (PRL), and somatolactin (SL) genes. Specimens evaluated were from a commercial broodstock comprising 131 breeders (from which 36 males and 44 females contributed to the progeny). In all samples eleven gene fragments, covering more than 13,000 bp, generated by PCR-RFLP, were analyzed; tests were made for significant associations between these markers and growth traits. ANOVA results showed a significant association between MSTN-1 gene polymorphism and growth traits. Pairwise tests revealed several RFLPs in the MSTN-1 gene with significant heterogeneity of genotypes among size groups. PRL and MSTN-1 genes presented linkage disequilibrium. The MSTN-1 gene was mapped in the centromeric region of a medium-size acrocentric chromosome pair.
1. Introduction
The value of aquaculture production was estimated at USD 98.4 billion in 2008 and has continued to show strong growth, increasing at an average annual growth rate of 6.2 percent [1]. Among fishes, the gilthead seabream Sparus aurata, from the Sparidae family, is one of the most important fish species cultivated in the Mediterranean region, where the main producer countries are Greece, Turkey, and Spain [2]. The strong competition between producer companies and the steep increase in production have caused the selling prices of the product to fall; this in turn has seriously reduced the profit margins of the companies, which in many cases have been squeezed to unsustainable levels. For this reason improvements in the systems of cultivation have become essential, and programmes of improvement by selection must be put into action to reduce production costs. Nevertheless, from cultivated species, only a few of them have ongoing selective breeding programmes. Traditionally, these have been carried out successfully using pedigree information by selecting individuals based on breeding values using an animal model. However, information on individual genes with medium or large effects cannot be used in this manner [3]. Molecular markers that directly affect or are linked to quantitative trait loci (QTL) have been regarded as useful for marker-assisted selection (MAS) or gene-assisted selection (GAS) programmes. The allelic variations at these individual genes have a major influence on overall phenotypic expression, and the number of genotypes managed is smaller, so it may be faster and more efficient to implement these improvement programs rather than others under industrial production conditions. Besides, traits as growth, with low heritability and relatively few records per traits measured, are those most benefiting from incorporating marker information [4].
Tests of association between candidate gene polymorphisms and quantitative traits have been widely applied in recent years using genetic markers. In that context, PCR-RFLPs (polymerase chain reaction-restriction fragment length polymorphisms) have been demonstrated to be very useful genetic markers for candidate gene studies; such studies have revealed polymorphisms associated with quantitative traits in Atlantic salmon Salmo salar [5], oysters Crassostrea gigas [6], cattle [7, 8], chickens [9], and sheep [10].
Growth is a priority trait from the point of view of genetic improvement since economic advantages can be gained from shortening the time required for production and improving the rate of feed conversion. Increasing homogeneity in the rate of growth of individuals is another characteristic of interest, since it would reduce the number of gradings to be carried out until harvest size is reached. In this context, the search for candidate genes influencing growth has been a major focus of research, and several candidate genes influencing growth in finfish have been isolated from the genome, and their effects quantified [11]. The growth is a complex trait from the genetic point of view because its genetic control is not well known and there are dozens of candidate genes acting upon it.
The five candidate genes selected for this study were growth hormone (GH), insulin-like growth factor-1 (IGF-1), myostatin (MSTN-1), prolactin (PRL), and somatolactin (SL) genes. All of them are known to be related to the somatotropic axis or transforming growth factors. Growth hormone (GH) plays a major role in stimulating somatic growth primarily through the induction of insulin-like growth factor I (IGF) [12]. Myostatin (MSTN) or growth differentiation factor 8 gene (GDF-8) seems to be a negative regulator of skeletal muscle growth in mammals [13]. There are two genes in gilthead seabream that code for MSTN: MSTN-1 [14] and MSTN-2 [15]; MSTN-1 is expressed mainly in skeletal muscle, at both adult and juvenile stages, and MSTN-2 is expressed almost exclusively in the central nervous system, at late larval stages [14, 15]. The insulin-like growth factor I gene (IGF-I) appears to be linked to nutritional condition, environmental adaptation, embryonic development, and growth regulation of teleosts [16]. Other candidate genes acting upon growth are the prolactin (PRL) gene, which performs several functions including mitogenic, somatotropic, and osmoregulatory activities [17] and the somatolactin (SL) gene, involved in a variety of physiological functions in teleosts [18].
Genetic mapping of genes allows a complete identification and the location of a gene and hence can be used in programs of genetic improvement in aquaculture. Physical maps enable the integration of linkage maps and karyotypes and are essential tools for comprehensive comparative genomic studies. In addition, the existence of a well-characterized physical map makes it more feasible to undertake a whole genome sequencing project [19]. Here, we report the localization of MSTN-1 gene, which presented in this work statistically significant association with growth traits, on S. aurata chromosomes.
With the object of gaining new understanding of genes related to growth traits in a marine commercial species, the objectives of the present study were to find and describe polymorphisms in candidate genes from S. aurata populations produced under commercial conditions and to test for associations between these polymorphisms and growth traits. Furthermore, the MSTN-1 gene, whose polymorphism has shown, in this study, a statistically significant correlation with growth traits, was mapped to the chromosomes of this species by means of the tyramide signal amplification (TSA) fluorescence system.
2. Materials and Methods
2.1. Animals and Phenotypic Traits
The samples were obtained from CUPIMAR S.A., an aquaculture company that operates in the area of the Bay of Cadiz, on the Atlantic coast of southwest Spain. One broodstock and their offspring were analyzed at different stages of production (Figure 1). The broodstock in these installations have mixed origins; wild specimens are added to those from the company's own aquaculture production, because the transformation of males into females after the third year results in a relative lack of males. The broodstock was utilised during several spawning seasons to generate the F 1 that are cultivated and grown for subsequent transfer to the on-growing facilities until reaching harvesting size. The breeders were maintained under environmental conditions of temperature, salinity, and oxygen, according to the management practices of the farm. A total of 131 individual breeders were sampled: 48 males and 83 females (N B = 131). Within each gender, the breeders were all of similar age.
Figure 1.
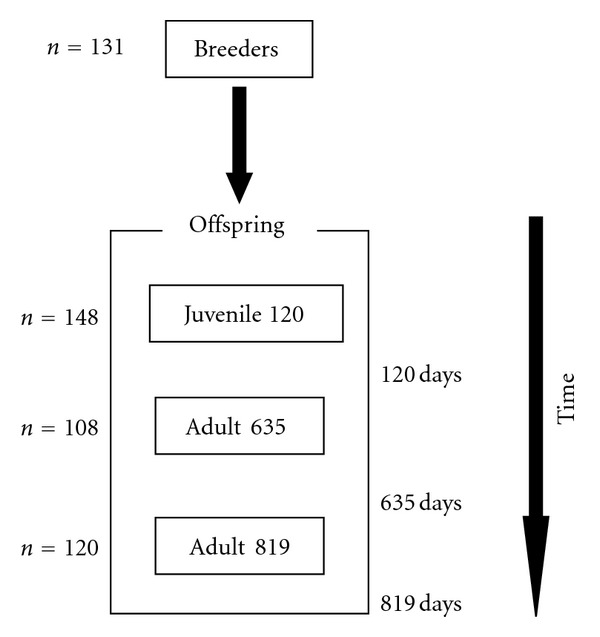
Schematic diagram of sampling during the different life stages.
Fish were anaesthetized with 0.025% 2-phenoxyethanol solution; fork length (L) and body weight (W) were recorded, and 1–1.5 mL of blood was extracted for DNA isolation. Maturation was induced by control of the photoperiod. Spawning took place in several tanks under production conditions, and offspring were then grouped together in one tank. The offspring originated from the spawning that took place in one single day.
Total residence time, calculated from the hatching date to the first sampling date, ranged between 112 days and 126 days (J120). A total of 148 juvenile fishes (N J120 = 148) were measured (fork length and body weight) during this period of fourteen days; specimens were graded, and either fin clips were excised or blood samples were taken, in both cases being preserved in 70% ethanol at 4°C till processing for DNA isolation. Juveniles were kept in nursery tanks and transferred to floating cages, where they were cultivated until reaching adult stage. At this stage, the individuals from two cages were sampled at different dates, representing either 635 days (N A635 = 108) or 819 days (N A819 = 120) after the date of spawning, respectively, and the 228 individuals in total were measured for fork length and body weight (Figure 1). Finally, quantities of 1.0 to 1.5 mL of blood were extracted for subsequent DNA analysis. A condition index was used to assess relative fatness and provide an estimate of the energy reserves, morphology, and health of the fish and is the parameter that best reflects the criterion utilised by the producer for its commercial classification of the product. Body weight × fork length−3 × 100 is the metric of the condition index (C).
2.2. DNA Extraction, Genotyping, and Parental Assignment
Genomic DNA from breeders, adults, and some juveniles was extracted from blood according to the protocol described by Martínez et al. [21]. For the rest of the juveniles, genomic DNA was extracted from fin clips using a modification of the salting-out extraction method. In all cases, the DNA was kept at 4°C until utilisation. All 376 offspring and 131 breeders were genetically characterised using microsatellite markers (multiplex) and familial assignments, determined according to Porta et al. [22].
2.3. Polymerase Chain Reaction (PCR) and Sequencing
The 11 regions from the five candidate genes that were screened by restriction fragment length polymorphisms (RFLP) are listed in Table 1. Except for growth hormone intron I amplification, which was carried out using oligonucleotides as described in Almuly et al. [20], all other amplification products were performed using forward and reverse primers based on S. aurata sequences from GenBank and designed with Primer3 software [23]. Primers were designed to anneal in the exons and/or promoters of the candidate genes so that we could amplify 0.7–1.9 kb DNA regions including at least one intron or part of the promoter (Table 2 and Figure 2).
Table 1.
Description of RFLPs in five candidate genes related to growth traits in gilthead seabream analyzed in this work.
| Gene | PCR fragment | Enzyme used to detect polymorphism | Polymorphic region | RFLP alleles |
|---|---|---|---|---|
| GH | A: Exon 1 to intron2 | HaeIII & HapII | Intron I | Size (micros.) |
| GH | B: Exon 4 to 3′UTR | HaeIII, MboII, PstI & TaqI | N.P. | — |
| IGF-I | A: Promoter to exon 1 | TaqI | Promoter | T→G/C |
| IGF-I | B: Exon 1 to exon 2 | HaeIII, EcoRI DraI, HapII & BspLU11I | N.P. | — |
| MSTN-1 | A: Promoter to exon 2 | HaeIII | Exon 1 | C→T |
| DraI | Intron 1 | A→C | ||
| MSTN-1 | B: Exon 2 to exon 3 | HaeIII | Intron 2 | G→T |
| PRL | A: Promoter to exon 1 | SspBI & DraI | Promoter | Size (micros.) |
| PRL | B: Exon 1 to exon 2 | EcoRI | Intron 1 | A→G |
| BspLU11I | Intron 1 | C→T | ||
| PRL | C: Exon 3 to exon 5 | HaeIII | Intron 3/Exon 4 | Size (indel) |
| FokI | Intron 3 & 4/Exon 3 | Size (indel) | ||
| SL | A: Promoter to exon 2 | HaeIII, HapII, AfaI, DraI & TaqI | N.P. | — |
| SL | B: Exon 4 to exon 5 | Tru9I, TaqI, SspI, HaeIII | N.P. | — |
N.P.: nonpolymorphic; GH: growth hormone; IGF-1: insulin-like growth factor I; MSTN: myostatin; PRL: prolactin; SL: somatolactin.
Table 2.
PCR oligonucleotide primers used for RFLP analysis in the five candidate genes studied in gilthead seabream.
| Amplified fragment | Primers | ||||
|---|---|---|---|---|---|
| Fragment | Length (bp) | Name | Position | Sequence (5′-3′) | Tm (°C) |
| GH_A | 1045–1900 | SG1 [20] | Exon 1 | AGAACCTGAACCAGACATGG | 52.8 |
| R1R1 [20] | Intron 2 | CTGCTGCCAGAGAATTACTG | 54.1 | ||
| GH_B | 1172 | GH_4F | Exon 4 | GTTCTCTGTCTGGCGGTTCT | 56.3 |
| GH_4R | 3′UTR | AGCAACTGGGTCTAATGAATGT | 54.4 | ||
| IGF-I_A | 944/954 | IGFI_PF | Promoter | TCATCAGATGTCATTTGCAGAC | 52.9 |
| IGFI_PR | Exon 1 | TGCCACTGAAAGGAAAGAGC | 56.8 | ||
| IGF-I_B | 1506 | IGFI-1F | Exon 1 | AGCGCTCTTTCCTTTCAGTG | 56.8 |
| IGFI-1R | Exon 2 | GCCTCTCTCTCCACACACAA | 55.1 | ||
| MSTN1_A | 934 | MSTN_1F | Promoter | GCCTGTCAGTGTGGGACTTT | 55.0 |
| MSTN_1R | Exon 2 | ACGATTCGATTGGCTTGAAT | 57.4 | ||
| MSTN1_B | 881/886 | MSTN_2F | Exon 2 | AACAAGTGTTGAGCGTGTGG | 55.5 |
| MSTN_2R | Exon 3 | CTCCGAGATCTTCACCTCCA | 57.2 | ||
| PRL_A | 1014–1063 | PRL_PF | Promoter | GACTTTAACATGACCTGGAGGA | 54.4 |
| PRL_PR | Exon 1 | TGGTTTCTCTGTGAGCCATCT | 57.7 | ||
| PRL_B | 864/765 | PRL_1F | Exon 1 | ATGGCTCACAGAGAAACCAA | 54.0 |
| PRL_1R | Exon 2 | GAGTTGTGCTGAGGGAGTGC | 55.7 | ||
| PRL_C | 1549/1496 | PRL_3-4F | Exon 3 | GTAGGCTGGACGATGATGC | 54.8 |
| PRL_3-4R | Exon 5 | AGCAGGACAACAGGAAATGG | 56.7 | ||
| SL_A | 1650 | SL_PF | Promoter | GAACAGTGGTAATGACAGTCTCAA | 53.9 |
| SL_PR | Exon 2 | GTGAGCAGATAGGGCCAGAG | 56.2 | ||
| SL_B | 704–721 | SL_4F | Exon 4 | CATTCTGTGCTGATGCTGGT | 55.9 |
| SL_4R | Exon 5 | GGGCATCTTTCTTGAAGCAG | 56.1 | ||
N.P.: nonpolymorphic; GH: Growth Hormone; IGF-1: Insulin-Like Growth Factor I; MSTN: Myostatin; PRL: Prolactin; SL: Somatolactin. A, B, and C fragments defined by the primer positions.
Figure 2.
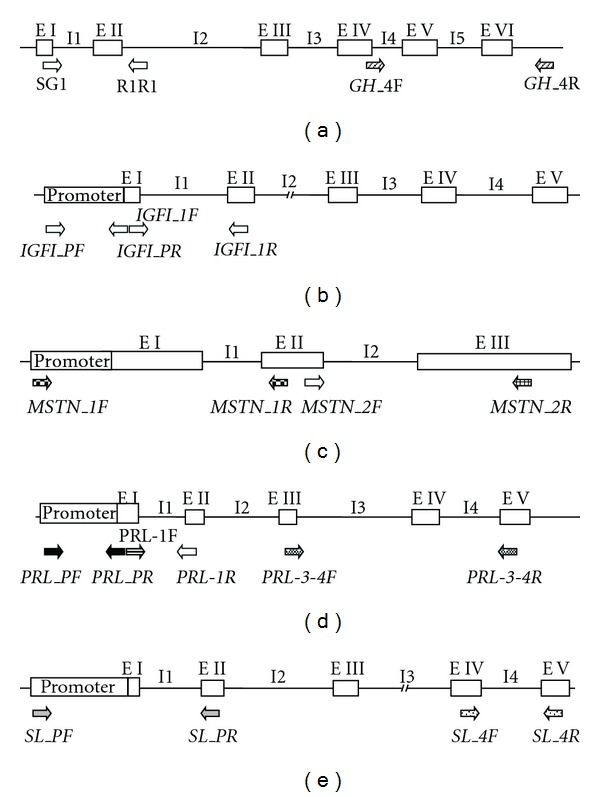
Structure of the candidate genes and oligonucleotide primers used for amplification by PCR in this study. Growth hormone (a), Insulin-Like Growth Factor I (b), Myostatin-1 (c), Prolactin (d), and Somatolactin (e) genes. I: Introns; E: Exons; Arrows indicate relative position of the primers.
The PCR amplification reactions were performed in a Gene Amp PCR System 2700 (Applied Biosystem) thermal cycler that was programmed for denaturation at 94°C for 5 min.; 35 cycles of amplification with 30 s at 94°C, 30 s at 59–63°C (depending on DNA fragment), 1 min. at 72°C; and a final extension at 72°C for 10 min. Reactions were carried out in a final volume of 50 μL with 200 mM dNTPs, 0.2 μM of the forward and reverse primers, 2.0-3.0 mM MgCl2, 60–120 ng gilthead seabream genomic DNA, 2–5 U of EuroTaq polymerase (EuroClone Genomics), and 5.0 μL 10x reaction buffer (EuroClone Genomics). The PCR products were examined by electrophoresis through a 1.5% agarose gel containing 0.5 μg mL−1 ethidium bromide. Amplified products of the predicted size were cut and purified from gels with a nucleoSpin extract II kit (Macherey-Nagel) before carrying out the sequencing reactions. DNA sequencing was performed with fluorescence-labelled terminator (BigDye Terminator 3.1 Cycle Sequencing Kit; Applied Biosystems) in an ABI3100 Genetic Analyzer. Sequence data from this paper have been deposited with the GenBank Data Library under Accession numbers FJ827497 to FJ827506.
2.4. RFLP Detection and Genotyping (PCR-RFLP Alleles)
The selection of the restriction enzymes needed to observe the RFLPs was performed using software available on the Internet, such as In silico [24] and Webcutter 2.0 (http://rna.lundberg.gu.se/cutter2/). Preferential selection was made for those enzymes that produced cuts within the target sequence and with the number of targets not higher than three, to avoid products of small size that might not be detected later in the electrophoresis. Different enzymes were tested for the different PCR products, with the aim of obtaining at least two RFLPs for each sequence amplified.
The digestions were performed by incubation of the samples in a water bath at the optimum temperature for each enzyme according to the manufacturer. The reactions were carried out in a final volume of 50 μL containing 0.05–1.0 μL of enzyme (Roche Molecular Biochemicals, Amersham Biosciences or Fermentas), 1x of the appropriate buffer, and 2–5 μL of the PCR product.
To determine the size of the products, the samples were loaded into agarose gels (1–1.5%) in 0.5x TBE with ethidium bromide (0.5 μg mL−1). Gels were visualised and analyzed using Gel Doc XR Molecular Imager (BioRad) and Quantity One 1-D Analysis programme, respectively.
2.5. Statistical Analysis
One-way analysis of variance (ANOVA) was used to test significant associations between the marker genotype (at each of the eight RFLP loci) and the three phenotypic traits (L, W, and C). The procedures utilised in the comparison of means are not very sensitive to the lack of normality. When there are no atypical observations and the sample distributions are approximately symmetric, ANOVA can safely be used even for very few samples (n = 4-5) [25]. On the other hand, the results of the F test of the ANOVA can be considered reliable, when the largest standard deviation is less than twice as large as the smallest standard deviation [25]. The ANOVA test was applied only in those cases in which the standard deviations complied with this ratio. In those cases in which there were significant values and the sample standard deviations did not comply with this ratio, the nonparametric test of Kruskal-Wallis was applied.
As the gilthead seabream is a protandrous hermaphroditic teleost, in which sex is reversed in males after about 2 years of age, the broodstock presented a marked difference between the means of the males and females. For this reason, we analyzed length, body weight, and condition index variables for each locus by fitting a general linear model (GLM) to the data from breeders that included gender as a factor:
| (1) |
where Y ij is the phenotypic trait (e.g., weight in breeder group), μ is the mean value of the trait, α i is the genotype at the RFLP marker, β j is gender, and ε ij is the random residual.
The proportion of the phenotypic variation explained by each RFLP marker was calculated as r 2 = SS effect/SS total.
All these tests were applied using the SPSS 14.0 statistical software programme. In all cases when multiple comparisons were made, the Bonferroni adjustment was applied [26].
To determine the existence of linkage disequilibrium between pairs of loci analyzed, the null hypothesis “genotypes at one locus are independent from genotypes at the other locus” was tested using the GENEPOP programme package [27]. Contingency tables were created for all pairs of loci in each age group and across all the population, and Fisher's exact test was performed for each table.
The distribution of the genotypes in each age group, sub-classified by sizes, was studied. The null hypothesis tested was “the genotypic distribution is identical across the size-group”. For each locus, the test was performed on contingency tables. An unbiased estimate of the P value of a log-likelihood (G)-based exact test was performed [28] using the GENEPOP program package [27]. The test was performed for all pairs of samples, for all loci. According to fork length and body weight distribution, adults and breeders were classified in two groups: small and large (adults) and males and females (breeders). Juveniles were classified in two size groups, small (J-S) and large (J-L) which were subclassified in small (S), medium (M), and large (L). When multiple comparisons were made, the Bonferroni correction was applied to adjust the α value for each age group.
2.6. Cytogenetic Techniques
Chromosome preparations were made from 1-2-day-old S. aurata larvae according to Cross et al. [29]. To make the myostatin probe, first-strand cDNA was obtained from S. aurata larvae RNA using a SMART RACE cDNA Amplification Kit (Clontech Laboratories). The cDNA for the MSTN-1 probe was obtained by PCR from the first-strand cDNA using a forward primer in exon 1: 5′-AGAAGACACGGAGCTGTGC-3′ and a reverse primer in exon 3: 5′-AAGAGCATCCACAACGGTCT-3′. The amplification yielded a fragment of 1025 bp, and its structure was verified by sequencing. Digoxigenin (dig-11-dUTP) labelling of 1 μg DNA probe was performed by random priming using the Decalabel DNA Labeling Kit (Fermentas) according to the manufacturer's instructions. Following the labelling, the sample was purified on a column of QIAquick Gel Extraction Kit (Qiagen) in a final volume of 50 μL. FISH-TSA were carried out essentially according to Krylov et al. [30] with minor modifications. Photographs were taken using a fluorescence microscope (Olympus BX-40) and a SONY EXwave HAD black and white camera. Images were processed and coloured using the ACC Program, v.5.0 (SOFO, Brno, Czech Republic).
3. Results
3.1. Biometric Data of Breeders and Progeny
The analysis of parentage revealed that a total of 80 fishes, 47 males and 33 females, from 131 breeders, contributed to the progeny (exclusion power > 0.999 and an estimated probability of identity of 2.13 · 10−31). A total of 108 families of full and half-siblings, were represented in the sample of 376 offspring samples, with an average of 3.2 (±3.15) descendents per full siblings family.
Table 3 summarizes biometric data (weight, length, and condition index) from breeder and offspring in the different sampled groups. Because of the biology of S. aurata, a clear size difference can be observed between male and female breeders; all individuals are males at the end of their first year of life, and at approximately two years of age, most individuals become females. In our study, all the offspring sampled were male. In the breeder group, the 83 females sampled presented mean weight and length values higher than those of the 48 males. The coefficients of variation (CV) can be deduced from Table 3, and for weight, CV is approximately 3 times the values obtained for L and for C.
Table 3.
Means (standard deviation) for body weight, fork length, and condition index in samples analyzed.
| Group | N | Weight (g) | Length (cm) | Condition index (g · cm−3) |
|---|---|---|---|---|
| B-M | 48 | 2,048.42 (±533.75) | 50.97 (±3.85) | 1.50 (±0.13) |
| B-F | 83 | 2,656.22 (±491.51) | 55.86 (±3.00) | 1.52 (±0.15) |
| B-T | 131 | 2,433.51 (±584.64) | 54.07 (±4.08) | 1.51 (±0.14) |
| J120 | 148 | 6.14 (±3.62) | 7.22 (±1.51) | 1.43 (±0.26) |
| A635 | 108 | 394.44 g (±139.56) | 27.73 (±3.13) | 1.77 (±0.17) |
| A819 | 120 | 549.58 g (±183.14) | 29.14 (±2.87) | 2.13 (±0.20) |
B-M, B-F, and B-T: males, females, and total individuals among breeders, respectively; J120: juveniles sampled 120 days after hatching; A635 and A819: adults sampled 635 and 819 days after hatching.
3.2. Polymorphisms of the Five Candidate Genes
We studied five candidate genes for growth rate in S. aurata and tested for association with three quantitative traits (body weight, fork length, and condition factor) at different stages of development: breeders, juveniles, and adults. To find usable RFLP markers in the proposed candidate genes, 11 gene fragments, covering more than 13000 bp, were amplified and sequenced. Several enzymes were chosen to test for usable polymorphism. Four of the 11 fragments studied (GH_B, IGF-I_B, SL_A, and SL_B) were nonpolymorphic, but seven exhibited polymorphism of size and/or restriction sites, as shown in Table 1 (RFLP patterns obtained in PRL 3_4 for HaeIII and FokI were identical, and therefore only one of them (FokI) was considered in the ANOVA analysis).
3.3. One-Tail ANOVA Analysis of the Association between Genotypes of the Different Age-Groups, of the Five Candidate Genes and Phenotypic Traits
When the ANOVA test was applied, several putative associations between phenotypic traits (W, L, and C) and genetic marker genotypes were found (Table 4). However, as we tested seven independent hypotheses (seven RFLPs) in each age group the corrected value for α was considerably smaller (α Bonferroni = 0.05/7 = 0.00714). Under this α-correction for the ANOVA test, six putative associations between markers and traits remained significant: five of the six were associated with the MSTN1 RFLP (in some of the breeders, adults and juvenile groups) (Table 4). After Bonferroni corrections in the Kruskal-Wallis nonparametric tests (applied to W and C in the juveniles group, and C in the A635 adults), two putative MSTN1-RFLP associations (both in breeders for W and L) remained significant (MSTN1_A-HaeIII). This marker accounted for 5.8% and 6.2% of the phenotypic variance in W-B and L-B, respectively.
Table 4.
Analysis of variance (ANOVA) for weight, length, and condition index within genotypes for different age groups in S. aurata. Breeders are considered without respect to gender.
| Locus | Phenotypic variable | |||||||||||||
|---|---|---|---|---|---|---|---|---|---|---|---|---|---|---|
| W-B | L-B | C-B | W-J120 | L-J120 | C-J120 | W-A635 | L-A635 | C-A635 | W-A819 | L-A819 | C-A819 | |||
| IGF-I-P | TaqI | F | 0.325 | 0.492 | 0.758 | 0.046 | 0.243 | 4.227 | 3.328 | 3.101 | 1.227 | 1.457 | 1.408 | 1.137 |
| P | 0.807 | 0.689 | 0.520 | 0.996 | 0.913 | 0.003b | 0.040a | 0.049a | 0.297 | 0.220 | 0.236 | 0.343 | ||
| N | 131 | 131 | 131 | 148 | 148 | 148 | 108 | 108 | 108 | 120 | 120 | 120 | ||
|
| ||||||||||||||
| MSTN1_A | HaeIII | F | 8.010 | 8.578 | 0.614 | 0.177 | 0.105 | 0.117 | 0.665 | 0.807 | 0.297 | 3.521 | 2.832 | 2.546 |
| P | 0.005b | 0.004b | 0.435 | 0.675 | 0.675 | 0.732 | 0.417 | 0.371 | 0.587 | 0.063 | 0.095 | 0.113 | ||
| N | 131 | 131 | 131 | 148 | 148 | 148 | 108 | 108 | 108 | 120 | 120 | 120 | ||
| DraI | F | 0.303 | 0.712 | 0.290 | 0.012 | 0.003 | 1.430 | 0.422 | 1.859 | 11.918 | — | — | — | |
| P | 0.583 | 0.400 | 0.591 | 0.912 | 0.960 | 0.234 | 0.518 | 0.176 | 0.001b | — | — | — | ||
| N | 131 | 131 | 131 | 148 | 148 | 148 | 108 | 108 | 108 | 120 | 120 | 120 | ||
|
| ||||||||||||||
| MSTN1_B | HaeIII | F | 4.236 | 3.723 | 0.440 | 5.103 | 3.924 | 0.047 | 4.747 | 3.292 | 4.510 | 0.518 | 0.144 | 2.929 |
| P | 0.017a | 0.027a | 0.645 | 0.007b | 0.022a | 0.954 | 0.011a | 0.041a | 0.013a | 0.597 | 0.866 | 0.057 | ||
| N | 131 | 131 | 131 | 148 | 148 | 148 | 108 | 108 | 108 | 118 | 118 | 118 | ||
|
| ||||||||||||||
| PRL_1 | EcoRV | F | 1.534 | 1.779 | 0.416 | 0.182 | 0.136 | 1.255 | 1.587 | 1.380 | 3.429 | 2.111 | 2.043 | 0.573 |
| P | 0.220 | 0.173 | 0.660 | 0.834 | 0.873 | 0.288 | 0.197 | 0.253 | 0.020a | 0.126 | 0.134 | 0.565 | ||
| N | 131 | 131 | 131 | 148 | 148 | 148 | 108 | 108 | 108 | 120 | 120 | 120 | ||
| BspLU11I | F | 1.123 | 1.199 | 0.415 | 0.453 | 0.463 | 0.716 | 2.086 | 1.882 | 1.513 | 0.944 | 1.019 | 0.365 | |
| P | 0.352 | 0.313 | 0.838 | 0.810 | 0.803 | 0.613 | 0.061 | 0.102 | 0.181 | 0.467 | 0.417 | 0.900 | ||
| N | 131 | 131 | 131 | 148 | 148 | 148 | 108 | 108 | 108 | 120 | 120 | 120 | ||
|
| ||||||||||||||
| PRL_3_4 | FokI | F | 0.030 | 0.026 | 0.103 | 1.022 | 1.395 | 0.400 | 0.437 | 0.122 | 1.230 | 0.416 | 0.336 | 0.653 |
| P | 0.97 | 0.974 | 0.902 | 0.362 | 0.251 | 0.671 | 0.647 | 0.885 | 0.297 | 0.661 | 0.715 | 0.522 | ||
| N | 131 | 131 | 131 | 147 | 147 | 147 | 107 | 107 | 108 | 119 | 119 | 119 | ||
W-, L-, and C-: body weight, fork length, and condition index, respectively; B: breeders; J120: juveniles sampled 120 days after hatching; A635: adults sampled 635 days after hatching; A819 Adults sampled 819 days after hatching; F: F value; P: P value; N: number of individuals analyzed.
aSignificant at α = 0.05.
bSignificant at α Bonferroni = 0.00714.
Size differences between males and females are a characteristic of this species due to its protrandrous hermaphroditism, by which individuals mature first as males and later change to females. Because of this difference, the study of associations between genotypes and quantitative characteristics in breeders may be affected by sex. When a GLM was used to test for association between genotypic marker and the three quantitative traits (W, L and C) in breeders with gender factor (data not shown), the association between MSTN1_A-HaeIII and weight/length traits did not remain significant (P W = 0.084 and P L = 0.061).
3.4. Pairwise Analysis of the Association between Genotypes, Five Candidate Genes, and Size Classes in Each Age Group
To determine the distribution of genotypes between pairs of size classes for each age group, an analysis using contingency tables was made. Pairwise tests revealed several RFLPs with significant heterogeneity of genotypes among size-group pairs in juveniles, again most of them at the MSTN-1 gene (P ranged from 0.002 to 0.017), and one significant P value (P = 0.019) in the A819 adult group at the IGF-I gene (Table 5). As numerous comparisons were performed for each age group, Bonferroni's correction was applied. Under these corrected values of α, the comparison of the small-large groups (S-L), in the RFLP MSTN1_B-HaeIII in the J-S group, remained significant. With this new distribution of individuals, in function of their size, an ANOVA analysis was performed for the small juveniles (S-J120); it was found that, for the weight, there was a significant association (P = 0.003) with the RFLP MSTN1_B-HaeIII, confirming the putative relationship of MSTN-1 with growth traits obtained in the various statistical treatments reflected in Tables 4 and 5.
Table 5.
Probability values (P) for exact tests for homogeneity of RFLP genotype frequencies in candidate genes between analyzed groups of S. aurata.
| Locus | B | J-S | J-L | A635 | A819 | ||||||
|---|---|---|---|---|---|---|---|---|---|---|---|
| F-M | S-M | M-L | S-L | S-M | M-L | S-L | S-L | S-L | |||
| IGF-I-P | TaqI | P | 0.623 | 1.000 | 0.772 | 1.000 | 0.547 | 0.576 | 0.435 | 0.334 | 0.019a |
| N | 131 | 50 | 51 | 51 | 48 | 47 | 49 | 108 | 120 | ||
|
| |||||||||||
| MSTN1_A | HaeIII | P | 0.157 | 0.349 | 0.191 | 1.000 | 1.000 | 1.000 | 1.000 | 0.617 | 0.119 |
| N | 131 | 50 | 51 | 51 | 48 | 47 | 49 | 108 | 120 | ||
| DraI | P | 0.355 | 0.609 | 0.349 | 1.000 | 1.000 | 1.000 | 1.000 | 1.000 | — | |
| N | 131 | 50 | 51 | 51 | 48 | 47 | 49 | 108 | 120 | ||
|
| |||||||||||
| MSTN1_B | HaeIII | P | 0.309 | 0.616 | 0.005a | 0.002b | 0.817 | 0.442 | 0.324 | 0.017a | 1.000 |
| N | 131 | 50 | 51 | 51 | 48 | 47 | 49 | 108 | 120 | ||
|
| |||||||||||
| PRL_1 | EcoRV | P | 0.144 | 0.566 | 0.248 | 0.727 | 0.725 | 1.000 | 1.000 | 0.327 | 0.092 |
| N | 131 | 50 | 51 | 51 | 48 | 47 | 49 | 108 | 120 | ||
| BspLU11I | P | 0.281 | 0.443 | 0.404 | 0.762 | 1.000 | 0.732 | 0.719 | 0.054 | 0.196 | |
| N | 131 | 50 | 51 | 51 | 48 | 47 | 49 | 108 | 120 | ||
|
| |||||||||||
| PRL_3_4 | FokI | P | 0.889 | 1.000 | 0.427 | 0.313 | 1.000 | 0.818 | 1.000 | 0.788 | 0.407 |
| N | 131 | 50 | 51 | 51 | 48 | 47 | 49 | 108 | 119 | ||
B: breeders; J: juveniles; A635: adults sampled 635 days after hatching; A819: adults sampled 819 days after hatching; S: small; M: medium; L: large; N: number of samples analyzed; P: P value.
aSignificant at α = 0.05.
bSignificant at α Bonferroni = 0.0024.
To assess whether heterozygosity at the MSTN-1 gene influences any of the traits studied, the genotypes were grouped by homozygous/heterozygous type, and this new factor was used in an analysis of variance (data not shown). It was observed that again, for weight of both breeders (MSTN1_A-HaeIII) and juveniles (MSTN1_B-HaeIII), the homozygous genotypes were larger (P < 0.05) than the heterozygous.
When we tested for the existence of linkage disequilibrium between pairs of loci, our results revealed that, curiously, MSTN1_A-DraI were in linkage disequilibrium with both PRL-1-BspLU11I (P ≤ 0.05) and PRL-1-EcoRV (P ≤ 0.05) (Fisher's exact test), which implies a statistically significant linkage disequilibrium between these two genes, MSTN1 and PRL.
3.5. Chromosome Location of the MSTN-1 Gene
FISH-TSA experiments on S. aurata chromosomes have led us to localize the MSTN-1 gene of S. aurata in the centromeric region of two medium-sized acrocentric chromosomes (Figure 3(a)). Signal position was evaluated in 194 metaphase spreads, of which 65.9% displayed a specific signal. The remaining metaphase spreads did not show any FISH signal, apart from a few metaphase spreads (8.7%) that presented four possible signals; that second signal also appears in a centromeric region (Figure 3(b)).
Figure 3.

Localization of the myostatin-1 probe on S. aurata chromosomes. (a) MSTN-1 probe in the centromeric region of acrocentric chromosomes. (b) Localization of MSTN-1 and putative MSTN-2 genes both in centromeric regions of two different acrocentric chromosomes.
4. Discussion
The infinitesimal model, which assumes that for any particular quantitative trait the individual effects of genes are unknown and usually are only small in their magnitude, does not fully explain the observed patterns of genetic variance. On the contrary, for many traits, allelic variation at individual genes has been shown to have a major influence on overall phenotypic expression [11]. Consequently, there has been substantial investment in livestock sciences directed towards the detection of major/candidate genes differentially influencing trait expression. Taking these factors into account, this study was conducted to obtain more practical results that are closely related to conditions in fish farming and to the biology of the species. The analysis of polymorphism in eleven DNA fragments, belonging to five candidate genes, allowed us to use seven PCR-RFLPs to test for association with three quantitative traits (W, L, and C). The majority of the associations found, after several corrections and nonparametric tests (when necessary), were associated with the MSTN-1 gene. In breeders, when ANOVAs were performed considering gender as a factor (data not shown), no significant values were obtained. The considerable weight lost at spawning in females may explain the effect of transition from male to female on length and weight traits. Pairwise tests revealed significant heterogeneity of genotypes among size groups in one RFLP marker (MSTN1_B-HaeIII) (Table 5) and confirmed the putative relationship of MSTN-1 with growth traits observed in the ANOVA tests. When we tested for association between homozygous/heterozygous genotypes of the MSTN-1 gene and phenotype traits, the results suggest selection at the genotype level, with homozygotes being favoured at certain ages for certain alleles present in the population. In order to test rigorously and confirm the putative associations uncovered in this study, cross-test family-based analysis should be applied, under similar conditions of industrial production.
In this study, myostatin polymorphisms were putatively linked with growth traits in S. aurata under industrial production conditions. An association between this candidate gene and growth is not surprising because myostatin acts as a negative regulator of skeletal muscle growth [31], and many studies show that myostatin can affect muscle mass in several species [32–34], and the presence in the population of favourable alleles would result in greater growth of those individuals that were homozygous for growth-increasing alleles. Unlike terrestrial vertebrates, piscine MSTN mRNA has been detected in several tissues including muscle, gill, skin, brain, renal, and gonadal tissue [35]; this pattern of expression suggests that MSTN is involved in numerous physiological activities such as osmoregulation, gonadal development, growth, and maturation.
No significant correlations of molecular variants and quantitative traits were revealed in the present study at the other candidate genes analyzed. However, genes within the somatotropic axis and transforming growth factor superfamily have been shown to influence growth variation in terrestrial livestock, as well as in other vertebrates [11].
We tested the null hypothesis that genotypes at one locus are independent of genotypes at the other locus, for each locus pair across the population. A locus pair located at the same gene (e.g., introns) should be in linkage disequilibrium; the results show a significant linkage disequilibrium between MSTN-1 and PRL. However, not all of them revealed this expected disequilibrium across all age groups. This is because several or many families were present in each group, and different genotypic combinations could be observed. The finding is remarkable because it indicates that genotypes of two RFLP markers (located in MSTN-1 and PRL genes) are not independent. If these loci are located on the same chromosome, they can be selected at the same time. If they are not linked, it means that some genotypic combinations of the two loci are favourable (or are selected against) under some specific conditions and they can be used in marker-assisted selection (MAS), too. Sarropoulou et al. [36] localized the S. aurata growth hormone and prolactin genes on radiation hybrid group RH24 of the gene-based radiation hybrid map of gilthead seabream. This location is very interesting because our results suggest linkage disequilibrium between PRL and MSTN-1 genes; therefore, if this disequilibrium is because the two genes are linked in the genome, a linkage between three candidate genes, PRL, MSTN-1, and GH, for putative growth-related QTLs would have been revealed.
In relation to cytogenetic mapping, the application of fluorescence in situ hybridization (FISH) to fish genetics and genomics has been widely tested (reviewed in [37]). Chromosome mapping of single copy genes is useful in isolating QTL of importance in aquaculture, and it is the first step towards linking physical and linkage maps. In fishes, to date, only one study, on D. rerio, has been found in which the MSTN-1 gene was localized on chromosome 9, close to the marker Z8363 [38]. The fact that some metaphases, in our study, showed four signals may be due to the presence of two MSTN genes in S. aurata. The relative similarity at the nucleotide level of the two myostatin cDNA genes (72%) could be enough to find some metaphase spreads with four signals. In the light of the results, the two genes (MSTN-1 and MSTN-2) are located on different chromosomes, as was found in zebrafish, where the MSTN-2 gene was situated on chromosome 22 (Zv7 of the zebrafish genome, NCBI data base). Our results show that the genotypes of MSTN-1 gene should be considered for selective improvement programmes of S. aurata and could be a start point in order to detect candidate genes for growth in other aquatic species of economic interest.
Acknowledgments
This research was supported by BIOANDALUS 08/5/l2.3 and PETRI (PTR1995-0648-OP-03-03) in collaboration with CUPIMAR S.A., grants of Junta Andalucia to the BIO-219 group, and by Grant MSM0021620858 from the Ministry of Education, Youth and Sports of the Czech Republic (V. Krylov and J. Mácha). I. Sánchez-Ramos was recipient of a fellowship from the University of Cadiz. The authors wish to thank Rosa Vázquez and all the members of the Laboratory of Marine Culture from the University of Cadiz for the larvae supplies.
References
- 1.Food and Agriculture Organization of The United Nations. Overview: Major Trends and Issues. Fisheries and Aquaculture Department, 2011.
- 2.Food and Agriculture Organization of The United Nations. Fisheries Department, Fishery Information Data and Statistics unit, 2009.
- 3.Martinez V. Marker assisted selection in fish and shellfish breeding schemes. In: Guimarães E, Ruane J, Scherf B, Sonnino A, Dargie J, editors. Marker-Assisted Selection: Current Status and Future Perspectives in Crops, Livestock, Forestry and Fish. Rome, Italy: Electronic Publishing Policy and Support Branch Communication Division, FAO; 2007. pp. 329–362. [Google Scholar]
- 4.Meuwissen THE. Marker-Assisted Selection: a Fast Track to Increase Genetic Gain in Plant and Animal Breeding? 2003. Genomic selection the future of marker-assisted selection and animal breeding. [Google Scholar]
- 5.Gross R, Nilsson J. Restriction fragment length polymorphism at the growth hormone 1 gene in Atlantic salmon (Salmo salar L.) and its association with weight among the offspring of a hatchery stock. Aquaculture. 1999;173(1–4):73–80. [Google Scholar]
- 6.Prudence M, Moal J, Boudry P, et al. An amylase gene polymorphism is associated with growth differences in the Pacific cupped oyster Crassostrea gigas . Animal Genetics. 2006;37(4):348–351. doi: 10.1111/j.1365-2052.2006.01481.x. [DOI] [PubMed] [Google Scholar]
- 7.Zhang C, Liu B, Chen H, et al. Associations of a HinfI PCR-RFLP of POU1F1 gene with growth traits in Qinchuan cattle. Animal Biotechnology. 2009;20(2):71–74. doi: 10.1080/10495390802640462. [DOI] [PubMed] [Google Scholar]
- 8.Gorbai A, Torshizi RV, Bonyadi M, Amirinia C. A MspI PCR-RFLP within bovin growth hormone gene and its association with sperm quality traits in Iranian Holstein bulls. African Journal of Biotechnology. 2009;8(19):4811–4816. [Google Scholar]
- 9.Wang Q, Li H, Leng L, et al. Polymorphism of heart fatty acid-binding protein gene associatied with fatness traits in the chicken. Animal Biotechnology. 2007;18(2):91–99. doi: 10.1080/10495390601038900. [DOI] [PubMed] [Google Scholar]
- 10.Mohammadi M, Nasiri MTB, Alami-Saeid K, Fayazi J, Mamoee M, Sadr AS. Polymorphism of calpastatin gene in Arabic sheep using PCR- RFLP. African Journal of Biotechnology. 2008;7(15):2682–2684. [Google Scholar]
- 11.de-Santis C, Jerry DR. Candidate growth genes in finfish—Where should we be looking? Aquaculture. 2007;272(1–4):22–38. [Google Scholar]
- 12.Chen TT, Shamblott M, Lin CM, et al. Structure and evolution of fish growth hormone and insulin-like growth factor genes. Perspective in Comparative Endocrinology. 1994:352–364. [Google Scholar]
- 13.McPherron AC, Lawler AM, Lee SJ. Regulation of skeletal muscle mass in mice by a new TGF-β superfamily member. Nature. 1997;387(6628):83–90. doi: 10.1038/387083a0. [DOI] [PubMed] [Google Scholar]
- 14.Maccatrozzo L, Bargelloni L, Radaelli G, Mascarello F, Patarnello T. Characterization of the myostatin gene in the gilthead seabream (Sparus aurata): sequence, genomic structure, and expression pattern. Marine Biotechnology. 2001;3(3):224–230. doi: 10.1007/s101260000064. [DOI] [PubMed] [Google Scholar]
- 15.Maccatrozzo L, Bargelloni L, Cardazzo B, Rizzo G, Patarnello T. A novel second myostatin gene is present in teleost fish. FEBS Letters. 2001;509(1):36–40. doi: 10.1016/s0014-5793(01)03124-6. [DOI] [PubMed] [Google Scholar]
- 16.Chen MHC, Lin GH, Gong HY, et al. Cloning and characterization of insulin-like growth factor I cDNA from black seabream (Acanthopagrus schlegeli) Zoological Studies. 1998;37(3):213–221. [Google Scholar]
- 17.Manzon LA. The role of prolactin in fish osmoregulation: a review. General and Comparative Endocrinology. 2002;125(2):291–310. doi: 10.1006/gcen.2001.7746. [DOI] [PubMed] [Google Scholar]
- 18.Rand-Weaver M, Kawauchi H. Growth hormone, prolactin and somatolactin: a structural overview. In: Hochachka PW, Mommsen TP, editors. Biochemistry and Molecular Biology of Fishes: Molecular Biology Frontiers. Amsterdam, The Netherlands: Elsevier; 1993. pp. 39–56. [Google Scholar]
- 19.Ng SHS, Artieri CG, Bosdet IE, et al. A physical map of the genome of Atlantic salmon, Salmo salar . Genomics. 2005;86(4):396–404. doi: 10.1016/j.ygeno.2005.06.001. [DOI] [PubMed] [Google Scholar]
- 20.Almuly R, Cavari B, Ferstman H, Kolodny O, Funkenstein B. Genomic structure and sequence of the gilthead seabream (Sparus aurata) growth hormoneencoding gene: identification of minisatellite polymorphism in intron I. Genome. 2000;43(5):836–845. doi: 10.1139/g00-051. [DOI] [PubMed] [Google Scholar]
- 21.Martínez G, Shaw EM, Carrillo M, Zanuy S. Protein salting-out method applied to genomic DNA isolation from fish whole blood. Biotechniques. 1998;24(2):238–239. doi: 10.2144/98242bm14. [DOI] [PubMed] [Google Scholar]
- 22.Porta J, Porta JM, Béjar J, Alvarez MC. Development of a microsatellite multiplex genotyping tool for the fish Gilthead seabream (Sparus aurata): applicability in population genetics and pedigree analysis. Aquaculture Research. 2010;41(10):1514–1522. [Google Scholar]
- 23.Rozen S, Skaletsky HJ. Primer3 on the WWW for general users and for biologist programmers. In: Krawetz S, Misener S, editors. Bioinformatics Methods and Protocols: Methods in Molecular Biology. Totowa, NJ, USA: Humana Press; 2000. pp. 365–386. [DOI] [PubMed] [Google Scholar]
- 24.Bikandi J, Millan RS, Rementeria A, Garaizar J. In silico analysis of complete bacterial genomes: PCR, AFLP-PCR and endonuclease restriction. Bioinformatics. 2004;20(5):798–799. doi: 10.1093/bioinformatics/btg491. [DOI] [PubMed] [Google Scholar]
- 25.Moore DS. The Basic Practice of Statistics. New York, NY, USA: W.H. Freeman; 2003. [Google Scholar]
- 26.Rice WR. Analysing tables of statistical tests. Evolution. 1989;43(1):223–225. doi: 10.1111/j.1558-5646.1989.tb04220.x. [DOI] [PubMed] [Google Scholar]
- 27.Raymond M, Rousset F. GENEPOP (version 1.2): population genetics software for exact tests and ecumenicism. Journal of Heredity. 1995;86(3):248–249. [Google Scholar]
- 28.Goudet J, Raymond M, de Meeüs T, Rousset F. Testing differentiation in diploid populations. Genetics. 1996;144(4):1933–1940. doi: 10.1093/genetics/144.4.1933. [DOI] [PMC free article] [PubMed] [Google Scholar]
- 29.Cross I, Merlo A, Manchado M, Infante C, Cañavate JP, Rebordinos L. Cytogenetic characterization of the sole Solea senegalensis (Teleostei: Pleuronectiformes: Soleidae): Ag-NOR, (GATA)n, (TTAGGG)n and ribosomal genes by one-color and two-color FISH. Genetica. 2006;128(1–3):253–259. doi: 10.1007/s10709-005-5928-9. [DOI] [PubMed] [Google Scholar]
- 30.Krylov V, Tlapakova T, Macha J. Localization of the single copy gene Mdh2 on Xenopus tropicalis chromosomes by FISH-TSA. Cytogenetic and Genome Research. 2007;116(1-2):110–112. doi: 10.1159/000097427. [DOI] [PubMed] [Google Scholar]
- 31.Grobet L, Martin LJ, Poncelet D, et al. A deletion in the bovine myostatin gene causes the double-muscled phenotype in cattle. Nature Genetics. 1997;17(1):71–74. doi: 10.1038/ng0997-71. [DOI] [PubMed] [Google Scholar]
- 32.Tang L, Yan Z, Wan Y, Han W, Zhang Y. Myostatin DNA vaccine increases skeletal muscle mass and endurance in mice. Muscle and Nerve. 2007;36(3):342–348. doi: 10.1002/mus.20791. [DOI] [PubMed] [Google Scholar]
- 33.Wang X, Meng X, Song B, Qiu X, Liu H. SNPs in the myostatin gene of the mollusk Chlamys farreri: association with growth traits. Comparative Biochemistry and Physiology B. 2010;155(3):327–330. doi: 10.1016/j.cbpb.2009.12.001. [DOI] [PubMed] [Google Scholar]
- 34.Welle S, Burgess K, Thornton CA, Tawil R. Relation between extent of myostatin depletion and muscle growth in mature mice. American Journal of Physiology. 2009;297(4):E935–E940. doi: 10.1152/ajpendo.00179.2009. [DOI] [PMC free article] [PubMed] [Google Scholar]
- 35.Radaelli G, Rowlerson A, Mascarello F, Patruno M, Funkenstein B. Myostatin precursor is present in several tissues in teleost fish: a comparative immunolocalization study. Cell and Tissue Research. 2003;311(2):239–250. doi: 10.1007/s00441-002-0668-y. [DOI] [PubMed] [Google Scholar]
- 36.Sarropoulou E, Franch R, Louro B, et al. A gene-based radiation hybrid map of the gilthead sea bream Sparus aurata refines and exploits conserved synteny with Tetraodon nigroviridis . BMC Genomics. 2007;8, article 44 doi: 10.1186/1471-2164-8-44. [DOI] [PMC free article] [PubMed] [Google Scholar]
- 37.Phillips RB. Application of fluorescence in situ hybridization (FISH) to fish genetics and genome mapping. Marine Biotechnology. 2001;3(Supplement 1):S145–S152. doi: 10.1007/s10126-001-0036-z. [DOI] [PubMed] [Google Scholar]
- 38.Xu C, Wu G, Zohar Y, Du S-J. Analysis of myostatin gene structure, expression and function in zebrafish. Journal of Experimental Biology. 2003;206(22):4067–4079. doi: 10.1242/jeb.00635. [DOI] [PubMed] [Google Scholar]