Abstract
The hepatic organic anion transporting polypeptides (OATPs) influence the pharmacokinetics of several drug classes and are involved in many clinical drug–drug interactions. Predicting potential interactions with OATPs is, therefore, of value. Here, we developed in vitro and in silico models for identification and prediction of specific and general inhibitors of OATP1B1, OATP1B3, and OATP2B1. The maximal transport activity (MTA) of each OATP in human liver was predicted from transport kinetics and protein quantification. We then used MTA to predict the effects of a subset of inhibitors on atorvastatin uptake in vivo. Using a data set of 225 drug-like compounds, 91 OATP inhibitors were identified. In silico models indicated that lipophilicity and polar surface area are key molecular features of OATP inhibition. MTA predictions identified OATP1B1 and OATP1B3 as major determinants of atorvastatin uptake in vivo. The relative contributions to overall hepatic uptake varied with isoform specificities of the inhibitors.
Introduction
Drug transporting membrane proteins are major determinants of the disposition of many registered drugs and are, therefore, of great relevance for drug safety and efficacy. This has stimulated a considerable interest in developing a better understanding of interactions with transporters already at the drug discovery stage. The organic anion transporting polypeptide 1B1 (OATP1B1/SLCO1B1) transporter is one of the most highly expressed uptake transporters in human liver.1 OATP1B1 has, along with OATP1B3 (SLCO1B3), been shortlisted as a transporter of considerable importance for drug disposition.2 The significance of OATP1B1 has further been emphasized by numerous reports regarding OATP1B1 mediated clinical drug–drug interactions (DDIs)3 as well as the identification of this transporter as an important pharmacogenomic biomarker for simvastatin-induced adverse drug effects.4 OATP1B1, OATP1B3, and the less studied OATP2B1 (SLCO2B1) transporter are all localized in the basolateral membrane of human hepatocytes. They mediate the uptake of xenobiotics and endogenous compounds from the portal bloodstream into the hepatocytes. For substrate drugs, transport proteins, such as the OATPs, determine intracellular concentrations and, hence, exposure to drug metabolizing enzymes. Examples of drugs and drug classes that are substrates of the OATPs are 3-hydroxy-3-methylglutaryl-coenzyme A (HMG-CoA) inhibitors (statins), bosentan, and angiotensin II-receptor antagonists.2,3 Although there is a large substrate overlap between the three hepatic OATPs, some compounds have been described as specific substrates of one or another of the OATPs, e.g., pitavastatin and prostaglandin E2 as OATP1B1 specific substrates,5 and paclitaxel and the gastrointestinal peptide hormone cholecystokinin octapeptide (CCK-8) as OATP1B3 specific substrates.3,6
Although, we have a relatively good understanding of OATP substrates as well as OATP1B1 interacting drugs to date (cf. refs (3,7)), limited data is available regarding OATP1B3 and OATP2B1 interacting drugs. So far, no global comparisons of the known OATP interacting drugs, nor of the molecular features of importance for inhibition of the three OATPs in the human liver, have been made. Knowledge about specific and general inhibitors of these transporters would be of great value in revealing transport in complex systems like hepatocytes.
A crucial factor for increasing the knowledge and predictability of drug disposition is the establishment of in vitro to in vivo correlations. A prerequisite for assessing and comparing the importance of transport proteins, as well as the impact of drug interactions in vivo, is knowledge of the maximal transport activity (MTA) of each transport protein in the tissue of interest; in this case, of OATPs in the human liver. Because deep tissue measurements cannot be routinely performed in humans for ethical reasons, ways to extrapolate in vitro activity to in vivo conditions need to be developed. The transport activity is dependent on the amount of functional transporter. Therefore, information about tissue expression of transport proteins would be beneficial in the estimation of MTA, and for the subsequent prediction of the impact of various DDIs.
The aims of this study were: (i) to identify specific and general inhibitors of the three hepatic OATPs (OATP1B1, OATP1B3, and OATP2B1), (ii) to study the inhibition patterns of OATP1B1, OATP1B3, and OATP2B1 and the molecular features that determine inhibition, and (iii) to determine the protein expression of OATP1B1, OATP1B3, and OATP2B1 in human liver and in in vitro cell models in order to calculate the maximal hepatic transport activity and, thereby, predict the importance of each OATP for uptake clearance (CL) and DDIs in vivo.
To meet these aims, we developed in vitro screening models for rapid identification of OATP inhibition. We have applied these models to investigate the inhibition potential of 225 drugs and drug-like compounds on OATP1B1, OATP1B3, and OATP2B1 mediated transport. Our experimental data were used to develop multivariate computational models predicting specific or general OATP interactions based on physicochemical properties of the studied compounds. For a selected subset of 13 compounds, concentration dependent inhibition of each OATP was studied and compounds that could be used as selective or general OATP inhibitors were identified. Further, the protein expression of OATP1B1, OATP1B3, and OATP2B1 was determined in human liver and in the in vitro cell models. The results were used to calculate the intrinsic hepatic uptake CL of atorvastatin for each OATP and to determine the contribution of each transport protein to drug interactions, using a subset of identified inhibitors.
Results
Characteristics of the Data Set
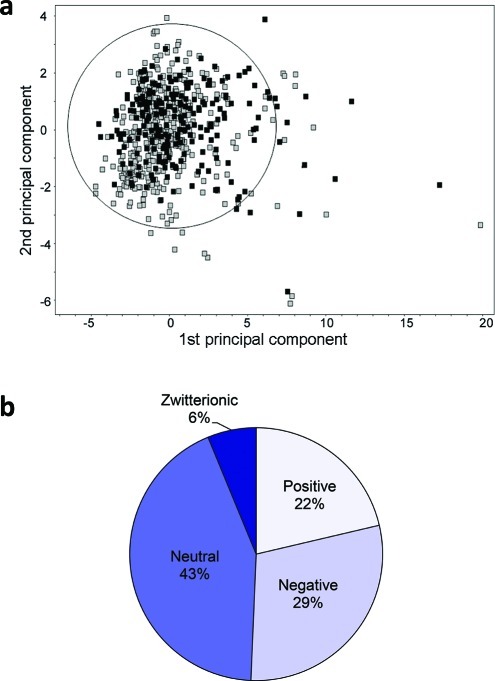
The data set of 225 compounds used in this study was selected mainly from the chemical space of oral drugs. An in-house data set of 142 compounds, enriched in OATP inhibitors,7 was used as a starting point. This data set was expanded with compounds known to interact with other hepatic transporters and with the major cytochrome P450 (CYP) enzymes involved in drug elimination, giving a final data set of 225 compounds. A principal component analysis (PCA) of the data set resulted in two significant components that described 78% of the chemical variation of the data set. The first principal component was mainly governed by polarity and hydrogen bonding, while the second principal component was mainly described by lipophilicity. The data set was well distributed in the oral drug space (see Figure 1a). Outliers included large compounds such as rifampicin and cyclosporine A.
Figure 1.
Principal components analysis (PCA) of an oral drug reference data set8 (gray squares; n = 529) and the data set of 225 compounds investigated for OATP inhibition (black squares; n = 225) (a). The circle indicates the 95% confidence interval of the PCA for the oral drug reference data set. The first principal component (x-axis) is governed by polarity and hydrogen bonding, which increases to the right, whereas the second principal component (y-axis) is governed by lipophilicity, which increases upward. Distribution of molecular charge at pH 7.4 of the 225 compounds investigated for OATP inhibition (b).
The physicochemical descriptors of all the compounds are summarized in Table 1 and in Supporting Information Table 1. The molecular weight distribution ranged from 94.1 to 1214.6 g/mol, with a mean ± standard deviation of 401.6 ± 191.3 g/mol, which is higher than the mean of orally administered drugs (347 ± 162 g/mol8). This is a result of the inclusion of compounds known to interact with the OATPs, e.g., protease inhibitors, which tend to be larger than average oral drugs.7 The lipophilicity, as indicated by NNLogP, varied between −2.8 and 7.2, with a mean of 2.7 ± 1.9 and the average polar surface area (PSA) was 96.1 ± 70.2 Å2, which is in line with the range of conventional registered oral drugs. The data set included 22% positively charged compounds, 29% negatively charged compounds, 43% neutral compounds, and 6% zwitterionic compounds at pH 7.4 (see Figure 1b). Because the data set was enriched in compounds interacting with the OATP transporters (i.e., mainly neutral or negatively charged compounds),7 a higher fraction of neutral and negatively charged compounds was found in this data set compared to the corresponding fraction in the oral drug space.
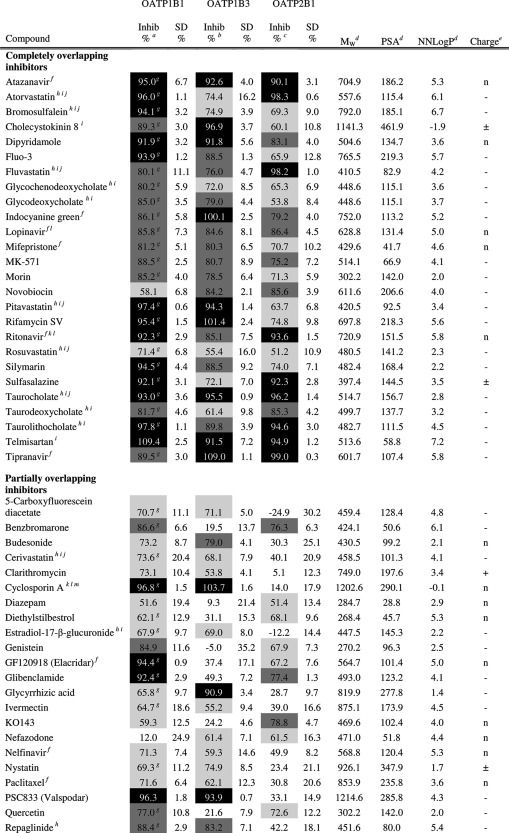
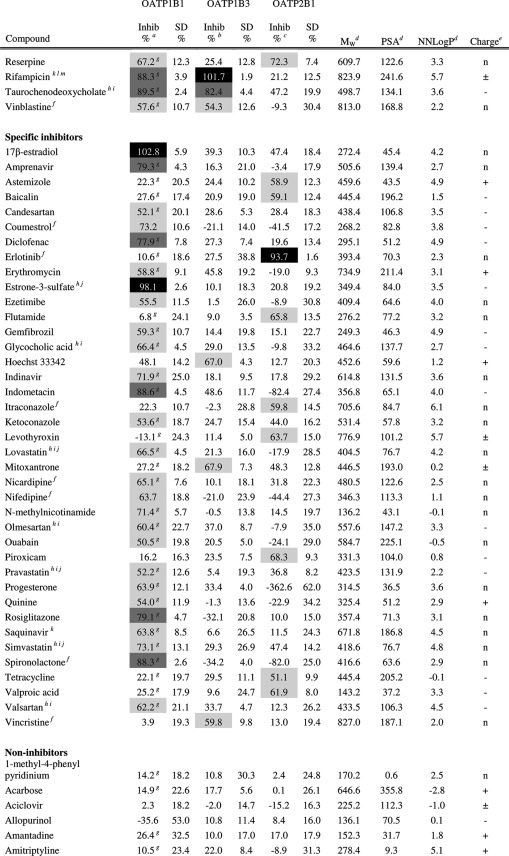
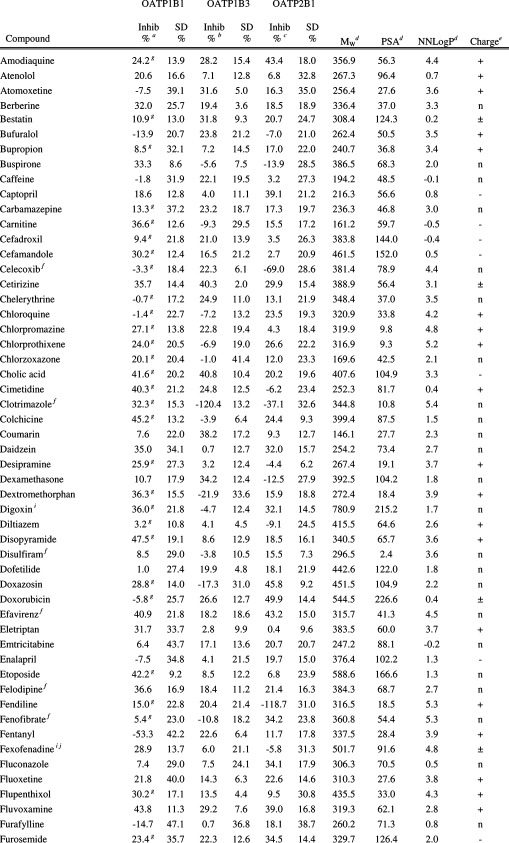
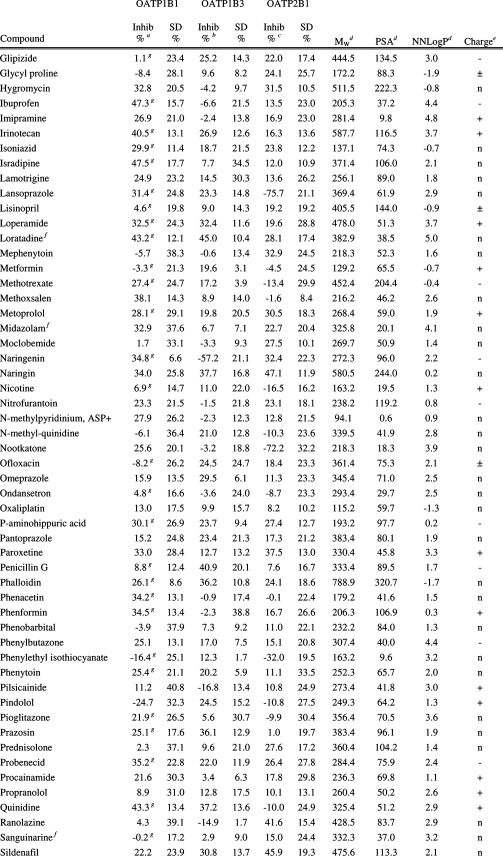
Table 1. Inhibitory Effect on OATP1B1, OATP1B3, and OATP2B1 Mediated Transport and Molecular Descriptors of the 225 Investigated Compounds (The Complete Table Including Additional Molecular Descriptors Can Also Be Found in Supporting Information Table 1.).
Inhibition of OATP1B1 mediated E17βG uptake at 20 μM. Substrate concentration used was 0.52 μM.
Inhibition of OATP1B3 mediated E17βG uptake at 20 μM. Substrate concentration used was 1.04 μM.
Inhibition of OATP2B1 mediated E3S uptake at 20 μM. Substrate concentration used was 1.02 μM.
AZ oeSelma descriptors generated from SMILES (Supporting Information Table 4). Compounds were treated in their neutral states.
Predicted charge at pH 7.4 (based on pKa values obtained using ADMET Predictor (SimulationsPlus, Lancaster, CA, USA)). + and – denotes positively and negatively charged compounds, respectively. n denotes neutral compounds and ± denotes zwitterionic compounds.
Predicted solubility (using ADMET Predictor (SimulationsPlus, Lancaster, CA, USA)) in water at pH 7.4 is lower than 20 μM. However, it should be noted that all compounds are first dissolved in DMSO and further diluted with HBSS buffer giving a final DMSO concentration ≤1% in all experiments.
Values from Karlgren et al.7
Compounds or compound groups suggested as OATP1B1 substrates by Giacomini et al.2
Compounds or compound groups suggested as OATP1B3 substrates by Giacomini et al.2
Compounds or compound groups suggested as OATP2B1 substrates by Giacomini et al.2
Compounds suggested as OATP1B1 inhibitors by Giacomini et al.2
Compounds suggested as OATP1B3 inhibitors by Giacomini et al.2
Compounds suggested as OATP2B1 inhibitors by Giacomini et al.2
Transport Kinetics
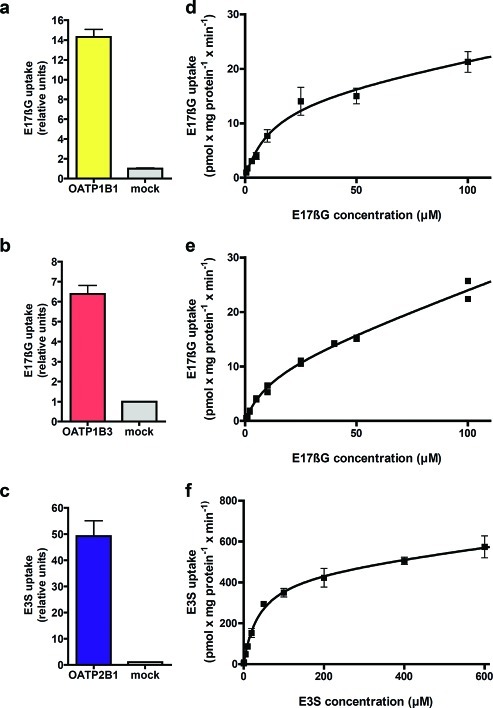
Human embryonic kidney 293 (HEK293) cells were stably transfected with OATP1B1, OATP1B3, or OATP2B1. On the basis of all experiments (n = 12 (OATP1B1), n = 66 (OATP1B3), n = 51 (OATP2B1)), the mean uptake of the model substrates, estradiol-17β-glucuronide (E17βG) or estrone-3-sulfate (E3S) in the OATP expressing HEK293 cells, increased 13 times (OATP1B1), 6.5 times (OATP1B3), and 44 times (OATP2B1) compared to the passive uptake in mock-transfected cells (for a representative experiment see Figure 2a–c). The uptake curves of model substrates and atorvastatin (used in the in vitro–in vivo extrapolations), as well as resulting kinetic parameters, are in line with available published data7,9 and are presented in Figure 2d–f, Table 2, and Supporting Information Figure 1. For all curves, both a saturable (OATP dependent) and a linear (passive diffusion) component were observed.
Figure 2.
Uptake of estradiol-17β-glucuronide (E17βG) in OATP1B1 (a) and OATP1B3 (b) and of estrone-3-sulfate (E3S) in OATP2B1 expressing HEK293 cells (c) as compared to the passive uptake in mock transfected cells in one representative experiment. Substrate concentrations used were 0.52, 1.04, and 1.02 μM for OATP1B1, OATP1B3, and OATP2B1, respectively. Bars represent mean ± standard deviation (OATP1B1 and OATP2B1) or mean ± range (OATP1B3). Michaelis–Menten kinetics of model substrate uptake in HEK293 cells stably expressing the OATP1B1 (d), OATP1B3 (e), or OATP2B1 (f) transporter. The intracellular accumulation of the radiolabeled substrates was measured on a scintillation counter. Each data point in the OATP1B1 and OATP2B1 curves represents the mean uptake ± standard error, whereas in the OATP1B3 curve, each replicate is shown.
Table 2. Kinetic Parameters of OATP1B1, OATP1B3, and OATP2B1 Mediated Transport.
| substrate | Km (μM) | Vmax (pmol/mg protein/min) | Vmax/Km (μL/mg protein/min) | |
|---|---|---|---|---|
| OATP1B1 | estradiol-17β-glucoronide | 12.20 ± 5.94 | 15.44 ± 3.44 | 1.27 |
| OATP1B3 | estradiol-17β-glucoronide | 11.69 ± 3.80 | 10.12 ± 1.78 | 0.86 |
| OATP2B1 | estrone-3-sulfate | 38.24 ± 10.19 | 455.2 ± 55.36 | 11.90 |
| OATP1B1a | atorvastatin | 0.77 ± 0.24 | 6.61 ± 1.24 | 8.58 |
| OATP1B3 | atorvastatin | 0.73 ± 1.45 | 2.29 ± 1.45 | 3.14 |
| OATP2B1 | atorvastatin | 2.84 ± 1.63 | 24.27 ± 8.12 | 8.55 |
Values from Karlgren et al.7
Interaction with the OATP Transporters
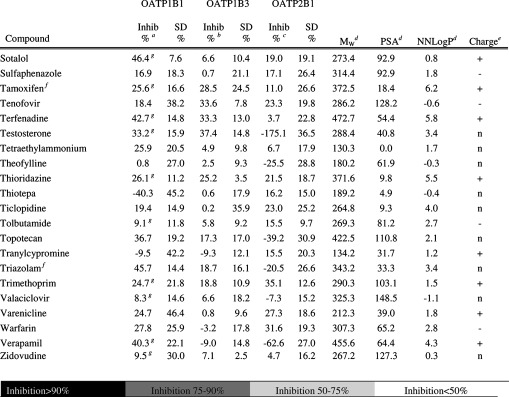
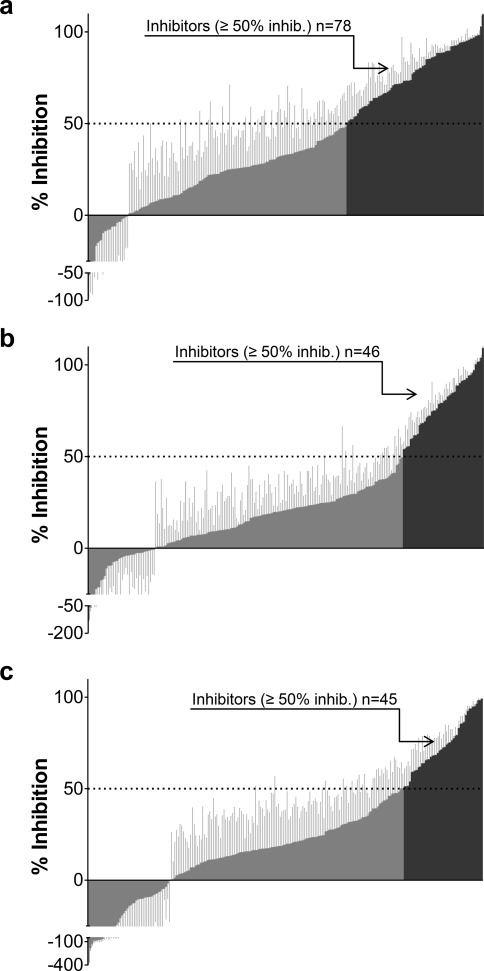
The screening of the 225 compounds for interaction with each individual OATP was performed at a concentration of 20 μM, as described in the Experimental Details. A compound was classified as an inhibitor if it significantly decreased the uptake of model substrate by at least 50%. In the OATP1B1 interaction study, 78 (35%) of the 225 compounds analyzed were classified as OATP1B1 inhibitors (see Figure 3 and Table 1). Of these, four compounds (coumestrol, diazepam, nifedipine, and novobiocin) have not, to our knowledge, previously been reported to interact with OATP1B1. In the OATP1B3 and OATP2B1 interaction studies, 46 (20%) and 45 (20%) inhibitors were identified, respectively (Figure 3 and Table 1). Of the 46 identified inhibitors of OATP1B3, 16 have not, to our knowledge, previously been reported to interact with OATP1B3. Of the 45 compounds identified as OATP2B1 inhibitors, 29 compounds were identified as novel inhibitors and have not, to our knowledge, been reported to interact with OATP2B1 in any other studies. All novel OATP inhibitors identified in this study are summarized in Table 3.
Figure 3.
Inhibition potency of all 225 compounds on OATP1B1 (a), OATP1B3 (b), and OATP2B1 mediated transport (c) at a concentration of 20 μM. Values are presented as mean percent inhibition ± standard deviation. The 50% cutoff value is indicated by the dashed lines. Compounds identified as inhibitors (inhibition ≥50%) are shown in dark gray, while compounds identified as noninhibitors or stimulators are shown in medium gray. In total, 78, 46, and 45 inhibitors of OATP1B1, OATP1B3, and OATP2B1 were identified, respectively. For OATP1B1, inhibition values for 142 of the 225 compounds were taken from the study by Karlgren et al.7.
Table 3. Novel OATP Inhibitors Identified.
| compound | new inhibitor of | previously known OATP interaction | ref |
|---|---|---|---|
| 5-carboxyfluorescein diacetate (5-CFDA) | OATP1B3 | OATP1B1 inhibitor | (7) |
| astemizole | OATP2B1 | ||
| baicalin | OATP2B1 | ||
| benzbromarone | OATP2B1 | OATP1B1 inhibitor | (7,49) |
| cholecystokinin octapeptide (CCK-8) | OATP2B1 | OATP1B1 substrate and inhibitor, OATP1B3 substrate, Oatp1b2 substrate, Oatp1b4 substrate | (5a,6a,7,50) |
| coumestrol | OATP1B1 | ||
| diazepam | OATP1B1, OATP2B1 | ||
| diethylstilbestrol | OATP2B1 | OATP1B1 inhibitor | (7) |
| dipyridamole | OATP1B3, OATP2B1 | OATP1B1 inhibitor | (7) |
| erlotinib | OATP2B1 | ||
| fluo-3 | OATP2B1 | OATP1B3 substrate | (51) |
| flutamide | OATP2B1 | ||
| genistein | OATP2B1 | OATP1B1 inhibitor | (52) |
| GF120918 (elacridar) | OATP2B1 | OATP1B1 inhibitor | (7) |
| glycochenodeoxycholate | OATP1B3,OATP2B1 | OATP1B1 inhibitor, Oatp1a5 substrate | (7,53) |
| glycodeoxycholate | OATP1B3,OATP2B1 | OATP1B1 inhibitor, Oatp1a5 substrate | (7,53) |
| Hoechst 33342 | OATP1B3 | ||
| indocyanine green | OATP2B1 | OATP1B3 substrate, OATP1A2, OATP1B1, OATP1B3, Oatp2a1, Oatp1a1 and Oatp1c1 inhibitor | (54) |
| itraconazole | OATP2B1 | ||
| ivermectin | OATP1B3 | OATP1B1 inhibitor | (7) |
| KO143 | OATP2B1 | ||
| levothyroxin | OATP2B1 | OATP1A2, OATP1B1, OATP1C1, Oatp1a4, Oatp1a5, Oatp1c1 and Oatp4a1 substrate | (55) |
| morin | OATP1B3,OATP2B1 | OATP1B1 substrate and inhibitor | (52) |
| nefazodone | OATP1B3, OATP2B1 | ||
| nelfinavir | OATP1B3 | OATP1A2, OATP1B1 and OATP2B1 inhibitor | (56) |
| nifedipine | OATP1B1 | ||
| novobiocin | OATP1B1, OATP1B3, OATP2B1 | ||
| nystatin | OATP1B3 | OATP1B1 inhibitor | (7) |
| piroxicam | OATP2B1 | ||
| PSC833 (valspodar) | OATP1B3 | OATP1B1, Oatp1 and Oatp2 inhibitor | (56a,57) |
| reserpine | OATP2B1 | OATP1B1 inhibitor | (7) |
| silymarin | OATP1B3, OATP2B1 | OATP1B1 inhibitor | (52,58) |
| sulfasalazine | OATP1B3, OATP2B1 | OATP1B1 inhibitor | (7) |
| taurodeoxycholate | OATP2B1 | OATP1B3, Oatp1a1 and Oatp1a5 substrate | (53b,53c) |
| taurolithocholate | OATP1B3, OATP2B1 | OATP1B1 substrate, OATP1B1 and skate Oatp inhibitor | (7,59) |
| tetracycline | OATP2B1 | ||
| tipranavir | OATP1B3 | OATP1B1 and OATP2B1 inhibitor | (7,60) |
| valproic acid | OATP2B1 |
A few compounds stimulated, rather than inhibited, the OATP mediated transport (see Figure 3 and Table 1). Using an equivalent definition of stimulators as of inhibitors, i.e., a stimulator increases the transport of substrate at least 2-fold, clotrimazole was identified as a stimulator of OATP1B3 mediated uptake of E17βG, while fendiline, progesterone, and testosterone were found to stimulate the transport of E3S by OATP2B1. Of these identified stimulators, fendiline is a novel OATP2B1 stimulator, not previously reported to interact with any OATP. Stimulation of OATP1B3 and OATP2B1 mediated uptake by clotrimazole and progesterone has been reported previously.10,11 Testosterone, here identified as an OATP2B1 stimulator, has previously been reported to be an OATP2B1 inhibitor.11 This result is analogous with, e.g., results for the ABC transporter multidrug resistance associated protein 2 (MRP2), where interacting compounds have been shown to serve as both stimulators and inhibitors depending on concentration used and other experimental factors.12
Identification of OATP Inhibitor Overlap Using the Single-Point Inhibition Results
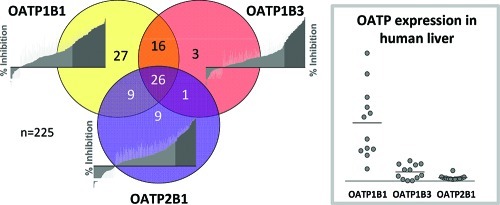
In total, 91 of the 225 investigated compounds were identified to interact with one or more of the three OATP transporters. The number of OATP1B1 inhibitors was almost twice as high as those of OATP1B3 or OATP2B1 (see previous section). Twenty-seven compounds that only inhibit OATP1B1 were identified from the screens. This can be compared with three and nine compounds classified as specific inhibitors of OATP1B3 and OATP2B1, respectively (see Figure 4 and Table 1). The three hepatic OATP transporters displayed a large inhibitor overlap, with 26 compounds identified as common inhibitors. OATP1B1 and OATP1B3 had the greatest similarity in inhibition pattern, with 42 inhibitors in common. Of these, 16 did not significantly decrease OATP2B1 mediated transport at 20 μM used in the screening assay. In contrast, only one compound (nefazodone) was identified as an inhibitor of both OATP1B3 and OATP2B1 while not interacting with OATP1B1.
Figure 4.
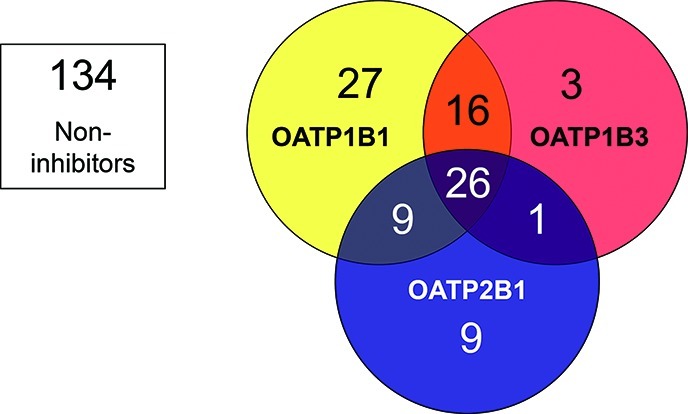
Inhibitor overlap for the three investigated OATP transporters OATP1B1 (yellow), OATP1B3 (red), and OATP2B1 (blue). In total, 91 (40%) of the 225 compounds screened inhibited at least one of the OATP transporters studied. The number of specific inhibitors of OATP1B1, OATP1B3, and OATP2B1 were 27, 3, and 9, respectively. Larger inhibitor overlaps were seen between OATP1B1 and OATP1B3, and between OATP1B1 and OATP2B1, than between OATP1B3 and OATP2B1. As many as 26 compounds were identified as inhibitors of all three transporters at the studied concentration (20 μM).
Of the 225 compounds included in this study, 67 substances are suggested as CYP substrates, inhibitors, or inducers by the Food and Drug Administration (FDA) and/or the European Medicines Agency (EMA).13 Twenty-one of these 67 compounds also inhibited one or several of the OATP transporters, indicating an interaction overlap between OATP transporters and CYP enzymes. The largest overlap was seen for CYP2C8 where 73% of the interacting compounds also inhibited one or several of the OATP transporters, as illustrated in Supporting Information Figure 2. These results are now further investigated in our group.
Molecular Characteristics of the OATP Inhibitors
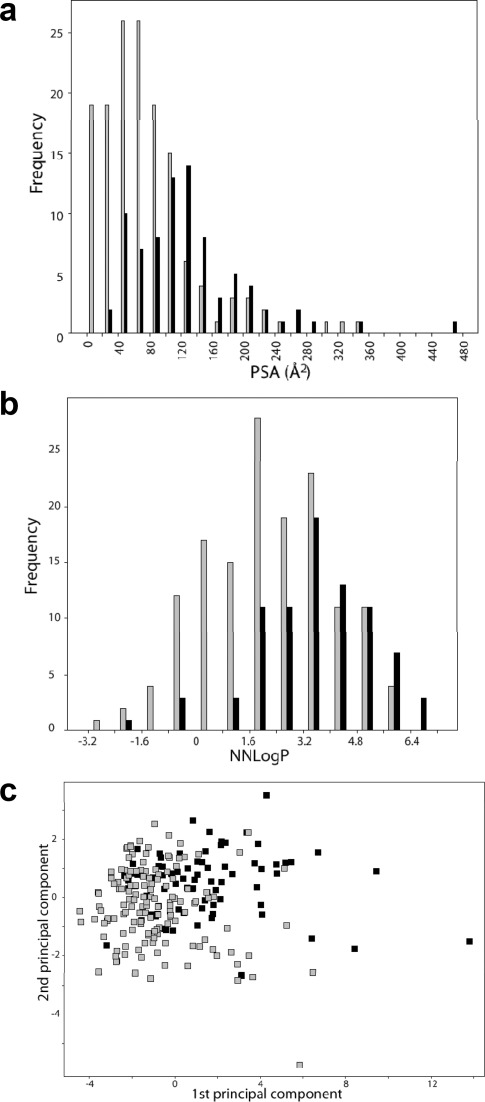
The identified inhibitors were compared with the noninhibitors with regard to physicochemical properties. Compounds that stimulated substrate uptake were excluded from the analysis of each data set. In general, the identified OATP inhibitors had a significantly higher lipophilicity, a larger molecular weight, and a larger PSA compared to noninhibitors (see Table 4 and Figure 5a–b). As expected from the annotation of OATPs as anion transporters, a significantly larger fraction of negatively charged compounds was found among the inhibitors. The importance of lipophilicity, as well as polarity and hydrogen bonding, for OATP inhibition was also evident from the PCA of the data set, where the inhibitors were clustered in the upper right corner of the PCA graph (with the first principal component mainly described by polarity and hydrogen bonding, and the second principal component mainly governed by lipophilicity) as shown in Figure 5c.
Table 4. Difference in Physicochemical Properties between Inhibitors (≥ 50% Inhibition) and Noninhibitors (0–50% Inhibition) of OATP1B1, OATP1B3, and OATP2B1, Respectively (Median Descriptor Values Are Presented).
| OATP1B1 |
|||
|---|---|---|---|
| property | inhibitors n = 78 |
noninhibitors n = 123 |
significance p |
| NNLogP | 3.6 | 2.3 | <0.0001 |
| polar surface area (Å2) | 121 | 66 | <0.0001 |
| nonpolar surface area (Å2) | 454 | 307 | <0.0001 |
| total surface area (Å2) | 564 | 363 | <0.0001 |
| molecular weight (g/mol) | 481 | 325 | <0.0001 |
| negative charge (%) | 53 | 18 | <0.0001 |
| hydrogen bond acceptors | 5 | 3 | <0.0001 |
| hydrogen bond donors | 2 | 2 | ns |
| OATP1B3 |
|||
|---|---|---|---|
| property | inhibitors n = 46 |
noninhibitors n = 141 |
significance p |
| NNLogP | 3.8 | 2.7 | 0.0001 |
| polar surface area (Å2) | 142 | 70 | <0.0001 |
| nonpolar surface area (Å2) | 492 | 307 | <0.0001 |
| total surface area (Å2) | 609 | 369 | <0.0001 |
| molecular weight (g/mol) | 514 | 336 | <0.0001 |
| negative charge (%) | 59 | 23 | <0.0001 |
| hydrogen bond acceptors | 7 | 3 | <0.0001 |
| hydrogen bond donors | 3 | 2 | 0.0007 |
| OATP2B1 |
|||
|---|---|---|---|
| property | inhibitors n = 45 | noninhibitors n = 133 | significance p |
| NNLogP | 4.0 | 2.3 | <0.0001 |
| polar surface area (Å2) | 115 | 74 | 0.0005 |
| nonpolar surface area (Å2) | 456 | 316 | 0.0004 |
| total surface area (Å2) | 551 | 369 | <0.0001 |
| molecular weight (g/mol) | 482 | 333 | <0.0001 |
| negative charge (%) | 60 | 24 | <0.0001 |
| hydrogen bond acceptors | 5 | 4 | 0.0012 |
| hydrogen bond donors | 2 | 2 | n.s. |
Figure 5.
Differences in molecular properties between inhibitors and noninhibitors of the OATPs. Distribution of polar surface area (PSA) (a) and lipophilicity (NNLogP) (b) for the OATP inhibitors (black bars) and the noninhibitors (gray bars). The OATP inhibitors have a significantly higher PSA and lipophilicity than the noninhibitors, as assessed using the nonparametric Mann–Whitney U test. Principal component analysis (PCA) of the 225 compounds investigated for OATP inhibition (c). OATP inhibitors are shown as black squares and noninhibitors as gray squares. The first principal component (x-axis) is governed by polarity and hydrogen bonding, which increases to the right, whereas the second principal component (y-axis) is governed by lipophilicity, which increases upward.
Although the physicochemical properties identified as important for inhibition of each of the three OATPs were similar, some differences were observed. While inhibitors of OATP1B3 had more hydrogen bond donors than noninhibitors, no significant difference in the number of hydrogen bond donors was observed between the inhibitor and noninhibitor group of OATP1B1 and OATP2B1. In addition, OATP2B1 inhibitors seemed to be less dependent on polarity than OATP1B1 and OATP1B3 inhibitors based on the importance of PSA (see Table 4).
In Silico Prediction of OATP Inhibition
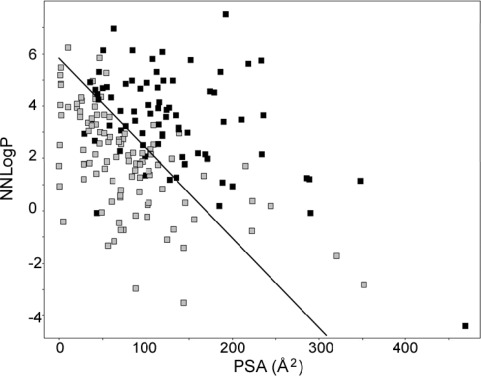
A computational multivariate partial least-squares projection to latent structures (PLS) model, discriminating inhibitors of any OATP transporter from noninhibitors, was developed. This resulted in a model based on only two molecular descriptors, NNLogP and PSA. The model was able to predict OATP inhibitors with accuracies of 85% and 79% for the training and test set, respectively. The line of optimal separation between the two classes (as depicted in Figure 6) was described by the following equation:
| 1 |
Figure 6.
Discrimination between inhibitors and noninhibitors of the OATPs using two variables only: NNLogP and PSA. The corresponding model separated the two classes (here visualized with a black line) with an accuracy of 85% for the training set and 79% for the test set.
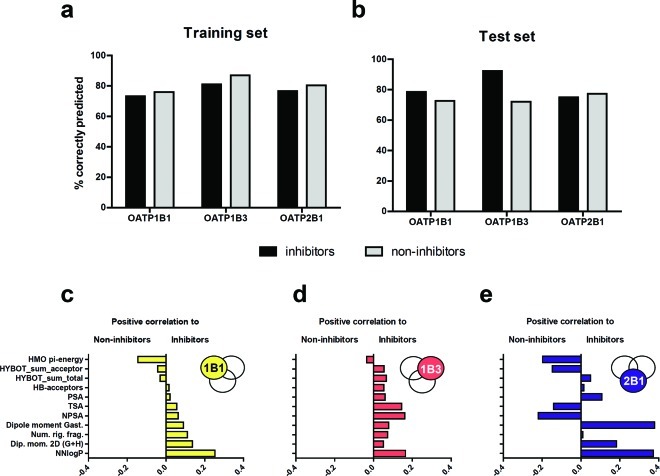
In addition, multivariate PLS models, discriminating inhibitors of each individual OATP from noninhibitors, were also developed. The final models predicted OATP1B1, OATP1B3, and OATP2B1 inhibitors with accuracies of 73%, 81%, and 77%, respectively, for the training sets and 79%, 92%, and 75%, respectively, for the test sets (see Figure 7a–b). The classification cutoff values14 for the three models, i.e., OATP1B1, OATP1B3, and OATP2B1, were 0.40, 0.36, and 0.32, respectively, as determined by the training sets. The resulting regression coefficients, reflecting lipophilicity, dipole moment, polarity, nonpolarity, hydrogen bonding, orbital π-energy, size, and rigidity, for the three discriminating models are depicted in Figure 7c–e.
Figure 7.
Accuracy of the prediction of OATP1B1, OATP1B3, and OATP2B1 inhibitors and noninhibitors in the training set (a) and in the test set (b) for the developed individual PLS models. The bars represent the percentage of correctly classified inhibitors (black) and noninhibitors (gray). Comparison of the PLS regression coefficients for the molecular descriptors included in the final discriminating models and their correlation to inhibitors, or noninhibitors, for the OATP1B1 (c), OATP1B3 (d), and OATP2B1 model (e). Descriptors with large absolute coefficients have a large influence on the discriminant model. The included descriptors are Hückel molecular orbital π-energy (HMO pi-energy), total hydrogen bond acceptor strength (HYBOT_sum_acceptor), total hydrogen bond (hydrogen bond acceptors and donors) strength (HYBOT_sum_total), number of hydrogen bond acceptors (HB-acceptors), polar surface area (PSA), total surface area (TSA), nonpolar surface area (NPSA), dipole moment based on Gasteiger atomic charges (Dipole moment Gast.), number of rigid fragments in the molecule (Num. rig. frag.), two-dimensional dipole moment (Dip. mom. 2D (G+H)) and lipophilicity (NNLogP).
Specific and General OATP Inhibitors Based on IC50 Determinations
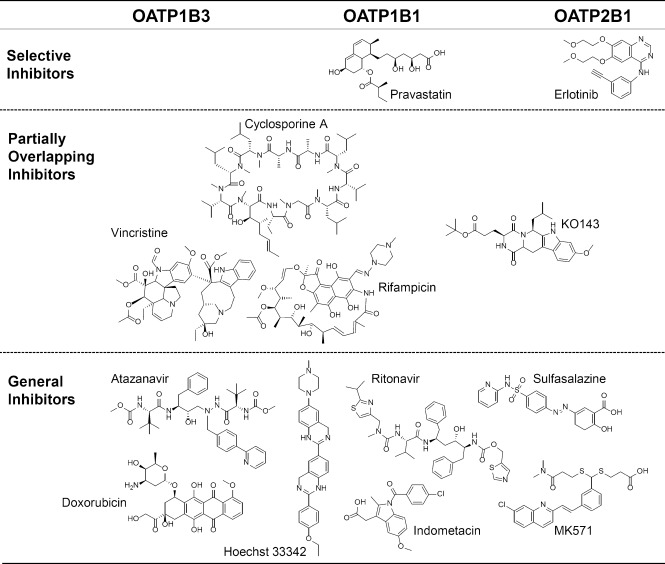
From the overlapping and specific OATP inhibitors in Table 1, a subset of 13 compounds was chosen for determinations of half-maximal inhibitory concentrations (IC50) and subsequent inhibition constants (Ki). The subset included three compounds previously suggested as general OATP inhibitors (cyclosporine A, rifampicin, and ritonavir)2 and three compounds commonly used as inhibitors of different efflux (ABC) transporters (Hoechst 33342, KO143, and MK571).8 In addition, to include potential “OATP specific” inhibitors in a broader sense, OATP inhibitors not previously identified as inhibitors of multidrug resistance protein 1 (MDR1), breast cancer resistance protein (BCRP), MRP2, and/or organic cation transporter 1 (OCT1) in published studies8,15 were included based on the single-point inhibition studies. Of these, five compounds were classified as specific inhibitors of one of the OATP transporters (indometacin, vincristine, doxorubicin, erlotinib, and pravastatin) and two compounds were classified as general OATP inhibitors (atazanavir and sulfasalazine). Chemical structures of the 13 compounds are provided in Figure 8.
Figure 8.
Molecular structures of the 13 inhibitors selected for experimental determination of IC50 values. Compounds identified as selective inhibitors of a single OATP transporter are shown in the top section. Partially overlapping inhibitors (i.e., inhibiting two of the three OATP transporters) are shown in the middle section, and below, in the bottom section, general inhibitors of the OATPs are displayed. The inhibitors are grouped according to transporter preference based on the IC50 experiments (see Results). For KO143, complete inhibition curves could not be generated and, hence, its placement was based on the highest concentration used.
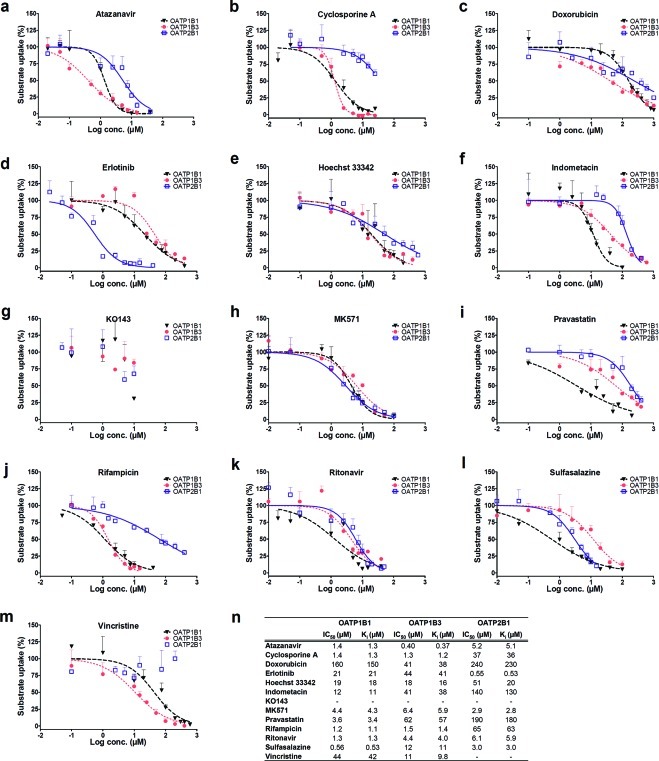
IC50 curves, IC50, and Ki values of the 13 compounds are summarized in Figure 9. Because low substrate concentrations were used in all experiments (i.e., well below Km), the calculated Ki values were close to the experimentally determined IC50 values for all compounds. The obtained IC50 curves verified the trend seen in the single-point inhibition assays. Using the same definition of an inhibitor as in the single-point inhibition studies, i.e., an IC50 ≤ 20 μM, 34 of the 35 IC50 values resulted in the same classification as in the single-point inhibition assays. The only exception was Hoechst 33342, which did not classify as an OATP1B1 inhibitor in the single-point inhibition assay (48% inhibition at 20 μM) but had an IC50 value of 19 μM.
Figure 9.
Concentration dependent inhibitory effect of atazanavir (a), cyclosporine A (b), doxorubicin (c), erlotinib (d), Hoechst 33342 (e), indometacin (f), KO143(g), MK571 (h), pravastatin (i), rifampicin (j), ritonavir (k), sulfasalazine (l), and vincristine (m) on OATP1B1 (black triangles, dashed black line), OATP1B3 (red circles, dotted red line), and OATP2B1 (open squares, solid blue line) mediated transport. IC50 and Ki values were determined using Prism v.4.02 (GraphPad Software, La Jolla, CA, USA) and eqs 4–5. Tabulated IC50 and Ki values of the 13 selected compounds (n). Erlotinib and pravastatin show selective inhibition of OATP2B1 and OATP1B1, respectively. Cyclosporine A and rifampicin can be considered as OATP1B1/OATP1B3 inhibitors with IC50 values of 1.2–1.5 μM for both OATP1B1 and OATP1B3 but more than one log unit higher IC50 values (about 30–40 times higher) for OATP2B1. A similar pattern is seen for vincristine, although this compound is a weaker OATP1B1/OATP1B3 inhibitor. Indometacin and sulfasalazine were borderline general inhibitors but with a preference for OATP1B1. Atazanavir, doxorubicin, Hoechst 33342, MK571, and ritonavir had comparable affinity for the three OATP transporters with IC50 values being within one log unit.
As in our previous study on ABC transporters, we classified an inhibitor as selective if it had a greater than 10-fold lower IC50 value as compared to those of the other two OATP transporters.8 Using this definition, pravastatin (IC50 of 3.6 μM) and erlotinib (IC50 of 0.55 μM) were classified as selective inhibitors of OATP1B1 and OATP2B1, respectively. Cyclosporine A and rifampicin, both previously proposed for use as general OATP inhibitors,2 were identified as OATP1B1/OATP1B3 inhibitors in the single-point inhibition assays. The IC50 determination confirmed these findings. Vincristine, identified as a specific inhibitor of OATP1B3 in the single-point inhibition assays, only had a 4-fold lower IC50 value for OATP1B3 than for OATP1B1 (11 μM compared to 44 μM) and was thus, like cyclosporine A and rifampicin, classified as an OATP1B1/OATP1B3 inhibitor. Atazanavir, MK571, and ritonavir were here identified as general OATP inhibitors (IC50 values within one log unit) with IC50 values ranging between 0.4 and 5.2 μM, 2.9 and 6.4 μM, and 1.3 and 6.1 μM, respectively. Hoechst 33342 was also classified as a general OATP inhibitor, although with a preference for OATP1B1/OATP1B3 and higher IC50 values as compared to the general inhibitors listed above. Indometacin and sulfasalazine were classified as borderline general inhibitors but with a preference for OATP1B1. Doxorubicin inhibited all three transporters but at even higher concentrations (IC50 values of 41–240 μM). Because of low solubility, complete inhibition curves could not be generated for the BCRP specific inhibitor KO143. However, because this compound completely inhibits BCRP at a lower concentration (1 μM)8 than concentrations affecting the OATPs, we conclude that it retained its BCRP specificity.
Prediction of IC50 Values from Inhibition Studies at a Single Concentration
In parallel to experimental IC50 determinations, IC50 values for the selected subset of 13 compounds were predicted based on the percent inhibition obtained at 20 μM in the single-point inhibition experiments using eq 6 (see Experimental Details). These predicted IC50 values were compared to the experimentally determined values. The predicted IC50 values agreed reasonably well with the experimental values (see Supporting Information Figure 3). Only two predicted values were more than 10-fold different from the experimental values, and, in total, 68% of the predicted values were less than 3-fold different from the obtained values. This observation further supports the applicability of simple screening protocols such as those used in this study.
Prediction of Hepatic Intrinsic Uptake Clearance from Maximal Transport Activity
To accurately assess the importance of the three hepatic OATPs in vivo, determination of the MTA of each transport protein in the human liver is required. Because transport capacity is related to the amount of functional transport protein, we determined the membrane protein expression in human liver samples and in our in vitro cell models. We then related the protein expression to observed maximal transport rates (Vmax values) in the in vitro systems and used these data together with expression data from the human liver to calculate the MTA in vivo (see eq 7).
Relative and Targeted Protein Quantification of OATP Expression in Human Liver
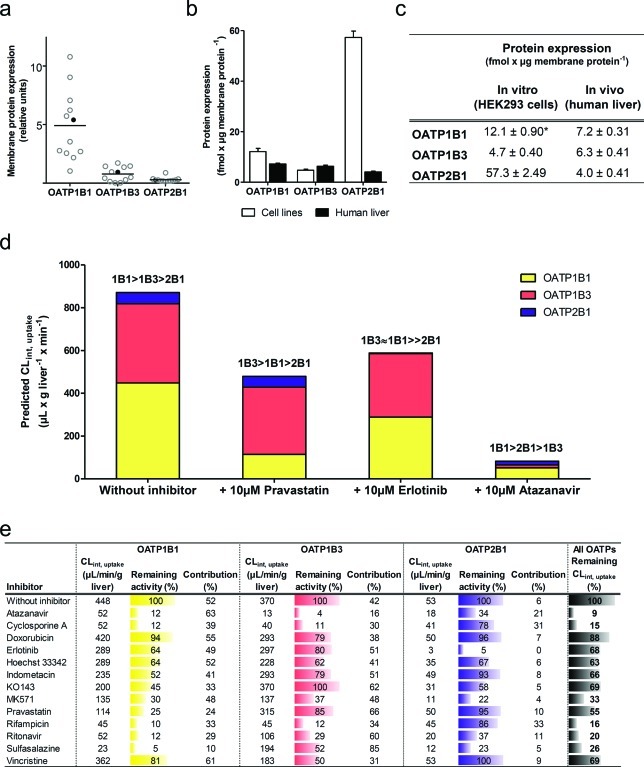
To obtain an appreciation of the variability in the liver transporter expression and to select a representative sample for targeted protein quantification, the relative protein expressions of OATP1B1, OATP1B3, and OATP2B1 were first determined in membrane fractions of human liver from 12 individuals using a filter-aided sample preparation (FASP) based proteomics approach.16 On the basis of these results, a sample, representative of the average OATP protein expression (filled circle in Figure 10a), was selected and used for the subsequent targeted protein quantification. The expression of OATP1B1, OATP1B3, and OATP2B1 was compared with the corresponding data obtained in the in vitro HEK293 cells overexpressing OATP1B1, OATP1B3, and OATP2B1, respectively (Figure 10b–c). As determined by the peptide-based targeted protein quantifications, the levels of OATPs (liver vs overexpressing HEK293 cells) were found to be 7.2 ± 0.3 vs 12.1 ± 0.9 (OATP1B1), 6.3 ± 0.4 vs 4.7 ± 0.4 (OATP1B3), and 4.0 ± 0.4 vs 57.3 ± 2.5 fmol/μg membrane protein (OATP2B1), respectively.
Figure 10.
Prediction of in vivo intrinsic uptake clearance (CLint,uptake) based on protein expression data. Relative membrane protein expression of OATP1B1, OATP1B3, and OATP2B1 in 12 human liver samples (a). One sample (filled black circle), with relative expression levels close to the average expression of all 12 liver tissues, was used for targeted protein quantification to obtain the membrane protein expression of OATP1B1, OATP1B3, and OATP2B1. The surrogate peptide levels in the selected liver sample (black bars) and in membrane fractions of stably transfected HEK293 cells (white bars) are shown in fmol/μg membrane protein (mean ± standard deviation for three measurements (or mean ± range for two measurements, OATP1B1 in vitro, indicated with *). (b–c). Predicted CLint,uptake of atorvastatin by OATP1B1 (yellow), OATP1B3 (red), and OATP2B1 (blue) without inhibitor or with 10 μM pravastatin, erlotinib or atazanavir (d). Tabulated values of predicted CLint,uptake, contribution of each OATP to the overall uptake CL as well as remaining individual or overall OATP dependent CLint,uptake of atorvastatin in the absence of an inhibitor or in the presence of 10 μM of each of the 13 selected inhibitors (e).
Maximal Transport Activity Predicts Hepatic Uptake Clearance of Atorvastatin
Atorvastatin, a substrate of all three OATPs,7,17 was used in in vitro to in vivo extrapolations because its liver uptake is mainly dependent on OATP transporters. The intrinsic uptake clearance (CLint,uptake) of atorvastatin for each transporter in the in vitro experiments was extrapolated to corresponding in vivo data using the MTA. As can be seen in Figure 10d, OATP1B1 and OATP1B3 were the major OATP transporters responsible for the hepatic uptake of atorvastatin in vivo, with predicted CLint,uptake of 450 and 370 μL/min/g liver, respectively. This corresponds to a contribution to the overall uptake CL of atorvastatin of 52% and 42%, respectively, while the remaining 6% is cleared by OATP2B1.
Impact of the Maximal Transport Activity on Drug–Drug Interactions
Using a static mathematical model and assuming competitive inhibition, the impact of 10 μM of the 13 selected inhibitors on hepatic atorvastatin uptake CL in vivo was estimated.18 The results indicated that pravastatin, identified as a specific inhibitor of OATP1B1 in this study, almost exclusively inhibited the uptake of atorvastatin by OATP1B1 (75% reduction) with only a minor impact on the uptake by OATP1B3 and OATP2B1 (15% and 5% reduction, respectively) (see Figure 10d–e). As a result of the pronounced OATP1B1 inhibition, the uptake CL became more dependent on OATP1B3 and OATP2B1 compared to the situation without an inhibitor. In total, the overall CLint,uptake was reduced by 45% in the presence of pravastatin.
Erlotinib, on the other hand, identified by us as a specific inhibitor of OATP2B1, primarily decreased the contribution of OATP2B1 to atorvastatin uptake (CLint,uptake reduced from 53 to 2.7 μL/min/g liver, a reduction of the remaining transporter activity by 95%). However, due to the low contribution of OATP2B1, the total reduction of the overall CLint,uptake in the presence of erlotinib was only 32% (see Figure 10e). In fact, inhibition of OATP1B1 by erlotinib had a larger impact on overall atorvastatin uptake CL in quantitative terms (CLint,uptake by OATP1B1 reduced from 450 to 290 μL/min/g liver, i.e., a 36% reduction) than the inhibition of OATP2B1. This can be explained by a combination of a higher MTA for OATP1B1 and a lower affinity of atorvastatin for OATP2B1.
Atazanavir, identified as a general inhibitor in this study, inhibited the uptake of atorvastatin by all three OATPs. Overall, uptake CL was decreased by 91% and the remaining uptake CL was mainly dependent on OATP1B1 (Figure 10d). Finally, sulfasalazine, a borderline general inhibitor with a preference for OATP1B1 over OATP1B3, had a large impact on OATP1B1 mediated uptake (95% reduction). This resulted in a clear shift in the contribution of each transporter to the overall uptake of atorvastatin, increasing the OATP1B3 contribution from 42% to 85%. Thus, in this case, OATP1B3 became the major transporter contributing to atorvastatin uptake (Figure 10e).
In general, for all these DDIs, the contribution of OATP2B1 to the uptake CL of atorvastatin was minor. This is a result of the lower MTA of OATP2B1 in combination with the lower affinity for atorvastatin as compared to OATP1B1 and OATP1B3. With some inhibitors though, the OATP2B1 contribution increased up to 6-fold (e.g., cyclosporine A and rifampicin being OATP1B1/OATP1B3 specific inhibitors) (see Figure 10e). However, it should be noted that even in cases where the OATP2B1 contribution increases as compared to the other two OATPs, the maximal OATP2B1 CLint,uptake of atorvastatin cannot exceed 53 μL/min/g liver. This clearly highlights the importance of OATP1B1 and OATP1B3 as atorvastatin uptake transporters. Nevertheless, the importance of OATP2B1 interactions will increase for substrates with higher affinity for OATP2B1 than for the other OATPs.
Discussion
Liver expressed OATPs are considered some of the most important drug transporting proteins in humans and the pharmaceutical industry is recommended to examine new drug candidates for probable interactions with these proteins.2 This has created a need for in vitro screening of OATP mediated DDIs in drug discovery.2,19 A problem when investigating such interactions is that many of the proposed inhibitors of OATP transporters have not been studied for their specificity toward the three hepatic OATPs. We therefore set out to investigate the inhibitor specificity for a data set of 225 structurally diverse oral drugs and drug-like compounds enriched with known and putative OATP inhibitors. We also introduced the maximal transport activity which allows determination of the maximal transport capacity of each transport protein in the human liver in vivo.
While several studies on OATP1B1 mediated drug interactions have been performed previously (cf. ref (3,7)), less is known about global drug interaction patterns with OATP1B3 and, in particular, OATP2B1. Here, we observed a large overlap between the inhibitors of the three OATPs and especially between OATP1B1 and OATP1B3, which is in agreement with the high (80%) amino acid sequence homology between these two transporters.
No crystal structures of the OATPs are available, but attempts to develop pharmacophore models from smaller data sets suggest that hydrogen bond features and lipophilicity are important properties of OATP1B1 substrates.20 This agrees well with an interesting aspect of the OATP inhibitors in this study; they benefit from being both lipophilic and being polar. While NNLogP has been positively correlated to inhibition of both efflux and uptake transporters, PSA has either not been identified as an important molecular property or has been negatively correlated to inhibition of other hepatic transporters in previous studies.8,15,21 As shown here for the investigated compounds, a larger PSA generally results in a lower NNLogP. Hence, a number of different structures may exhibit inhibitory characteristics. A large structural diversity has also been observed for inhibitors of E17βG uptake in human hepatocytes, which, presumably, is mainly the result of inhibition of OATP1B1/OATP1B3.22
The result that inhibitors benefit from increase in both lipophilicity and polar surface area supports the speculation that there are several interaction sites for these transporters and that a variety of different structures may act as inhibitors of OATP1B1, OATP1B3, and OATP2B1. Although most inhibition curves had slopes close to 1, the existence of several binding sites could explain the few exceptions with slopes much less than unity (see Figure 9 and Supporting Information Table 2). Results supporting the existence of two binding sites have previously been provided for OATP1B123 and for OATP2B124 based on biphasic uptake kinetics of E3S. In addition, allosteric interaction sites affecting the uptake of pravastatin by OATP1B1 and OATP1B3 were discussed in a recent publication.25
The number of inhibitors of each transporter was sufficiently large to investigate molecular descriptors of importance for inhibition of the individual OATP transporters and to develop in silico models that are able to predict inhibition with good accuracy. Our modeling reveals the somewhat different behavior of OATP2B1 relative to OATP1B1 and OATP1B3 (Figure 7c–e). The OATP2B1 model, contrary to those of the other two transporters, has a negative contribution of nonpolar (NPSA) and total surface area (TSA). However, as shown in Table 4, the OATP2B1 inhibitors have a significantly higher NPSA and TSA than the noninhibitors. This may be explained by the presence of a subgroup of OATP2B1 noninhibitors with large NPSA and TSA (e.g., cyclosporine A, ivermectin, and PSC833). The linear model thus includes a negative contribution of these descriptors, enabling correct predictions of OATP2B1 inhibition potency also for such compounds.
Among the compounds classified as specific OATP1B1 inhibitors, we find the three statins, lovastatin acid, pravastatin acid, and simvastatin acid. This is in line with the impact of OATP1B1 polymorphisms on the pharmacokinetics26 and dynamics4 of statins. For OATP1B3, only three specific inhibitors could be identified (the novel inhibitor Hoechst 33342, as well as the previously known interacting drugs mitoxantrone and vincristine27). Erlotinib, a tyrosine kinase inhibitor used in the treatment of several forms of cancer,28 was the only strong selective OATP2B1 inhibitor identified. Comparison with the maximum unbound plasma concentration of erlotinib (0.4 μM29) reveals that erlotinib probably inhibits OATP2B1 at clinically relevant concentrations.
Erlotinib also inhibits several other transporters, including the abundantly expressed organic cation transporters OCT11a and multidrug and toxin extrusion 2K (MATE2K)29 as well as the ABC transporters BCRP, MDR1,30 and MRP7.31 This complexity is shared by many other inhibitors in this study. Pravastatin, here identified as an OATP1B1 specific inhibitor, has been reported to be a substrate of MDR1, BCRP, and MRP2.32 Sulfasalazine, here classified as a borderline general OATP inhibitor, is also a substrate of BCRP.33 Finally, MK571, identified as a general ABC inhibitor by Matsson and co-workers,8 was also identified as an OATP inhibitor in this study with IC50 values ranging between 2.9 and 6.4 μM as compared to 26 μM (MDR1), 50 μM (BCRP), and 10 μM (MRP2) for the ABC transporters.8 This analysis emphasizes the significant impact of interactions with various drug transporting proteins on the pharmacokinetics of drugs. We conclude that to be interpretable, screening studies of transporter interactions in drug discovery should be performed under conditions that allow for the investigation of each transport protein in isolation. For this purpose, the new specific and general inhibitors of the three OATPs found in this study will be useful tools.
On the basis of this study, we suggest pravastatin and erlotinib as specific in vitro inhibitors of OATP1B1 and OATP2B1, respectively. In addition, we conclude that cyclosporine A and rifampicin can be used as OATP1B1/OATP1B3 inhibitors, with little effect on OATP2B1. We also confirm the recommendation of ritonavir as a general OATP inhibitor2 and suggest atazanavir as another general OATP inhibitor. Finally, when considering a general inhibitor of both the hepatic OATPs and ABC transporters, MK571 is the compound with the highest potential, taking into account the results from this as well as from previous studies.8
Given the complexity of drug interaction patterns with transport proteins, it may seem impossible to predict the in vivo impact of such interactions. Here, we present a new approach to handle this issue for individual transporters. By introducing the concept of MTA, the transport capacity in vitro (Vmax) can be linked to the transport activity in the human liver in vivo. The major underlying assumption is that all transport proteins in the isolated membrane fractions are available for drug transport both in vitro and in vivo (see Experimental Details for additional assumptions with respect to eq 7). When this is the case, the maximal transport capacity is directly linked to the Vmax value in the in vitro model and a scaling factor giving an assumed Vmax value in vivo can be obtained according to eq 7. We underscore that the MTA represents an ideal situation, where it is assumed that all transport protein is active. For instance, intracellular pools of transport proteins are not accounted for. It has been stated, however, that OATPs are not stored in intracellular compartments.34
As in previously published work, based on the so-called relative expression factor,5a the highest relative protein expression was observed for OATP1B1. The large variability in OATP1B1 expression between donors (Figure 10a) could be a result of variable expression due to common genetic variants of this protein.19,35 This is in line with previous studies, where similar interindividual variations in human liver OATP expression have been reported.1b,36 In addition, the protein expression levels obtained using targeted protein quantification were in reasonably good agreement with these reports.1b,36
Because we identified atorvastatin as a substrate of all three OATPs in this study, we could compare the uptake clearance values of the three OATP transporters in vitro. As can be seen in Table 2, OATP2B1 transported atorvastatin with the highest efficiency (Vmax/Km) in vitro. This is presumably due to a high OATP2B1 expression in the in vitro cell model. When taking the MTA into account to calculate intrinsic uptake clearance in the human liver, the contribution of OATP2B1 mediated transport to the overall uptake clearance of atorvastatin was however reduced to a minimum.
The impact of a series of inhibitors with different inhibition patterns (IC50 values) on each of the OATPs was markedly altered when the MTA was considered. One such example is erlotinib, where the inhibition of OATP1B1 and OATP1B3 was more significant than the OATP2B1 inhibition in quantitative terms even though erlotinib was identified as an OATP2B1 specific inhibitor (Figure 10d). Importantly, this finding does not preclude the application of erlotinib as a highly specific OATP2B1 inhibitor under controlled in vitro conditions. Note that for the predictions in Figure 10d–e, a fixed concentration of 10 μM was used for all inhibitors. However, if evaluating the risk of clinical DDIs, unbound plasma concentrations in vivo are the most accurate input variables to use (cf. ref (2)).
Interestingly, the substantial contribution of OATP1B3 to atorvastatin uptake clearance as well as the overlapping specificities of many inhibitors suggest that OATP1B3 is more important for known clinical DDIs than previously understood. For example, both cyclosporine and rifampicin have been reported to affect atorvastatin pharmacokinetics in clinical studies.19 Cyclosporine is an inhibitor of several drug transporters and metabolizing enzymes.2,37 In vivo, concomitant administration of atorvastatin and cyclosporine has resulted in vastly increased plasma concentrations of atorvastatin (7.4–15.3-fold increase (cf. ref (19))). This effect has mainly been attributed to inhibition of OATP1B1 mediated uptake and inhibition of CYP dependent metabolism (cf. ref (38)). Our results, taking MTA into consideration, reveal that inhibition of OATP1B3 mediated uptake of atorvastatin might be almost equally important as OATP1B1 inhibition. Indeed, for both OATP1B1 and OATP1B3, only 11–12% of the predicted activity is remaining when the dual OATP1B1/OATP1B3 inhibitor cyclosporine is used (Figure 10e).
With rifampicin, a similar situation prevails. Concomitant single-dose treatment with atorvastatin and rifampicin has resulted in 6.8-fold increased plasma concentration in vivo, which has been attributed to OATP1B1.39 Also here, our results indicate that rifampicin greatly reduces both OATP1B1 and OATP1B3 mediated atorvastatin uptake (Figure 10e). Hence, the role of OATP1B3 needs to be reconsidered. In light of the large inhibitor overlap between OATP1B1 and OATP1B3 displayed in Figure 4, it is likely that similar conditions will apply for other drugs administered in combination with a shared OATP1B1/OATP1B3 substrate. Clarithromycin (73.1% inhibition of OATP1B1, 53.8% inhibition of OATP1B3), which has been reported to increase atorvastatin AUC 4.5-fold, could be one such example.40
Conclusion
In summary, our results speak in favor of considering transporter expression levels in DDI studies. As exemplified above, many of the compounds identified as OATP inhibitors also interact with other drug transporters in vitro. The importance of individual interactions for the overall in vivo drug disposition of a compound is difficult to determine without knowledge of differences in protein expression levels between systems. As more quantitative information on transporter protein levels become available, more accurate scaling from in vitro to in vivo can be performed, which will further improve predictions of drug disposition and DDIs. Importantly, the MTA introduced here does not only apply to the liver. It can also be applied in predictions of transporter impact in other cells and tissues.
Experimental Details
Chemicals
The 225 compounds investigated in the inhibition assays were obtained from Sigma-Aldrich Corp. (St. Louis, MO, USA), Toronto Research Chemicals Inc. (North York, ON, Canada), International Laboratory USA (San Bruno, CA, USA), 3B Scientific Corp. (Libertyville, IL, USA), and AstraZeneca (Mölndal, Sweden). Bufuralol was kindly provided by Dr. Inger Johansson, Karolinska Insititutet, Stockholm, Sweden. Aciclovir, amantadine, buspirone, daidzein, doxazosin, etoposide, fenofibrate, fluoxetine, fluvoxamine, furafylline, lamotrigine, mitoxantrone, nifedipine, ofloxacin, phenylbutazone, procainamide, propranolol, ranolazine, sanguinarine, sulfaphenazole, tetraethylammonium, tolbutamide, tranylcypromine, valproic acid, and verapamil were obtained as DMSO stocks from LOPAC (Sigma-Aldrich Corp., St. Louis, MO, USA). Radioactively labeled E17βG (3H-E17βG) and E3S (3H-E3S) were purchased from PerkinElmer (Waltham, MA, USA).
Compound Selection
A data set of structurally diverse compounds previously used in a study of OATP1B1 inhibition was used as a starting point for the compound selection.7 This data set contained compounds reflecting the oral drug space as well as compounds identified in the literature as interacting with OATPs. The data set was further expanded with compounds highlighted in the recently published review on drug transporters by the international transporter consortium.2 Compounds generally used as substrates, inhibitors, or inducers in CYP studies were also included in the final data set.13
Establishment of Stable Cell Lines and Cell Cultivation
Total human liver RNA was obtained from Clontech (Mountain View, CA, USA). Reverse transcription was performed using the SuperScript III first-strand synthesis supermix according to the manufacturer’s instructions (Invitrogen, Carlsbad, CA, USA). The resulting cDNA was used as a template when SLCO1B3/OATP1B3 and SLCO2B1/OATP2B1 were amplified using Platinum Pfx DNA polymerase (Invitrogen, Carlsbad, CA, USA) and gene specific primers (see Supporting Information Table 3). The PCR products were cloned into the BamHI/XhoI (OATP1B3) or the HindIII/EcoRV (OATP2B1) sites of the expression vector pcDNA5/FRT (Invitrogen, Carlsbad, CA, USA). The sequences of the obtained OATP1B3-pcDNA5/FRT and OATP2B1-pcDNA5/FRT constructs were verified by DNA sequencing and were found to be identical with the SLCO1B3*2 (the most common SLCO1B3 allele having an allele frequency of up to 88% in Caucasians41) and SLCO2B1*1 (NCBI SLCO2B1 reference sequence: NM_007256) alleles, respectively. HEK293 Flp-In cells (Invitrogen, Carlsbad, CA, USA) were transfected with the constructed OATP1B3- and OATP2B1-pcDNA5/FRT expression vectors and further selected using hygromycin B (Invitrogen, Carlsbad, CA, USA) as previously described for OATP1B1 and mock transfected cells.7 HEK293 cells were used because the endogenous background expression of transport proteins and drug metabolizing enzymes is either very low or absent.42 For continued maintenance, all stable clones were cultured as described by Karlgren et al.7
Transport Experiments
Two days prior to transport experiments with E17βG or E3S,43 OATP1B1,7 and OATP2B1 overexpressing cells were seeded in 96-well CellBind plates (Corning, Amsterdam, Netherlands) at a density of 100000 cells per well. For all experiments with OATP1B3 expressing cells or with atorvastatin as substrate, cells were seeded in 24-well CellBind plates (Corning, Amsterdam, Netherlands) three days prior to transport experiments at a density of 600000 cells per well. Cell density was optimized by computer assisted experimental design using MODDE 7.0 (Umetrics, Umeå, Sweden) as described elsewhere.7 For culturing in 96- and 24-well plates, Flp-In-293 medium without phenol red and hygromycin B was used.7
Characterization of OATP1B1, OATP1B3, and OATP2B1 Mediated Transport
To determine the binding affinity (Km) and maximal transport rate (Vmax) of the OATP1B1 and OATP1B3 mediated uptake of model substrate (E17βG), OATP1B1-HEK293 cells grown in 96-well plates were incubated with a solution containing 1 μCi/mL (20.4 nM) of 3H-E17βG and 0.5–100 μM of unlabeled E17βG in HBSS, and OATP1B3-HEK293 cells grown in 24-well plates were incubated with a solution containing 2 μCi/mL (40.9 nM) of 3H-E17βG and 1–100 μM of unlabeled E17βG in HBSS. The Km and Vmax of the OATP2B1 model substrate, E3S, were determined using OATP2B1-HEK293 cells grown in 96-well plates. The cells were incubated with a solution containing 1 μCi/mL (21.9 nM) of 3H-E3S and 0.5–600 μM of unlabeled E3S in HBSS. The uptake of model substrate was analyzed using a scintillation counter as described below. To characterize the OATP1B3 and OATP2B1 mediated atorvastatin uptake, cells grown in 24-well plates were incubated with a solution containing 0.01–20 μM atorvastatin in HBSS and intracellular accumulation was analyzed using LC-MS/MS as previously described.7
Uptake kinetics of E17βG, E3S, and atorvastatin were assessed by plotting the initial uptake rate (uptake after 1 min) against substrate concentration [S], and the apparent Km and Vmax were determined using nonlinear regression (Prism v.4.02 from GraphPad Software, La Jolla, CA, USA) fitted to eq 2.
| 2 |
where Pdiff is the passive permeability of the substrate.
Substrate concentrations well below the Km were selected for subsequent inhibition studies with the radiolabeled model compounds. Linearity of E17βG and E3S uptake over time, in the three OATP expressing HEK293 cell lines, was assessed using the selected substrate concentrations for up to 10 min incubation time. The OATP1B1 and OATP1B3 mediated uptake of E17βG was linear over the first 10 min, and the OATP2B1 mediated uptake of E3S was linear for the first 5 min. All uptake experiments were performed in the linear interval.
Single-Point Inhibition Studies
The screening for inhibition of OATP1B1 mediated uptake of E17βG was performed at an inhibitor concentration of 20 μM, as previously described.7 In total, 225 compounds were investigated. Inhibition values for 142 of these compounds were taken from a previous screen of OATP1B1 inhibition.7
For the OATP1B3 and OATP2B1 single-point inhibition assays, experimental design was used to optimize the assays with regard to substrate concentration, amount of labeled substrate, incubation time, number of washes, cell seeding density, and days in culture before the experiments. The MODDE 7.0 (Umetrics, Umeå, Sweden) software was used for setup and evaluation of the experimental design as described previously.7 In the OATP1B3 inhibition assay, cells grown in 24-well plates were incubated for 5 min with a solution containing 20 μM of the test compound, 2 μCi/mL (40.9 nM) of 3H-E17βG, and 1 μM of unlabeled E17βG in HBSS. In the OATP2B1 inhibition assay, cells grown in 96-well plates were incubated for 4 min with a solution containing 20 μM of the test compound, 1 μCi/mL (21.9 nM) of 3H-E3S, and 1 μM of unlabeled E3S in HBSS. All 225 compounds in the data set were screened for OATP1B3 and OATP2B1 inhibition.
On each plate, HEK293 cells were incubated with substrate solution as a positive control of OATP mediated uptake (OATP expressing cells) and the passive permeability was obtained from mock transfected cells. In addition, pitavastatin, taurocholate, or atorvastatin was included on each plate as a positive control of inhibition. Percent inhibition was calculated according to eq 3.
| 3 |
A compound was classified as an inhibitor if it decreased the uptake of model substrate by at least 50% (2-fold decrease).7,8,15,21 Likewise, a compound was classified as a stimulator if it increased the uptake by at least 100% (2-fold increase).
IC50 Determinations
The half-maximal inhibitory concentration, IC50, for a subset of 13 compounds was determined in vitro, using the same methodology as in the single-point inhibition studies. To include potential “OATP specific” inhibitors in a broader sense, OATP inhibitors not identified as inhibitors of the ABC-transporters MDR1, BCRP, MRP2, and/or the organic cation transporter OCT1 in previously published studies8,15 were selected from the data set. With this prerequisite, five of the 13 compounds, identified as either specific (doxorubicin, erlotinib, indometacin, and vincristine) or general (sulfasalazine) OATP inhibitors in the single-point inhibition assays, were selected. Additionally, three compounds recommended as OATP inhibitors (rifampicin, ritonavir, and cyclosporine A),2 three commonly used ABC inhibitors (Hoechst 33342, KO143, and MK571),8 and two compounds belonging to drug classes with clinically relevant OATP mediated drug–drug interactions (atazanavir and pravastatin) were investigated. In the IC50 experiments, 5–12 inhibitor concentrations were used in the following concentration intervals: atazanavir 0.02–40 μM, cyclosporine A 0.01–25 μM, doxorubicin 0.1–1000 μM, erlotinib 0.02–400 μM, Hoechst 33342 0.1–600 μM, indometacin 0.1–600 μM, KO143 0.05–10 μM, MK571 0.01–100 μM, pravastatin 0.1–400 μM, rifampicin 0.05–400 μM, ritonavir 0.01–50 μM, sulfasalazine 0.01–100 μM, and vincristine 0.1–600 μM. IC50 values were calculated by fitting the data to the following equation using Prism v.4.02 (GraphPad Software, La Jolla, CA, USA).
| 4 |
This is equal to the four-parameter equation when the bottom plateau of the curve is constrained to zero and the top plateau to 100. [I] is the inhibitor concentration, and the Hill Slope describes the steepness of the curve.
The inhibition constant, Ki, was calculated according to eq 5 (assuming competitive inhibition).
| 5 |
In parallel to the experimental determinations, predicted IC50 values for the 13 compounds were calculated based on the obtained single-point inhibition results using eq 6.
| 6 |
Compounds showing negative inhibition values (i.e., stimulation of the uptake) in the single-point inhibition studies, and compounds where no experimental IC50 value could be determined, were excluded from the IC50 predictions.
Scintillation Analysis
At the end of the incubation with radioactively labeled substrate solutions, carrier-mediated uptake was stopped by addition of ice-cold PBS followed by three or four washes. The cells were lysed using 1 M NaOH. Analysis of intracellular accumulation of radioactively labeled model substrate was carried out on a TopCount NXT scintillation counter using Luma plates (OATP1B1 and OATP1B3) or Opti plates with addition of 250 μL of Microscint 20 scintillation liquid (OATP2B1), respectively. All plates, scintillation liquids, and equipment were obtained from PerkinElmer, Inc. (Downers Grove, IL, USA).
Protein Concentration Measurements
In all uptake kinetics or inhibition experiments, cell lysates (obtained by addition of 1 M NaOH as described above) were neutralized using 1 M HCl. Total protein content was measured using the BCA Protein Assay Reagent Kit (Pierce Biotechnology, Rockford, IL, USA) according to manufacturer’s instructions.
Statistics
All experiments were performed in duplicate (OATP1B3) or triplicate (OATP1B1 and OATP2B1) on 2–6 independent occations. In each experiment, ANOVA and Dunnett’s multiple comparison test were used to ensure that the uptake in presence of inhibitor/stimulator was significantly different from the positive OATP control where no inhibitor/stimulator was used.
Molecular Descriptors
The 225 compounds used in this study, together with an oral drug reference data set,8 were treated in their neutral states and characterized using the AZ oeSelma descriptors generated from SMILES (see Supporting Information Table 4 for a compilation of the structures in SMILES format). The AZ oeSelma descriptors consist of AstraZeneca’s in-house compilation of 93 molecular descriptors, of physicochemical nature, in line with the work of Labute.44 These descriptors contain 1D and 2D descriptors, including properties such as various counts of atoms and bonds, charges, surfaces, and lipophilicity. In addition, charge and solubility in water at pH 7.4 were predicted using ADMET Predictor (SimulationsPlus, Lancaster, CA, USA). Significant differences between the groups of inhibitors and noninhibitors, with regard to physicochemical properties, were assessed using the nonparametric Mann–Whitney U test.
Computational Modeling
The overall characteristics of the data set were assessed using PCA implemented in Simca-P (version 12.0 of the Simca-P software, Umetrics AB, Umeå, Sweden). The data set was also assessed on a PCA model where the 529 oral drugs in the reference data set were used as a training set and the OATP data set was projected onto that model. Modeling of the inhibition of the three transporters (OATP1B1, OATP1B3, and OATP2B1) was performed using the PLS method implemented in Simca-P (version 12.0 of the Simca-P software, Umetrics AB, Umeå, Sweden). Each model was developed as a classification model where the cutoff for inhibition was set to 50%. Compounds exhibiting inhibition greater than 50% were designated as inhibitors (class = 1), and compounds exhibiting inhibition less than 50% were considered to be noninhibitors (class = 0).
For all three models, compounds exhibiting inhibition <0%, i.e., stimulation of the transport, were excluded from the modeling. The data sets were split into a training set and a test set, where a third of the data set was randomly selected as the test set. Because of skewed distributions of inhibitors and noninhibitors of the three transporters (the former class being between 33% and 38% in the respective training sets), the cutoff value, normally set to 0.5 for equally distributed classes, was adjusted during model development using the training sets to optimize accuracy. The data were mean-centered and scaled to unit variance. A variable selection procedure was applied on the training sets, where variables exhibiting low variable importance were removed stepwise. The aim of the variable selection was to maintain predictability and increase the robustness of the models. At the same time, the complexity of the models was decreased, facilitating interpretation by removing information that was not directly related to the response variable (i.e., noise). The variable selection was validated by the 7-fold cross-validated R2 (Q2) for the training sets. The selected variables for the three transporters were subsequently used to derive the final models and the qualities of these models were judged by the accuracies of the respective test sets.
A general OATP inhibition model was also developed as described above, whereby a compound was defined as an inhibitor if it decreased the uptake of model substrate by any of the three transporters by 50% or more.
Prediction of in Vivo Uptake Clearance
Preparation of Cell and Tissue Samples for Protein Expression Analysis
HEK293 cells stably transfected with OATP1B1, OATP1B3, or OATP2B1 were cultured as described elsewhere7 until reaching a passage of 19, 17, and 18, respectively. At 95–100% confluence, cells were trypsinized and centrifuged at 450g for 5 min, followed by one washing step using phosphate buffered saline (PBS). The resulting cell pellets were frozen at −80 °C until analysis.
Snap-frozen human liver tissue samples were obtained from 12 individual donors undergoing surgical liver resection at Uppsala University Hospital (Uppsala, Sweden), as approved by Uppsala Regional Ethical Review Board (ethical approval no. 2009/028). All donors gave their informed consent. The tissue samples were stored at −80 °C until further analysis.
Extraction of Membrane Proteins and Measurement of OATP1B1, OATP1B3, and OATP2B1 Protein Expression
For relative protein quantification, HEK293 cells and liver tissue samples were prepared and analyzed as described previously.16,45 Briefly, crude membrane fractions were isolated from the samples and lysed in SDS-containing buffer. Proteins were digested with trypsin according to the FASP protocol, using 30k ultrafiltration units. The digests were loaded on SAX-pipet tip columns at pH 11, and the peptides were eluted with a buffer of pH 2. LC-MS/MS analysis of the samples was carried out on an Orbitrap instrument using 4 h LC gradients. The relative abundances of the proteins were calculated using the total signal intensities of the peptides identifying each protein as determined in the MaxQuant software (Max Planck Institute of Biochemistry, Martinsried, Germany).
For the targeted protein quantification, membrane fractions from the frozen HEK293 cells and from one representative human liver tissue sample were extracted and digested with trypsin as previously described.36 The targeted OATP proteins were quantified by peptide-based LC-MS/MS measurements as a surrogate of proteins levels, with the addition of stable isotope labeled internal standard peptides that are specific for each OATP.
In Vitro to in Vivo Extrapolations Using the Maximal Transport Activity
A static mathematical model was used to estimate the contribution of each OATP to the intrinsic uptake CL (CLint,uptake) of atorvastatin in vivo. The model was based on in vitro kinetic results of atorvastatin uptake in OATP overexpressing HEK293 cells. An intersystem extrapolation factor based on the ratio of the OATP protein abundances (obtained using targeted proteomics quantification) in the cell lines (protein expressionin vitro) to those in human liver tissue (protein expressionin vivo) was used to calculate the MTA, assuming that the protein expression is directly proportional to the maximal velocity (Vmax) and that the amount of membrane protein per total amount of protein is equal in the two systems (see eq 7).
| 7 |
This is in line with previously published work, where the so-called relative expression factor, representing the ratio of protein expression between human hepatocytes and in vitro cell models, measured by Western blotting, was used as an in vitro to in vivo scaling factor.5a
The intrinsic uptake CL of each OATP was predicted using eq 8:
| 8 |
where MTA is the estimated maximal velocity in vivo using the scaling factor explained above, [S] is the atorvastatin concentration (Cmax,unbound = 2 nM46), and HomPPGL is milligrams of homogenate protein per gram of liver (88 ± 14 mg/g, data based on 12 protein measurements using the Pierce 660 nm Protein Assay kit with addition of ionic detergent compatibility reagent (Pierce Biotechnology, Rockford, IL, USA)). The overall intrinsic uptake CL of atorvastatin in vivo was derived as the sum of the intrinsic uptake CL of each individual OATP. This approach is similar to the one described by Proctor et al. for CYPs but with proteomics data used as an intersystem extrapolation factor.47
Our model was subsequently used to predict the impact of the subset of 13 compounds (for which IC50 values were determined) on atorvastatin intrinsic uptake CL at an inhibitor concentration of 10 μM (a concentration where maximal resolution was expected for this subset of compounds, because 49% of the IC50 values <10 μM and 51% of the IC50 values >10 μM), assuming competitive inhibition and using the following equation:48
| 9 |
where Km is the atorvastatin concentration at half-maximal velocity in vitro, [I] is the inhibitor concentration (10 μM), and Ki is the inhibition constant determined using eq 5. As above, the overall intrinsic uptake CL of atorvastatin in vivo in presence of an inhibitor was derived as the sum of the intrinsic uptake CL of each individual OATP.
Acknowledgments
We are grateful to SimulationsPlus (Lancaster, CA, USA) for providing us with the reference site license to use the software ADMET Predictor. This work was supported by AstraZeneca, the Swedish Fund for Research Without Animal Experiments, the Swedish Governmental Agency for Innovation Systems, and the Swedish Research Council (grants 9478 and 21386). We are indebted to Drs. Agneta Norén, Frans Duraj, and Jozef Urdzik at Uppsala University Hospital for their skillful contribution in clinical sampling. In addition, the authors would like to thank Elin Svedberg, Rebecka Strand, Carl Roos, Felix Schreckenbach, Abdirahman Mohammed, Christine Wegler, and Maria Mastej for their valuable contribution in transport experiments and/or maintenance of cell cultures. Our thanks also go to Stina Wahlin and Ida Hemmingsson for their important contribution in OATP cloning.
Glossary
Abbreviations Used
- ABC
ATP-binding cassette
- BCRP
breast cancer resistance protein
- CCK-8
cholecystokinin octapeptide
- CL
clearance
- CYP
cytochrome P450
- DDI
drug–drug interaction
- DMSO
dimethyl sulfoxide
- E17βG
estradiol-17β-glucuronide
- E3S
estrone-3-sulfate
- EMA
European Medicines Agency
- FASP
filter-aided sample preparation
- FDA
Food and Drug Administration
- HBSS
Hank’s Balanced Salt Solution
- HEK293
human embryonic kidney 293 cells
- HMG-CoA
3-hydroxy-3-methylglutaryl-coenzyme A
- LC-MS/MS
liquid chromatography-tandem mass spectrometry
- LOPAC
library of pharmacologically active compounds
- MATE
multidrug and toxin extrusion
- MDR
multidrug resistance protein
- MRP
multidrug resistance associated protein
- MTA
maximal transport activity
- NNLogP
neural network calculated logarithm of partition coeffecient
- NPSA
nonpolar surface area
- OATP
organic anion transporting polypeptide
- OCT
organic cation transporter
- PCA
principal component analysis
- Pgp
P-glycoprotein
- PLS
partial least-squares projection to latent structures
- PSA
polar surface area
- SLC
solute carrier
- SMILES
simplified molecular input line entry system
- TSA
total surface area
Supporting Information Available
Tables containing an extended version of Table 1 (i.e., OATP inhibition data and selected molecular descriptors), Hill slopes for the IC50 curves shown in Figure 9, gene specific cloning primers, and SMILES for the investigated compounds, as well as figures showing atorvastatin kinetic uptake curves, overlap between OATP inhibitors and CYP interacting drugs and a comparison of predicted and experimentally obtained IC50 values (PDF and XLS). This material is available free of charge via the Internet at http://pubs.acs.org..
The authors declare no competing financial interest.
Author Contributions
M.K. and A.V. designed the research, conducted experiments, analyzed the data, interpreted the results, performed statistical analysis, made the figures and tables, and together with P.A. wrote the paper. In addition, M.K. developed the cell models and guided all aspects of this report and A.V. performed the in vitro to in vivo extrapolations. U.N. developed the four predictive in silico models and contributed to the discussion of the data. J.R.W. conducted sample preparation and performed relative protein expression analysis. E.K. and Y.L. conducted sample preparation and performed the LC-MS/MS targeted protein quantification. U.H. contributed to the selection process of representative human liver tissue samples. U.H. also performed the sampling of the human liver tissues. P.A. provided conceptual guidance, designed the research, contributed to the writing of the paper, and led the study. All authors were involved in the writing of their specific parts of the paper. In addition, all authors critically reviewed the final draft of the paper and provided feedback.
Supplementary Material
References
- a Hilgendorf C.; Ahlin G.; Seithel A.; Artursson P.; Ungell A. L.; Karlsson J. Expression of thirty-six drug transporter genes in human intestine, liver, kidney, and organotypic cell lines. Drug Metab. Dispos. 2007, 35 (8), 1333–1340. [DOI] [PubMed] [Google Scholar]; b Ohtsuki S.; Schaefer O.; Kawakami H.; Inoue T.; Liehner S.; Saito A.; Ishiguro N.; Kishimoto W.; Ludwig-Schwellinger E.; Ebner T.; Terasaki T. Simultaneous Absolute Protein Quantification of Transporters, Cytochromes P450, and UDP-Glucuronosyltransferases as a Novel Approach for the Characterization of Individual Human Liver: Comparison with mRNA Levels and Activities. Drug Metab. Dispos. 2012, 40 (1), 83–92. [DOI] [PubMed] [Google Scholar]
- Giacomini K. M.; Huang S. M.; Tweedie D. J.; Benet L. Z.; Brouwer K. L.; Chu X.; Dahlin A.; Evers R.; Fischer V.; Hillgren K. M.; Hoffmaster K. A.; Ishikawa T.; Keppler D.; Kim R. B.; Lee C. A.; Niemi M.; Polli J. W.; Sugiyama Y.; Swaan P. W.; Ware J. A.; Wright S. H.; Yee S. W.; Zamek-Gliszczynski M. J.; Zhang L. Membrane transporters in drug development. Nature Rev. Drug Discovery 2010, 9 (3), 215–236. [DOI] [PMC free article] [PubMed] [Google Scholar]
- Kalliokoski A.; Niemi M. Impact of OATP transporters on pharmacokinetics. Br. J. Pharmacol. 2009, 158 (3), 693–705. [DOI] [PMC free article] [PubMed] [Google Scholar]
- a Link E.; Parish S.; Armitage J.; Bowman L.; Heath S.; Matsuda F.; Gut I.; Lathrop M.; Collins R. SLCO1B1 variants and statin-induced myopathy—a genomewide study. N. Engl. J. Med. 2008, 359 (8), 789–799. [DOI] [PubMed] [Google Scholar]; b Sim S. C.; Ingelman-Sundberg M. Pharmacogenomic biomarkers: new tools in current and future drug therapy. Trends Pharmacol. Sci. 2011, 32 (2), 72–81. [DOI] [PubMed] [Google Scholar]
- a Hirano M.; Maeda K.; Shitara Y.; Sugiyama Y. Contribution of OATP2 (OATP1B1) and OATP8 (OATP1B3) to the hepatic uptake of pitavastatin in humans. J. Pharmacol. Exp. Ther. 2004, 311 (1), 139–146. [DOI] [PubMed] [Google Scholar]; b Kullak-Ublick G. A.; Ismair M. G.; Stieger B.; Landmann L.; Huber R.; Pizzagalli F.; Fattinger K.; Meier P. J.; Hagenbuch B. Organic anion-transporting polypeptide B (OATP-B) and its functional comparison with three other OATPs of human liver. Gastroenterology 2001, 120 (2), 525–533. [DOI] [PubMed] [Google Scholar]
- a Ismair M. G.; Stieger B.; Cattori V.; Hagenbuch B.; Fried M.; Meier P. J.; Kullak-Ublick G. A. Hepatic uptake of cholecystokinin octapeptide by organic anion-transporting polypeptides OATP4 and OATP8 of rat and human liver. Gastroenterology 2001, 121 (5), 1185–1190. [DOI] [PubMed] [Google Scholar]; b Smith N. F.; Marsh S.; Scott-Horton T. J.; Hamada A.; Mielke S.; Mross K.; Figg W. D.; Verweij J.; McLeod H. L.; Sparreboom A. Variants in the SLCO1B3 gene: interethnic distribution and association with paclitaxel pharmacokinetics. Clin. Pharmacol. Ther. 2007, 81 (1), 76–82. [DOI] [PubMed] [Google Scholar]
- Karlgren M.; Ahlin G.; Bergstrom C. A.; Svensson R.; Palm J.; Artursson P. In Vitro and In Silico Strategies to Identify OATP1B1 Inhibitors and Predict Clinical Drug–Drug Interactions. Pharm. Res. 2012, 29, 411–426. [DOI] [PMC free article] [PubMed] [Google Scholar]
- Matsson P.; Pedersen J. M.; Norinder U.; Bergstrom C. A.; Artursson P. Identification of novel specific and general inhibitors of the three major human ATP-binding cassette transporters P-gp, BCRP and MRP2 among registered drugs. Pharm. Res. 2009, 26 (8), 1816–1831. [DOI] [PubMed] [Google Scholar]
- a Konig J.; Cui Y.; Nies A. T.; Keppler D. Localization and genomic organization of a new hepatocellular organic anion transporting polypeptide. J. Biol. Chem. 2000, 275 (30), 23161–23168. [DOI] [PubMed] [Google Scholar]; b Konig J.; Cui Y.; Nies A. T.; Keppler D. A novel human organic anion transporting polypeptide localized to the basolateral hepatocyte membrane. Am. J. Physiol., Gastrointest. Liver Physiol. 2000, 278 (1), G156–164. [DOI] [PubMed] [Google Scholar]
- Gui C.; Miao Y.; Thompson L.; Wahlgren B.; Mock M.; Stieger B.; Hagenbuch B. Effect of pregnane X receptor ligands on transport mediated by human OATP1B1 and OATP1B3. Eur. J. Pharmacol. 2008, 584 (1), 57–65. [DOI] [PMC free article] [PubMed] [Google Scholar]
- Grube M.; Kock K.; Karner S.; Reuther S.; Ritter C. A.; Jedlitschky G.; Kroemer H. K. Modification of OATP2B1-mediated transport by steroid hormones. Mol. Pharmacol. 2006, 70 (5), 1735–1741. [DOI] [PubMed] [Google Scholar]
- Zelcer N.; Huisman M. T.; Reid G.; Wielinga P.; Breedveld P.; Kuil A.; Knipscheer P.; Schellens J. H.; Schinkel A. H.; Borst P. Evidence for two interacting ligand binding sites in human multidrug resistance protein 2 (ATP binding cassette C2). J. Biol. Chem. 2003, 278 (26), 23538–23544. [DOI] [PubMed] [Google Scholar]
- a Drug Development and Drug Interactions: Table of Substrates, Inhibitors and Inducers; U.S. Food and Drug Administration: Silver Spring, MD, 2006; http://www.fda.gov/Drugs/DevelopmentApprovalProcess/DevelopmentResources/DrugInteractionsLabeling/ucm093664.htm (accessed June 7, 2010);; b Guideline on the Investigation of Drug Interactions; European Medicines Agency: London, 2010; http://www.ema.europa.eu/docs/en_GB/document_library/Scientific_guideline/2010/05/WC500090112.pdf (accessed November 1, 2010).
- The cutoff value for binary classifications, where the two classes have been assigned values of 0 and 1, is set to 0.5 for equally distributed classes, i.e., where the two classes contain the same number of compounds. A compound having a class value less than the cutoff value will be assigned to class 0, while a compound having a class value greater than the cutoff value will be assigned to class 1. The same procedure of assignment is applied to both experimental as well as predicted values. Because of skewed distributions of inhibitors and noninhibitors of the three transporters in this work, the cutoff value had to be adjusted to reflect this imbalance.
- Ahlin G.; Karlsson J.; Pedersen J. M.; Gustavsson L.; Larsson R.; Matsson P.; Norinder U.; Bergstrom C. A.; Artursson P. Structural requirements for drug inhibition of the liver specific human organic cation transport protein 1. J. Med. Chem. 2008, 51 (19), 5932–5942. [DOI] [PubMed] [Google Scholar]
- Wisniewski J. R.; Zougman A.; Nagaraj N.; Mann M. Universal sample preparation method for proteome analysis. Nature Methods 2009, 6 (5), 359–362. [DOI] [PubMed] [Google Scholar]
- a Grube M.; Kock K.; Oswald S.; Draber K.; Meissner K.; Eckel L.; Bohm M.; Felix S. B.; Vogelgesang S.; Jedlitschky G.; Siegmund W.; Warzok R.; Kroemer H. K. Organic anion transporting polypeptide 2B1 is a high-affinity transporter for atorvastatin and is expressed in the human heart. Clin. Pharmacol. Ther. 2006, 80 (6), 607–620. [DOI] [PubMed] [Google Scholar]; b Schwarz U. I.; Meyer zu Schwabedissen H. E.; Tirona R. G.; Suzuki A.; Leake B. F.; Mokrab Y.; Mizuguchi K.; Ho R. H.; Kim R. B. Identification of novel functional organic anion-transporting polypeptide 1B3 polymorphisms and assessment of substrate specificity. Pharmacogenet. Genomics 2011, 21 (3), 103–114. [DOI] [PMC free article] [PubMed] [Google Scholar]
- The estimation of the impact of DDIs on atorvastatin uptake was based on inhibitor specificity and, hence, likelihood of clinical interaction was not considered.
- Niemi M.; Pasanen M. K.; Neuvonen P. J. Organic anion transporting polypeptide 1B1: a genetically polymorphic transporter of major importance for hepatic drug uptake. Pharmacol. Rev. 2011, 63 (1), 157–181. [DOI] [PubMed] [Google Scholar]
- Chang C.; Pang K. S.; Swaan P. W.; Ekins S. Comparative pharmacophore modeling of organic anion transporting polypeptides: a meta-analysis of rat Oatp1a1 and human OATP1B1. J. Pharmacol. Exp. Ther. 2005, 314 (2), 533–541. [DOI] [PubMed] [Google Scholar]
- Pedersen J. M.; Matsson P.; Bergstrom C. A.; Norinder U.; Hoogstraate J.; Artursson P. Prediction and identification of drug interactions with the human ATP-binding cassette transporter multidrug-resistance associated protein 2 (MRP2; ABCC2). J. Med. Chem. 2008, 51 (11), 3275–3287. [DOI] [PubMed] [Google Scholar]
- Badolo L.; Rasmussen L. M.; Hansen H. R.; Sveigaard C. Screening of OATP1B1/3 and OCT1 inhibitors in cryopreserved hepatocytes in suspension. Eur. J. Pharm. Sci. 2010, 40 (4), 282–288. [DOI] [PubMed] [Google Scholar]
- a Tamai I.; Nozawa T.; Koshida M.; Nezu J.; Sai Y.; Tsuji A. Functional characterization of human organic anion transporting polypeptide B (OATP-B) in comparison with liver-specific OATP-C. Pharm. Res. 2001, 18 (9), 1262–1269. [DOI] [PubMed] [Google Scholar]; b Noe J.; Portmann R.; Brun M. E.; Funk C. Substrate-dependent drug–drug interactions between gemfibrozil, fluvastatin and other organic anion-transporting peptide (OATP) substrates on OATP1B1, OATP2B1, and OATP1B3. Drug Metab. Dispos. 2007, 35 (8), 1308–1314. [DOI] [PubMed] [Google Scholar]
- Sai Y.; Kaneko Y.; Ito S.; Mitsuoka K.; Kato Y.; Tamai I.; Artursson P.; Tsuji A. Predominant contribution of organic anion transporting polypeptide OATP-B (OATP2B1) to apical uptake of estrone-3-sulfate by human intestinal Caco-2 cells. Drug Metab. Dispos. 2006, 34 (8), 1423–1431. [DOI] [PubMed] [Google Scholar]
- Kindla J.; Muller F.; Mieth M.; Fromm M. F.; Konig J. Influence of non-steroidal anti-inflammatory drugs on organic anion transporting polypeptide (OATP) 1B1- and OATP1B3-mediated drug transport. Drug Metab. Dispos. 2011, 39 (6), 1047–1053. [DOI] [PubMed] [Google Scholar]
- Niemi M. Transporter pharmacogenetics and statin toxicity. Clin. Pharmacol. Ther. 2010, 87 (1), 130–133. [DOI] [PubMed] [Google Scholar]
- Yamaguchi H.; Kobayashi M.; Okada M.; Takeuchi T.; Unno M.; Abe T.; Goto J.; Hishinuma T.; Mano N. Rapid screening of antineoplastic candidates for the human organic anion transporter OATP1B3 substrates using fluorescent probes. Cancer Lett. 2008, 260 (1–2), 163–169. [DOI] [PubMed] [Google Scholar]
- Goodman & Gilman’s The Pharmacological Basis of Therapeutics.: McGraw-Hill: New York, 2006. [Google Scholar]
- Minematsu T.; Giacomini K. M. Interactions of tyrosine kinase inhibitors with organic cation transporters and multidrug and toxic compound extrusion proteins. Mol. Cancer Ther. 2011, 10 (3), 531–539. [DOI] [PMC free article] [PubMed] [Google Scholar]
- a Marchetti S.; de Vries N. A.; Buckle T.; Bolijn M. J.; van Eijndhoven M. A.; Beijnen J. H.; Mazzanti R.; van Tellingen O.; Schellens J. H. Effect of the ATP-binding cassette drug transporters ABCB1, ABCG2, and ABCC2 on erlotinib hydrochloride (Tarceva) disposition in in vitro and in vivo pharmacokinetic studies employing Bcrp1–/–/Mdr1a/1b–/– (triple-knockout) and wild-type mice. Mol. Cancer Ther. 2008, 7 (8), 2280–2287. [DOI] [PubMed] [Google Scholar]; b Shi Z.; Parmar S.; Peng X. X.; Shen T.; Robey R. W.; Bates S. E.; Fu L. W.; Shao Y.; Chen Y. M.; Zang F.; Chen Z. S. The epidermal growth factor tyrosine kinase inhibitor AG1478 and erlotinib reverse ABCG2-mediated drug resistance. Oncol. Rep. 2009, 21 (2), 483–489. [PMC free article] [PubMed] [Google Scholar]; c Kodaira H.; Kusuhara H.; Ushiki J.; Fuse E.; Sugiyama Y. Kinetic analysis of the cooperation of P-glycoprotein (P-gp/Abcb1) and breast cancer resistance protein (Bcrp/Abcg2) in limiting the brain and testis penetration of erlotinib, flavopiridol, and mitoxantrone. J. Pharmacol. Exp. Ther. 2010, 333 (3), 788–796. [DOI] [PubMed] [Google Scholar]; d Shi Z.; Peng X. X.; Kim I. W.; Shukla S.; Si Q. S.; Robey R. W.; Bates S. E.; Shen T.; Ashby C. R. Jr.; Fu L. W.; Ambudkar S. V.; Chen Z. S. Erlotinib (Tarceva, OSI-774) antagonizes ATP-binding cassette subfamily B member 1 and ATP-binding cassette subfamily G member 2-mediated drug resistance. Cancer Res. 2007, 67 (22), 11012–11020. [DOI] [PubMed] [Google Scholar]
- Kuang Y. H.; Shen T.; Chen X.; Sodani K.; Hopper-Borge E.; Tiwari A. K.; Lee J. W.; Fu L. W.; Chen Z. S. Lapatinib and erlotinib are potent reversal agents for MRP7 (ABCC10)-mediated multidrug resistance. Biochem. Pharmacol. 2010, 79 (2), 154–161. [DOI] [PMC free article] [PubMed] [Google Scholar]
- a Matsushima S.; Maeda K.; Kondo C.; Hirano M.; Sasaki M.; Suzuki H.; Sugiyama Y. Identification of the hepatic efflux transporters of organic anions using double-transfected Madin–Darby canine kidney II cells expressing human organic anion-transporting polypeptide 1B1 (OATP1B1)/multidrug resistance-associated protein 2, OATP1B1/multidrug resistance 1, and OATP1B1/breast cancer resistance protein. J. Pharmacol. Exp. Ther. 2005, 314 (3), 1059–1067. [DOI] [PubMed] [Google Scholar]; b Sasaki M.; Suzuki H.; Ito K.; Abe T.; Sugiyama Y. Transcellular transport of organic anions across a double-transfected Madin–Darby canine kidney II cell monolayer expressing both human organic anion-transporting polypeptide (OATP2/SLC21A6) and multidrug resistance-associated protein 2 (MRP2/ABCC2). J. Biol. Chem. 2002, 277 (8), 6497–6503. [DOI] [PubMed] [Google Scholar]
- a Jani M.; Szabo P.; Kis E.; Molnar E.; Glavinas H.; Krajcsi P. Kinetic characterization of sulfasalazine transport by human ATP-binding cassette G2. Biol. Pharm. Bull. 2009, 32 (3), 497–499. [DOI] [PubMed] [Google Scholar]; b Urquhart B. L.; Ware J. A.; Tirona R. G.; Ho R. H.; Leake B. F.; Schwarz U. I.; Zaher H.; Palandra J.; Gregor J. C.; Dresser G. K.; Kim R. B. Breast cancer resistance protein (ABCG2) and drug disposition: intestinal expression, polymorphisms and sulfasalazine as an in vivo probe. Pharmacogenet. Genomics 2008, 18 (5), 439–448. [DOI] [PMC free article] [PubMed] [Google Scholar]; c Zaher H.; Khan A. A.; Palandra J.; Brayman T. G.; Yu L.; Ware J. A. Breast cancer resistance protein (Bcrp/abcg2) is a major determinant of sulfasalazine absorption and elimination in the mouse. Mol. Pharm. 2006, 3 (1), 55–61. [DOI] [PubMed] [Google Scholar]
- Roma M. G.; Crocenzi F. A.; Mottino A. D. Dynamic localization of hepatocellular transporters in health and disease. World J. Gastroenterol. 2008, 14 (44), 6786–6801. [DOI] [PMC free article] [PubMed] [Google Scholar]
- Tirona R. G.; Leake B. F.; Merino G.; Kim R. B. Polymorphisms in OATP-C: identification of multiple allelic variants associated with altered transport activity among European- and African-Americans. J. Biol. Chem. 2001, 276 (38), 35669–35675. [DOI] [PubMed] [Google Scholar]
- Balogh L. M.; Kimoto E.; Chupka J.; Zhang H.; Lai Y.. Membrane Protein Quantification by Peptide-Based Mass Spectrometry Approaches: Studies on the Organic Anion-Transporting Polypeptide Family. J. Proteomics Bioinf. 2012, 10.4172/jpb.S4-003. [Google Scholar]
- a Kullak-Ublick G. A.; Stieger B.; Hagenbuch B.; Meier P. J. Hepatic transport of bile salts. Semin. Liver Dis. 2000, 20 (3), 273–292. [DOI] [PubMed] [Google Scholar]; b Pal D.; Mitra A. K. MDR- and CYP3A4-mediated drug–herbal interactions. Life Sci. 2006, 78 (18), 2131–2145. [DOI] [PubMed] [Google Scholar]
- Fenner K. S.; Jones H. M.; Ullah M.; Kempshall S.; Dickins M.; Lai Y.; Morgan P.; Barton H. A. The evolution of the OATP hepatic uptake transport protein family in DMPK sciences: from obscure liver transporters to key determinants of hepatobiliary clearance. Xenobiotica 2012, 42 (1), 28–45. [DOI] [PubMed] [Google Scholar]
- Lau Y. Y.; Huang Y.; Frassetto L.; Benet L. Z. effect of OATP1B transporter inhibition on the pharmacokinetics of atorvastatin in healthy volunteers. Clinical Pharmacol. Ther. 2007, 81 (2), 194–204. [DOI] [PubMed] [Google Scholar]
- Jacobson T. A. Comparative pharmacokinetic interaction profiles of pravastatin, simvastatin, and atorvastatin when coadministered with cytochrome P450 inhibitors. Am. J. Cardiol. 2004, 94 (9), 1140–1146. [DOI] [PubMed] [Google Scholar]
- Smith N. F.; Marsh S.; Scott-Horton T. J.; Hamada A.; Mielke S.; Mross K.; Figg W. D.; Verweij J.; McLeod H. L.; Sparreboom A. Variants in the SLCO1B3 gene: Interethnic distribution and association with paclitaxel pharmacokinetics. Clin. Pharmacol. Ther. 2007, 81 (1), 76–82. [DOI] [PubMed] [Google Scholar]
- Ahlin G.; Hilgendorf C.; Karlsson J.; Szigyarto C. A.; Uhlen M.; Artursson P. Endogenous gene and protein expression of drug-transporting proteins in cell lines routinely used in drug discovery programs. Drug Metab. Dispos. 2009, 37 (12), 2275–2283. [DOI] [PubMed] [Google Scholar]
- E17βG and E3S have previously been identified as substrates of all three OATPs investigated in this paper. Using our cell models and experimental setup, the ratio between OATP1B1 or OATP1B3 and mock is greater when using E17βG as substrate as compared to using E3S. Similarly, the ratio between OATP2B1 and mock is greater when using E3S as compared to E17βG. Hence, in this study, E17βG is used as a model substrate for OATP1B1 and OATP1B3, whereas E3S is used as a model substrate of OATP2B1.
- Labute P. A widely applicable set of descriptors. J. Mol. Graphics Modell. 2000, 18 (4–5), 464–477. [DOI] [PubMed] [Google Scholar]
- a Nielsen P. A.; Olsen J. V.; Podtelejnikov A. V.; Andersen J. R.; Mann M.; Wisniewski J. R. Proteomic mapping of brain plasma membrane proteins. Mol. Cell. Proteomics 2005, 4 (4), 402–408. [DOI] [PubMed] [Google Scholar]; b Wisniewski J. R.; Zielinska D. F.; Mann M. Comparison of ultrafiltration units for proteomic and N-glycoproteomic analysis by the filter-aided sample preparation method. Anal. Biochem. 2011, 410 (2), 307–309. [DOI] [PubMed] [Google Scholar]; c Wisniewski J. R.; Zougman A.; Mann M. Combination of FASP and StageTip-based fractionation allows in-depth analysis of the hippocampal membrane proteome. J. Proteome Res. 2009, 8 (12), 5674–5678. [DOI] [PubMed] [Google Scholar]
- a Lins R. L.; Matthys K. E.; Verpooten G. A.; Peeters P. C.; Dratwa M.; Stolear J. C.; Lameire N. H. Pharmacokinetics of atorvastatin and its metabolites after single and multiple dosing in hypercholesterolaemic haemodialysis patients. Nephrol., Dial., Transplant. 2003, 18 (5), 967–976. [DOI] [PubMed] [Google Scholar]; b Schachter M. Chemical, pharmacokinetic and pharmacodynamic properties of statins: an update. Fundam. Clin. Pharmacol. 2005, 19 (1), 117–125. [DOI] [PubMed] [Google Scholar]
- Proctor N. J.; Tucker G. T.; Rostami-Hodjegan A. Predicting drug clearance from recombinantly expressed CYPs: intersystem extrapolation factors. Xenobiotica 2004, 34 (2), 151–178. [DOI] [PubMed] [Google Scholar]
- Copeland R. A., Evaluation of Enzyme Inhibitors in Drug Discovery—A Guide for Medicinal Chemists and Pharmacologists; Wiley Interscience: Hoboken, NJ, 2005; Vol. 46. [PubMed] [Google Scholar]
- Fujishima M.; Yanagisawa T.; Aoyama S.; Adachi Y.; Niomiya S., Evaluation of the applicability of the OATP1B1/MRP2 double-transfected cell line to in vitro hepatic vectorial transport. (Poster abstract, P520). 9th International ISSX Meeting, The International Society for the Study of Xenobiotics, Istanbul, Turkey, 2010, Vol. 42, no. S1, 323.
- a Nozawa T.; Tamai I.; Sai Y.; Nezu J.; Tsuji A. Contribution of organic anion transporting polypeptide OATP-C to hepatic elimination of the opioid pentapeptide analogue [D-Ala2, D-Leu5]-enkephalin. J. Pharm. Pharmacol. 2003, 55 (7), 1013–1020. [DOI] [PubMed] [Google Scholar]; b Gui C.; Hagenbuch B. Cloning/characterization of the canine organic anion transporting polypeptide 1b4 (Oatp1b4) and classification of the canine OATP/SLCO members. Comp. Biochem. Physiol., Part C: Toxicol. Pharmacol. 2010, 151 (3), 393–399. [DOI] [PMC free article] [PubMed] [Google Scholar]
- a Baldes C.; Koenig P.; Neumann D.; Lenhof H. P.; Kohlbacher O.; Lehr C. M. Development of a fluorescence-based assay for screening of modulators of human organic anion transporter 1B3 (OATP1B3). Eur. J. Pharm. Biopharm. 2006, 62 (1), 39–43. [DOI] [PubMed] [Google Scholar]; b Gui C.; Obaidat A.; Chaguturu R.; Hagenbuch B. Development of a cell-based high-throughput assay to screen for inhibitors of organic anion transporting polypeptides 1B1 and 1B3. Curr. Chem. Genomics 2010, 4, 1–8. [DOI] [PMC free article] [PubMed] [Google Scholar]
- Wang X.; Wolkoff A. W.; Morris M. E. Flavonoids as a novel class of human organic anion-transporting polypeptide OATP1B1 (OATP-C) modulators. Drug Metab. Dispos. 2005, 33 (11), 1666–1672. [DOI] [PubMed] [Google Scholar]
- a Hagenbuch B.; Meier P. J. The superfamily of organic anion transporting polypeptides. Biochim. Biophys. Acta 2003, 1609 (1), 1–18. [DOI] [PubMed] [Google Scholar]; b Leuthold S. D.Structure–Function Relationship of Organic Anion Transporting Polypeptides. Dissertation. ETH, 2007; no. 17208; [Google Scholar]; c Walters H. C.; Craddock A. L.; Fusegawa H.; Willingham M. C.; Dawson P. A. Expression, transport properties, and chromosomal location of organic anion transporter subtype 3. Am. J. Physiol., Gastrointest. Liver Physiol. 2000, 279 (6), G1188–1200. [DOI] [PubMed] [Google Scholar]
- a Bossuyt X.; Muller M.; Hagenbuch B.; Meier P. J. Polyspecific drug and steroid clearance by an organic anion transporter of mammalian liver. J. Pharmacol. Exp. Ther. 1996, 276 (3), 891–896. [PubMed] [Google Scholar]; b Cui Y.; Konig J.; Leier I.; Buchholz U.; Keppler D. Hepatic uptake of bilirubin and its conjugates by the human organic anion transporter SLC21A6. J. Biol. Chem. 2001, 276 (13), 9626–9630. [DOI] [PubMed] [Google Scholar]; c de Graaf W.; Hausler S.; Heger M.; van Ginhoven T. M.; van Cappellen G.; Bennink R. J.; Kullak-Ublick G. A.; Hesselmann R.; van Gulik T. M.; Stieger B. Transporters involved in the hepatic uptake of (99m)Tc-mebrofenin and indocyanine green. J. Hepatol. 2011, 54 (4), 738–745. [DOI] [PubMed] [Google Scholar]; d Kanai N.; Lu R.; Satriano J. A.; Bao Y.; Wolkoff A. W.; Schuster V. L. Identification and characterization of a prostaglandin transporter. Science 1995, 268 (5212), 866–869. [DOI] [PubMed] [Google Scholar]; e Kullak-Ublick G. A.; Hagenbuch B.; Stieger B.; Schteingart C. D.; Hofmann A. F.; Wolkoff A. W.; Meier P. J. Molecular and functional characterization of an organic anion transporting polypeptide cloned from human liver. Gastroenterology 1995, 109 (4), 1274–1282. [DOI] [PubMed] [Google Scholar]; f Westholm D. E.; Stenehjem D. D.; Rumbley J. N.; Drewes L. R.; Anderson G. W. Competitive inhibition of organic anion transporting polypeptide 1c1-mediated thyroxine transport by the fenamate class of nonsteroidal antiinflammatory drugs. Endocrinology 2009, 150 (2), 1025–1032. [DOI] [PMC free article] [PubMed] [Google Scholar]
- a Abe T.; Kakyo M.; Tokui T.; Nakagomi R.; Nishio T.; Nakai D.; Nomura H.; Unno M.; Suzuki M.; Naitoh T.; Matsuno S.; Yawo H. Identification of a novel gene family encoding human liver-specific organic anion transporter LST-1. J. Biol. Chem. 1999, 274 (24), 17159–17163. [DOI] [PubMed] [Google Scholar]; b Bailey D. G. Fruit juice inhibition of uptake transport: a new type of food–drug interaction. Br. J. Clin. Pharmacol. 2010, 70 (5), 645–655. [DOI] [PMC free article] [PubMed] [Google Scholar]; c Hsiang B.; Zhu Y.; Wang Z.; Wu Y.; Sasseville V.; Yang W. P.; Kirchgessner T. G. A novel human hepatic organic anion transporting polypeptide (OATP2). Identification of a liver-specific human organic anion transporting polypeptide and identification of rat and human hydroxymethylglutaryl-CoA reductase inhibitor transporters. J. Biol. Chem. 1999, 274 (52), 37161–37168. [DOI] [PubMed] [Google Scholar]; d Ito A.; Yamaguchi K.; Tomita H.; Suzuki T.; Onogawa T.; Sato T.; Mizutamari H.; Mikkaichi T.; Nishio T.; Unno M.; Sasano H.; Abe T.; Tamai M. Distribution of rat organic anion transporting polypeptide-E (oatp-E) in the rat eye. Invest. Ophthalmol. Vis. Sci. 2003, 44 (11), 4877–4884. [DOI] [PubMed] [Google Scholar]; e Pizzagalli F.; Hagenbuch B.; Stieger B.; Klenk U.; Folkers G.; Meier P. J. Identification of a novel human organic anion transporting polypeptide as a high affinity thyroxine transporter. Mol. Endocrinol. 2002, 16 (10), 2283–2296. [DOI] [PubMed] [Google Scholar]; f Suzuki T.; Abe T. Thyroid hormone transporters in the brain. Cerebellum 2008, 7 (1), 75–83. [DOI] [PubMed] [Google Scholar]
- a Cvetkovic M.; Leake B.; Fromm M. F.; Wilkinson G. R.; Kim R. B. OATP and P-glycoprotein transporters mediate the cellular uptake and excretion of fexofenadine. Drug Metab. Dispos. 1999, 27 (8), 866–871. [PubMed] [Google Scholar]; b Kis O.; Robillard K.; Chan G. N.; Bendayan R. The complexities of antiretroviral drug–drug interactions: role of ABC and SLC transporters. Trends Pharmacol. Sci. 2010, 31 (1), 22–35. [DOI] [PubMed] [Google Scholar]; c Tirona R. G.; Leake B. F.; Wolkoff A. W.; Kim R. B. Human organic anion transporting polypeptide-C (SLC21A6) is a major determinant of rifampin-mediated pregnane X receptor activation. J. Pharmacol. Exp. Ther. 2003, 304 (1), 223–228. [DOI] [PubMed] [Google Scholar]
- Oostendorp R. L.; van de Steeg E.; van der Kruijssen C. M.; Beijnen J. H.; Kenworthy K. E.; Schinkel A. H.; Schellens J. H. Organic anion-transporting polypeptide 1B1 mediates transport of Gimatecan and BNP1350 and can be inhibited by several classic ATP-binding cassette (ABC) B1 and/or ABCG2 inhibitors. Drug Metab. Dispos. 2009, 37 (4), 917–923. [DOI] [PubMed] [Google Scholar]
- Saller R.; Melzer J.; Reichling J.; Brignoli R.; Meier R. An updated systematic review of the pharmacology of silymarin. Forsch. Komplementmed 2007, 14 (2), 70–80. [DOI] [PubMed] [Google Scholar]
- a Drug Bioavailability—Estimation of Solubility, Permeability, Absorption and Bioavailability. 2nd completely rev. ed.; Wiley-VCH: Weinheim, 2009; Vol. 40; [Google Scholar]; b Cai S. Y.; Wang W.; Soroka C. J.; Ballatori N.; Boyer J. L. An evolutionarily ancient Oatp: insights into conserved functional domains of these proteins. Am. J. Physiol., Gastrointest. Liver Physiol. 2002, 282 (4), G702–710. [DOI] [PubMed] [Google Scholar]
- Kis O.; Zastre J. A.; Ramaswamy M.; Bendayan R. pH dependence of organic anion-transporting polypeptide 2B1 in Caco-2 cells: potential role in antiretroviral drug oral bioavailability and drug–drug interactions. J. Pharmacol. Exp. Ther. 2010, 334 (3), 1009–1022. [DOI] [PubMed] [Google Scholar]
Associated Data
This section collects any data citations, data availability statements, or supplementary materials included in this article.


