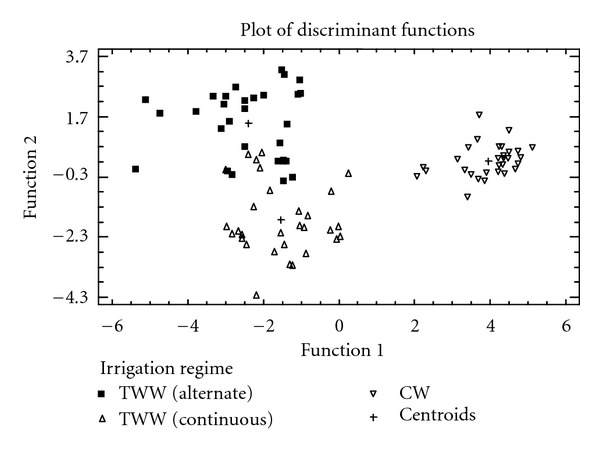
Figure 2.

LDA plot for 90 olive oil samples (30 samples repeated three times) based on the concentration of 19 elements and using as input a priori three groups, that is, those corresponding to the irrigation regimes: alternate and continuous using TWW and CW.
