

Abstract
Despite a push to create electronic health records and a plethora of healthcare data from disparate sources, there are no data from a single electronic source that provide a full picture of a patient’s hospital course. This paper describes a process to utilize electronically available inpatient hospital data for research. We linked several different sources of extracted data, including clinical, procedural, administrative, and accounting data, using patients’ medical record numbers to compile a cohesive, comprehensive account of patient encounters. Challenges encountered included (1) interacting with distinct administrative units to locate data elements; (2) finding a secure, central location to house the data; (3) appropriately defining health measures of interest; (4) obtaining and linking these data to create a usable format for conducting research; and (5) dealing with missing data. Although the resulting data set is incredibly rich and likely to prove useful for a wide range of clinical and comparative effectiveness research questions, there are multiple challenges associated with linking hospital data to improve the quality of patient care. Clin Trans Sci 2011; Volume 4: 338–345
Keywords: surveillance, electronic data, ICD9 codes
Introduction
For the past decade there has been a national commitment to enhance health information technology and develop electronic health records. These efforts are intended to monitor and improve evidence‐based practice and quality of care and secure patient information in a highly mobile environment. For example, the HiTech provisions of the American Recovery and Reinvestment Act of 2009 (Public Law 111–5) included $20 billion in spending to spur the adoption of electronic health records. Hospitals across the country have developed and/or adopted electronic methods to collect and store data, but electronic databases have often been designed for a specific purpose or department such as laboratory, radiology, pharmacy, patient tracking, clinician orders, central supply, or billing. Hence, many hospitals have a number of such databases which function well for one purpose but are unlinked and do not “speak to each other.” As a result, with few exceptions, such as the healthcare facilities of the Department of Veterans Affairs (http://www.ehealth.va.gov/VistA.asp), there may be a plethora of healthcare data available regarding therapies provided, test results, and costs of care, but often no single electronic source that provides a full picture of a patient’s hospital course(s).
In general, the United States has been slow to adopt electronic health records. 1 , 2 As of 2005 only 5% of hospitals used computerized physician order entry, 3 and even fewer had unified electronic health records. Hence, the current potential for using data to conduct comparative effectiveness research and monitor and improve the quality of patient care is limited and little is known about how these data can be used. In an ongoing NIH‐funded study of healthcare‐associated infections and predictors and costs of antimicrobial resistance among patients in a large hospital system (Distribution of the Costs of Antimicrobial Resistant Infections, 5R01NR10822), we found that relevant data were not readily available from a single source. A major limitation of commonly available data such as ICD‐9‐CM codes is that it only identifies health end points that are relevant for billing purposes. In addition, several studies have shown that ICD‐9‐CM representations of clinical events such as infections are inadequate for clinical research since they do not match well with clinical definitions. 4 Faced with this situation, we identified relevant data sources and developed algorithms to collate data from a variety of electronic sources. The purpose of this paper is to describe the process we used to combine various sources of electronically available inpatient hospital data for health services research.
Methods
Sample and setting
Data were extracted from various electronic databases from four sites in a large healthcare system in metropolitan New York City: the New York‐Presbyterian Hospital (NYPH) System. NYPH is the largest hospital system in the largest metropolitan region in the United States and includes a community hospital, pediatric hospital, and two tertiary/quaternary care hospitals that provide care to a diverse range of patients. Although the database was developed to study healthcare‐associated infections, and hence this paper disproportionately focuses on these outcomes, the approach is generalizable to a wide range of clinical research topics.
Data extraction
Clinical Data Warehouse (CDW).
The four hospital sites share a CDW that enables hospital or university personnel engaged in either clinical research or activities related to hospital treatment, payment, or operations to perform analytic queries on clinical data across patients. The Warehouse integrates data from over 20 clinical electronic sources and organizes the data by subject. We extracted the following data elements from the CDW: (1) laboratory results, including microbiologic results from blood, urine, and respiratory cultures, all cultures taken from possible surgical sites, and urine microscopy results; (2) patient location, including hospital unit, room and bed occupied for each day of hospital stay as well as patient’s home address; and (3) detailed accounts of medications administered and procedures performed, including use of central venous (CV) catheters.
Operating room data.
Data on procedures performed in the operating room were obtained from the perioperative services of each institution. Data included the date and time of entry in the operating room, commencement of and recovery from anesthesia, time of incision and closure, procedure descriptions and type of anesthesia used.
Administrative data.
Administrative data from the admission, discharge, transfer (ADT) billing, and coding and abstraction systems included admission and discharge dates, ICD‐9‐CM principal and secondary diagnosis and procedure codes with associated codes for diagnoses present on admission, and admission source and discharge destinations.
Cost accounting data.
Financial information for each discharge was obtained from the cost accounting system, including total charges and insurance/payer information. In addition, details for each item charged to the patient’s stay were collected, including date of service, charge amount, and UB‐92 revenue codes (maintained by the National Uniform Billing Committee), which identify specific accommodations.
Data from the electronic health record system.
Data on urinary catheter output was obtained through mediated queries to flowsheets in the physician and nursing order entry system (Eclipsys XA, http://www.allscripts.com/)
Linking data.
Patient information was linked across the multiple data sets using the unique account number associated with each hospital admission where available. In case of data for which account numbers were not available, source data were matched to the correct hospital stay using the unique medical record number and date/time stamps associated with source data. Once data sets were linked and processed, data sets were de‐identified by replacing account numbers and medical record numbers with unique identification numbers.
Algorithms for identifying infections
To study the cost of antimicrobial resistant infections, infection outcomes needed to be defined across multiple domains and axes: the type of infection, the date an infection occurred, the causative organism and its antimicrobial susceptibility pattern. Our team of clinicians and researchers developed electronic algorithms to identify hospital stays with any of four types of infections: blood stream infection, urinary tract infection, pneumonia and surgical site infections. We used the surveillance definitions from the Centers for Disease Control and Prevention National Healthcare Safety Network (NHSN, http://www.cdc.gov/nhsn/about.html) for healthcare‐associated infections 5 , 6 , 7 as a starting point to identify elements of these definitions which could be mapped to available electronic data. Using a combination of microbiologic results, urine microscopy results, and ICD‐9‐CM diagnoses codes, we identified patients as having an infection (cases), not having an infection (controls), and patients whom we could not clearly categorize (noncase, noncontrol). We separately identified cases for organisms of interest (those often associated with multidrug resistance) and for any organism. 8 Appendix provides a detailed description of the algorithms used.
Variables constructed
Using the data sources described earlier, we coded categories of variables for the final data set. A data dictionary describing all variables is available upon request from the authors. A limited set of patient demographics was also collected, namely age and zip code of residence, which could be used to link neighborhood level characteristics from external data sets such as the decennial census of housing and population. Admission and discharge variables included the date of admission, length of hospital stay, whether the patient died in the hospital, several variants of diagnosis related groups (DRGs), and measures of risk of mortality and severity of illness based on output from 3M’s grouper software, which uses a proprietary algorithm to assign an APR–DRG to each discharge. 9 Several measures of the health status of the patient were collected, including prior hospitalizations, diabetes, chronic dermatitis, trauma, burns, and history of substance abuse. ICD‐9‐CM diagnoses codes for conditions present on admission were used to calculate a weighted Charlson score as a measure of patients’ health status at admission. 10 Several measures of procedure based risk factors were collected, including the use of medications, CV catheterization, urinary catheterization, mechanical ventilation, cardiac catheterization, catheter angiography, vascular stenting, dialysis, surgical procedure, general anesthesia, intubation, and ICU stay. All of these variables included both the date the procedure started and ended. We also coded patients in whom an infection occurred, including details on the organism responsible, antibiotic susceptibility pattern and when the infection occurred. Financial variables collected included the total charges for the encounter, total payments received, along with information on the source of payment, and daily itemization of charges.
Given that some of the events varied throughout the course of a patient’s hospital stay (e.g., presence of a urinary catheter) while some were fixed throughout the stay (e.g., malignancy, diabetes), we created both time varying and time invariant variables. To allow for the construction of time varying variables, the unit of analysis was the patient‐day, so each patient encounter contributed one observation for each day in his or her length of hospital stay. This data set construction is analogous to the structure often used for discrete time survival models, hence making it possible to model risk factors for infections.
Imputation
The rollout of the electronic health record (Eclipsys; H/P Technologies, Phoenix, AZ, USA) was staggered at the four hospitals for the time period of our analysis. Because this system was primarily used in our data set to record the use of CV catheters, urinary catheters, and the administration of medication, these observations were frequently missing for earlier years. Because this pattern of “missingness” was due solely to the introduction of the new system, we imputed these variables to maintain a full sample.
We used two imputation procedures. To identify whether or not one of the three events (CV catheterization, urinary catheterization, and the administration of medication) had occurred for a patient, we used multiple imputation by chained equations 11 using logistic regression with all other available variables in the data set as predictors for the three events. Once we imputed these three variables, we then needed to impute the day the event started and the duration of the event. Because start and end dates must be restricted to occur within a patient’s hospital stay (i.e., we could not predict a CV catheter to be inserted on a patient’s tenth day if he only stayed in the hospital for 9 days) and the distribution of start day and duration are skewed, we performed hotdeck imputation, which replaces data for the missing observations (“recipients”) with data from nonmissing observations in the same sample that have similar characteristics (“donors”). 12 The “recipients” consisted of patients whose CV catheter, urinary catheter, and use of medications had just been imputed in the first step. The “donors” consisted of patients who had one of these events, but with the same length of stay as the recipient and a similar predicted probability of start day and duration. This predicted probability was obtained by estimating separate count models for start day and duration using all other variables in the data sets as predictors, using only the sample in which one of the events had occurred. Similar predicted probability was defined by grouping the predicted start day and duration into deciles.
Data extraction, manipulation and analysis were conducted using TOAD for DB2 version 3.1.1 (Quest Software, Aliso Viejo, CA, USA), SAS version 9.1.3 (SAS Institute, Cary, NC, USA) and Stata version 10.1 (Stata Corp, College Station, TX, USA) was used for imputation.
Results
Table 1 displays the summary of discharges for each hospital separately by year for all inpatient discharges from 2006 to 2008. Nearly 320,000 discharges occurred during this time period, with small increases in discharges at each hospital over the 3‐year period. Given the different target populations, there were considerably more discharges at the two tertiary care hospitals. 2, 3 and Table 3 display the number of discharges in which patients were identified as being infected according to our algorithms, separately by site, organism, and hospital. Consistent with the number of discharges across hospitals, there were more infections at the tertiary care hospitals. Table 4 displays the summary statistics of a subset of variables in the final data set.
Table 1.
Summary of discharges by hospital and year.
| Hospital/year | 2006 | 2007 | 2008 | Total |
|---|---|---|---|---|
| Community | 13,706 | 13,515 | 13,570 | 40,791 |
| Pediatric | 16,551 | 18,375 | 19,260 | 54,186 |
| Tertiary1 | 41,524 | 41,586 | 40,724 | 123,834 |
| Tertiary2 | 33,547 | 33,926 | 33,661 | 101,134 |
| Total | 105,328 | 107,402 | 107,215 | 319,945 |
Table 2.
Number of infections by any organism and hospital.
| Hospital | BSI1 | UTI2 | PNU3 | SSI4 |
|---|---|---|---|---|
| Community | 937 | 3,285 | 256 | 80 |
| Pediatric | 1,145 | 1,163 | 176 | 137 |
| Tertiary1 | 3,024 | 7,728 | 1,101 | 835 |
| Tertiary2 | 3,241 | 8,241 | 1,706 | 705 |
| Total | 8,347 | 20,417 | 3,239 | 1,757 |
Notes: 1BSI, blood stream infection; 2UTI, urinary tract infection; 3PNU, pneumonia; 4SSI, surgical site infection.
Table 3.
Number of infections caused by one of six organisms of interest.
| Site/organism | Acinetobacter baumannii | Enterococcus faecalis/faecium | Klebsiella pneumoniae | Pseudomonas aeruginosa | Staphylococcus aureus | Streptococcus pneumoniae | Total |
|---|---|---|---|---|---|---|---|
| BSI | 118 | 780 | 598 | 161 | 1,180 | 175 | 3,012 |
| UTI | 204 | 2,878 | 2,520 | 1,112 | 580 | 4 | 7,298 |
| PNU | 157 | 176 | 425 | 585 | 1,103 | 125 | 2,571 |
| SSI | 31 | 327 | 3 | 124 | 462 | 1 | 948 |
Table 4.
Summary statistics for select variables.
| Variable/hospital | Community | Pediatric | Tertiary1 | Tertiary 2 | Total |
|---|---|---|---|---|---|
| Age | 44.66 | 16.73 | 44.47 | 59 | 44.39 |
| % Male | 37.41 | 39.09 | 44.23 | 50.77 | 44.56 |
| Health status and procedures | |||||
| Length of stay (days) | 5.01 | 5.52 | 6.43 | 6.52 | 6.12 |
| % Diabetes mellitus | 17.87 | 2.45 | 12.51 | 24.89 | 15.40 |
| % Malignancy | 3.16 | 6.48 | 13.60 | 14.37 | 11.31 |
| % Chronic dermatitis | 5.97 | 1.50 | 3.89 | 4.75 | 4.02 |
| % Renal failure | 11.43 | 1.43 | 9.57 | 18.79 | 11.34 |
| % Substance abuse | 7.76 | 0.65 | 2.34 | 6.80 | 4.15 |
| % History of transplant | 0.11 | 1.24 | 1.57 | 2.74 | 1.70 |
| % Prior hospitalization | 30.23 | 24.48 | 26.09 | 39.50 | 30.58 |
| % History of stay at skilled nursing facility | 7.07 | 0.54 | 1.94 | 1.91 | 2.35 |
| % Central venous catheter | 2.16 | 6.34 | 7.22 | 9.00 | 6.99 |
| Days with central venous catheter | 6.52 | 13.09 | 10.56 | 9.01 | 10.16 |
| % Urinary catheterization | 26.55 | 31.40 | 39.69 | 39.25 | 36.47 |
| Days with urinary catheterization | 4.21 | 3.49 | 5.45 | 6.07 | 5.26 |
| % ICU stay | 4.80 | 13.77 | 26.95 | 11.60 | 17.04 |
| Number of days in ICU | 0.24 | 1.79 | 1.69 | 0.82 | 1.25 |
| % Mechanical ventilation | 2.17 | 4.07 | 3.48 | 3.57 | 3.44 |
| % Dialysis | 1.28 | 0.22 | 2.22 | 3.60 | 2.20 |
| % Biopsy | 0.38 | 1.31 | 1.37 | 2.47 | 1.58 |
| % Operating room procedure | 9.81 | 21.08 | 23.76 | 28.86 | 23.14 |
| % Endotracheal intubation | 1.75 | 3.23 | 2.51 | 3.15 | 2.74 |
| % General anesthesia | 6.69 | 19.81 | 20.35 | 22.75 | 19.28 |
| % Major operating room procedure (>30 min) | 8.34 | 20.63 | 21.58 | 27.65 | 21.65 |
| % Major organ transplant | 0.00 | 0.27 | 0.54 | 1.42 | 0.70 |
| % Cardiac catheterization/angiography/angioplasty/vascular stent | 0.20 | 2.21 | 10.61 | 19.23 | 10.6 |
| % Feeding tube insertion | 0.46 | 0.57 | 0.78 | 1.24 | 0.85 |
As one way of assessing the validity of our imputation, we compared the distribution of nonmissing observations to the distribution of missing (imputed) observations. Figures 1 and 2 display histograms for CV catheter, with Figure 1 showing the results for imputing the first day of insertion and Figure 2 showing the results for the duration of insertion (results are comparable for urinary catheter and medication administration). In both figures, the white bars represent cases where CV catheter data were complete (observed) and the dark bars representing cases in which CV catheter data were imputed. These figures demonstrate that our imputation procedure was generally effective in replicating the distribution of these variables.
Figure 1.
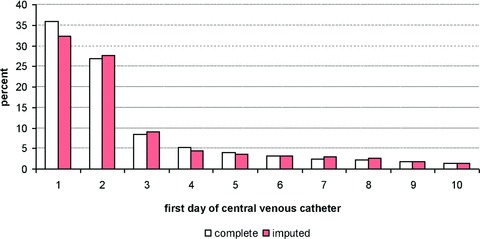
Result of impulation for fi rst day of central venous catheter.
Figure 2.
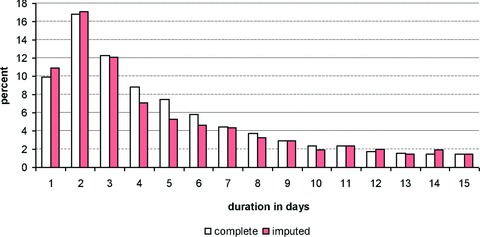
Result of impulation for duration of central venous catheter.
Discussion
Although a fully integrated database is essential for comparative effectiveness and outcomes research, the initial development phase of this project posed a number of challenges and required considerable time. In fact, the process required almost 2 years of work of a team including a clinician, economist, epidemiologist, and an experienced programmer and statistician. Major challenges that we encountered are discussed below, and included identifying and obtaining permission for access to data sources, limitations regarding extraction of text‐based data, and technical issues regarding merging various systems across institutions.
In many healthcare systems, departments or service lines often operate independently; it is thus not surprising that silos or fiefdoms develop to facilitate getting work accomplished efficiently. Considerable effort was required in this project to first identify within each department and across settings the “proprietor” or steward/manager of specific data sources and then to work with them to obtain the necessary permissions to access and use the data. There were no specific protocols or guidelines in place to clarify how this should be done, and in some cases it was difficult to determine who actually had the right to grant access to data for anyone outside their specific area. Over a period of months, we had multiple conversations with various individuals to develop our own list of individuals with the authority to grant access. Because multiple and varying electronic data collection systems had been purchased or internally developed by many individual departments or divisions, this was one of the most time consuming tasks we encountered. To facilitate future efforts to consolidate data bases, we recommend that healthcare systems begin to identify the various sources of clinical, administrative and financial data and develop policies and procedures to access and use the data.
Natural language processing (NLP) algorithms have been used in a number of clinical applications to extract useful information for research. 13 , 14 , 15 In this study, we considered using NLP algorithms to extract data from text‐based records such as nursing notes and radiology reports. We found, however, that while it was possible, we chose not to pursue using NLP for several reasons. First, a huge investment in additional time and resources would have been necessary and we did not see sufficient value added to make the cost worth the effort. Secondly, even when NLP algorithms are established, they are often not sufficiently sensitive to assure efficient and accurate retrieval of useable information. 15 Most importantly, our first priority was to create a system that was potentially generalizable across institutions in which the required NLP expertise might not be. Although our study is limited by the fact that we do not have data extracted from text notations, this is also an advantage in terms of generalizability and sustainability.
Finally, and not surprisingly, we encountered technical issues regarding merging various software and data formats across institutions. Despite the fact that the four hospitals in this study were part of a single large hospital system, the institutions varied with regard to the electronic record systems used. In fact, during the study period, one of the hospitals changed electronic medical records systems and, as noted in Methods, some data elements were not available for the entire study period at all sites, necessitating the application of imputation methods. Such technical problems require considerable programming expertise.
Clearly, the extensive resources required to overcome such challenges are not justifiable if the database remains static for a short period of time, because the data will quickly become outdated and less relevant for research or quality monitoring. Hence, we are now in the process of incorporating the database into the institution’s Clinical Data Warehouse as a datamart, and setting up automatic feeds to update the data on a continuous, ongoing basis. The database to date has been used to examine clinical problems related to infections such as identifying risk factors for multidrug resistant infections, examining the relationship between short bowel syndrome and incidence of bloodstream infection, and correlating measures of glucose control and risk of surgical site infection in diabetics and nondiabetics. Additional data elements can be added to the database for investigators seeking to test other specific hypotheses. We plan to widely disseminate information regarding the availability of these data to investigators within and outside the study institutions.
Although the algorithms developed to identify infections were specific to the focus of our grant on healthcare acquired infections, the general process described above is generalizable to a wide range of settings and studies, such as studies of the impact of various therapies or interventions on patient outcomes or changes in trends over time. Much of the general procedures discussed above reflect the necessary “first step” for obtaining and merging data; the “second step” would require the development of algorithms specific to a particular study to improve the measurement of health outcomes. This paper simply highlights one such algorithm, though the range of outcomes that could potentially be studied extends far beyond this setting.
Conclusion
Given that it is not always possible to design randomized clinical trials to understand the impact of various clinical interventions, researchers must often instead rely on retrospectively collected data from various sources. In analyses using retrospective data, it becomes more important to account for the full range of experiences patients encounter in the healthcare system. Detailed information on these encounters is often recorded electronically, but these data are typically stored in distinct databases, thus limiting researchers’ ability to compile a cohesive, comprehensive account of patient encounters.
In this paper, we have described the steps we have taken to compile such a database from a major hospital system in New York City as part of a larger study to examine the impact of antimicrobial‐resistant infections on the costs to society. Several obstacles were encountered in this process that are likely to be common across other settings, including: (1) interacting with distinct administrative units to locate data elements; (2) finding a secure, central location to house the data; (3) appropriately defining health measures of interest; (4) obtaining and linking these data to create a usable format for conducting research; and (5) dealing with missing data. Although some of the steps we have taken to address these issues are context specific, these steps are likely to serve as a general guideline for creating such data sets in other large healthcare systems.
The resulting data set is an incredibly rich one that is likely to prove useful for a wide range of clinical research questions. Looking ahead, a major focus centers on maintaining the sustainability of these data to ensure they can be regularly updated to include additional years of data as it becomes available.
Acknowledgments
The study was funded by NIH/NINR Grant R01 NR010822, Distribution of the Costs of Antimicrobial Resistant Infections. We gratefully acknowledge the administrative support of Bevin Cohen and statistical expertise of Jennifer Hill and Haomiao Jia.
Appendix: Algorithms used to define infection outcomes
Blood stream infections
| Organism of interest1 | Any organism |
|---|---|
| Case | Case |
| Positive blood culture for an organism of interest AND No positive culture with the same organism at other body site(s) within 14 days prior to positive blood culture | Positive blood culture with any organism2 AND No positive culture with the same organism at other body site(s) within 14 days prior to positive blood culture |
| Control | Control |
| No positive blood culture for any organism | No positive blood culture for any organism OR Only one culture with common skin contaminant within 2 day period |
| Noncase, noncontrol | Noncase, noncontrol |
| Positive blood culture with an organism NOT of interest OR ICD‐9‐CM code for sepsis and no/negative blood culture OR Positive culture with the same organism at other body site(s) within 14 days prior to a positive blood culture | ICD‐9‐CM code for sepsis and no/negative blood culture OR Positive culture with the same organism at other body site(s) within 14 days prior to a positive blood culture |
Urinary tract infections
| Organism of interest1 | Any organism |
|---|---|
| Case | Case |
| Positive urine culture with an organism of interest, that is, ≥105 colony forming units per mL of urine and no more than one other species of microorganism OR Positive urine culture with an organism of interest, that is, 103–105 colony forming units per mL of urine and no more than one other species of microorganism and pyuria (≥ 3 white blood cells per high power field in urine microscopy) within ±48 hours of positive culture | Positive urine culture with any organism, that is, ≥105 colony forming units per mL of urine and no more than one other species of microorganism OR Positive urine culture with any organism, that is, 103–105 colony forming units per mL of urine and no more than one other species of microorganism and pyuria (≥ 3 white blood cells per high power field in urine microscopy) within ±48 hours of positive culture |
| Control | Control |
| No positive urine culture with any organism AND No physician diagnosis of a urinary tract infection (ICD‐9‐CM coding) | No positive urine culture with any organism AND No physician diagnosis of a urinary tract infection (ICD‐9‐CM coding) |
| Noncase, Noncontrol | Noncase, Noncontrol |
| Positive urine culture with an organism not of interest OR ICD‐9‐CM code for UTI + NO positive urine culture with any organism | ICD‐9‐CM code for UTI and no positive urine culture with any organism |
Surgical site infection
| Organism of interest1 | Any organism |
|---|---|
| Case | Case |
| Any NHSN3 operative procedure (as per ICD‐9‐CM procedure code) performed AND Positive wound culture for an organism of interest within 30 days of NHSN procedure | Any NHSN operative procedure (as per ICD‐9‐CM procedure code) performed AND Positive wound culture for any organism within 30 days of NHSN procedure |
| Control | Control |
| NHSN operative procedure performed (as per ICD‐9‐CM code) AND No wound culture performed | NHSN operative procedure performed (as per ICD‐9‐CM code) AND No wound culture performed |
| Noncase, noncontrol | Noncase, noncontrol |
| No NHSN operative procedure performed OR NHSN operative procedure performed followed by negative wound culture within 30 days OR NHSN operative procedure performed followed by a positive wound culture with an organism other than an organism of interest OR NHSN operative procedure performed + no wound culture performed, but encounter has an ICD‐9‐CM code for Postoperative infection | No NHSN operative procedure performed OR NHSN operative procedure performed followed by negative wound culture within 30 days OR NHSN operative procedure performed + no wound culture performed, but encounter has an ICD‐9‐CM code for Postoperative infection |
Pneumonia
| Organism of interest1 | Any organism |
|---|---|
| Case | Case |
| ICD‐9‐CM coding for pneumonia (includes all bacterial PNU codes) AND positive respiratory culture with an organism of interest | ICD‐9‐CM coding for pneumonia (includes all PNU codes) AND positive respiratory culture with any organism |
| Control | Control |
| No ICD‐9‐CM code for pneumonia AND No respiratory culture performed or a negative respiratory culture | No ICD‐9‐CM code for pneumonia AND No respiratory culture performed or a negative respiratory culture |
| Noncase, noncontrol | Noncase, noncontrol |
| ICD‐9‐CM code for pneumonia and positive respiratory culture for an organism NOT of interest OR ICD‐9‐CM code for pneumonia and no positive respiratory culture performed or negative respiratory culture OR No ICD‐9‐CM code for bacterial pneumonia + positive respiratory culture for any organism OR No ICD‐9‐CM code for bacterial pneumonia + positive urine streptococcal antigen | ICD‐9‐CM code for pneumonia and no positive respiratory culture performed OR negative respiratory culture OR No ICD‐9‐CM code for pneumonia + positive respiratory culture for any organism OR No ICD‐9‐CM code for pneumonia + Positive urine streptococcal antigen |
Notes: 1Organisms of interest are Staphylococcus aureus, Klebsiella pneumoniae, Enterococcus faecalis, Enterococcus faecium, Pseudomonas aeruginosa, Acinetobacter baumannii, Streptococcus pneumoniae. 2A common skin contaminant must be cultured from two or more blood cultures drawn on separate occasions within 2 days of each other to count as positive culture. Common skin contaminants in blood culture include diphtheroids (Corynebacterium spp.), Bacillus (not B. anthracis) spp., Propionibacterium spp., coagulase‐negative staphylococci (including S. epidermidis), viridans group streptococci, Aerococcus spp., Micrococcus spp.). 3NHSN, National Healthcare Safety Network.
References
- 1. Balfour DC 3rd, Evans S, Januska J, Lee HY, Lewis SJ, Nolan SR, Noga M, Stemple C, Thapar K. Health information technology—results of a roundtable. J Manag Care Pharm. 2009; 15(1 Suppl. A): 10–17. [DOI] [PMC free article] [PubMed] [Google Scholar]
- 2. Poon EG, Jha AK, Christino M, Honour MM, Fernandopulle R, Middleton B, Newhouse J, Leape L, Bates DW, Blumenthal D, et al Assessing the level of health information technology in the United States: a snapshot. BMC Med Informat Decis Mak. 2006; 6: 1. [DOI] [PMC free article] [PubMed] [Google Scholar]
- 3. Jha AK, Ferris TG, Donelan K, DesRoches C, Shields A, Rosenbaum S, Blumenthal D. How common are electronic health records in the United States? A summary of the evidence. Health Aff (Millwood) 2006; 25: w496–w507. [DOI] [PubMed] [Google Scholar]
- 4. Sherman ER, Heydon KH, St. John KH, Teszner, E , Rettig, SL , Alexander, SK , Zaoutis, TZ , Coffin, SE . Administrative data fail to accurately identify cases of healthcare‐associated infection. Infect Contr Hosp Epidemiol. 2006; 27: 332–337. [DOI] [PubMed] [Google Scholar]
- 5. Stevenson KB, Khan Y, Dickman J, Gillenwater, T , Kulich, P , Taylor, D , Santangelo, J , Lundy, J , Jarjoura, D . Administrative coding data, compared with CDC/NHSN criteria, are poor indicators of health care‐associated infections. Am J Infect Control 2008; 36: 155–164. [DOI] [PubMed] [Google Scholar]
- 6. Horan TC, Andrus M, Dudeck MA. CDC/NHSN surveillance definition of health care‐associated infection and criteria for specific types of infections in the acute care setting. Am J Infect Control. 2008; 36: 309–332. [DOI] [PubMed] [Google Scholar]
- 7. National Healthcare Safety Network (NHSN) [Internet]. Atlanta : Centers for Disease Control and Prevention; Available from: http://www.cdc.gov/nhsn/library.html (accessed on November 1, 2010). [Google Scholar]
- 8. Landers T, Apte M, Hyman S, Furuya, Y , Glied, S , Larson, E . A comparison of methods to detect urinary tract infections using electronic data. Jt Comm J Qual Patient Saf. 2010; 36: 411–417. [DOI] [PMC free article] [PubMed] [Google Scholar]
- 9. All Patient Refined Diagnosis Related Groups (APR‐DRGs) . Version 20.0. Available from: http://www.hcup‐us.ahrq.gov/db/nation/nis/APR‐DRGsV20MethodologyOverviewandBibliography.pdf. Wallingford , CT : 3M Health Information Systems; 2003. Accessed September 29, 2011. [Google Scholar]
- 10. Charlson ME, Pompei P, Ales KL, MacKenzie CR. A new method of classifying prognostic comorbidity in longitudinal studies: development and validation. J Chronic Dis. 1987; 40: 373–383. [DOI] [PubMed] [Google Scholar]
- 11. Van Buuren S, Brand J, Groothuis‐Oudshoorn CD, Rubin D. Fully conditional specification in multivariate imputation. J Stat Comput Simul 2006; 76: 1049–1064. [Google Scholar]
- 12. Allison PD. Missing Data (Quantitative Applications in the Social Sciences), Thousand Oaks , CA : Sage, 2002: 27–72. [Google Scholar]
- 13. Xu H, Jiang M, Oetjens M, Bowton EA, Ramirez AH, Jeff JM, Basford MA, Pulley JM, Cowan JD, Wang X, et al Facilitating pharmacogenetic studies using electronic health records and natural language processing: a case study of warfarin. J Am Med Inform Assoc. 2011; 18: 387–391. [DOI] [PMC free article] [PubMed] [Google Scholar]
- 14. Womack JA, Scotch M, Gibert C, Chapman W, Yin M, Justice AC, Brandt C. A comparison of two approaches to text processing: facilitating chart reviews of radiology reports in electronic medical records. Perspect Health Inf Manag. 2010; 7: 1a. [PMC free article] [PubMed] [Google Scholar]
- 15. Mendonca EA, Haas J, Shagina L, Larson E, Friedman C. Extracting information on pneumonia in infants using natural language processing of radiology reports. J Biomed Inform. 2005; 38: 314–321. [DOI] [PubMed] [Google Scholar]