Abstract
The tumor suppressor protein, p53, is either mutated or absent in >50% of cancers and is negatively regulated by the mouse double minute (MDM2) protein. Understanding and inhibition of the MDM2-p53 interaction are, therefore, critical for developing novel chemotherapeutics, which are currently limited because of a lack of appropriate study tools. We present a nanosensing approach to investigate full-length MDM2 interactions with p53, thus providing an allosteric assay for identifying binding ligands. Surface-enhanced Raman scattering (SERS)-active nanoparticles, functionalized with a p53 peptide mimic (peptide 12.1), display biologically specific aggregation following addition of MDM2. Nanoparticle assembly is competitively inhibited by the N-terminal MDM2-binding ligands peptide 12.1 and Nutlin-3. This study reports nanoparticle assembly through specific protein–peptide interactions that can be followed by SERS. We demonstrate solution-based MDM2 allosteric interaction studies that use the full-length protein.
Keywords: assay system, biosensing, nano-assembly, protein interaction studies, Raman spectroscopy
The p53 tumor suppressor protein is often referred to as the “guardian of the genome” owing to its key role in cell-cycle regulation and its activity in a number of different cancer pathways (1–3). The antiproliferative action of p53 arises from the induction of cell-cycle arrest and apoptosis in cells subjected to DNA damage in response to stress. As such, p53 is central to protecting cells from uncontrolled growth and malignant transformation with inactivation or mutation of p53 found in over 50% of human cancers (1–3). Under nonstressed conditions, mouse double minute (MDM)2 negatively regulates p53, primarily through the ubiquitin degradation pathway but also via transrepression (4, 5). Studies have shown up-regulation of MDM2 in malignancies where p53 is fully functional, making the MDM2-p53 feedback loop of great interest in chemotherapeutic studies (6, 7).
MDM2 is a multidomain protein that exerts E3-ligase activity on a number of proteins, including p53 (5, 8, 9). The ubiquitination activity of MDM2 is a multisubunit process whereby the N-terminal hydrophobic pocket and central acidic domain of MDM2 are used in p53 binding, to the N-terminal and central domains of p53, respectively (10). The complexity of this multisubunit interaction makes it relatively difficult to investigate the allosteric nature of MDM2. This is made more difficult by the problems in acquiring a structure of full-length MDM2 because of intrinsically disordered regions on the protein that reduce likelihood of crystallization. Focus solely on the N-terminal domain of MDM2 has identified Nutlin-3-type molecules that activate p53 in cells; however, these also act as allosteric agonists that stimulate rather than inhibit p53 ubiquitination (10–15). The putative dimerization of MDM2 through the C-terminal really interesting new gene (RING) domain is reported to be critical for E3-ligase activity; however, molecular reasoning for this is not fully understood (8, 16–18). To date, studies on MDM2 structure have been conducted with purified domain constructs, which is not representative of full-length protein activity in nature.
Using full-length MDM2, which has the capacity to exhibit allosteric interactions (19, 20), would provide an assay for the screening of MDM2 ligands. Domain construct studies have investigated the multiple binding interactions of MDM2, but few, thus far, have used unlabeled full-length protein to simultaneously interrogate two binding events. The assay described in this report monitors both N-terminal and C-terminal activities of MDM2 simultaneously using full-length protein, which is critical to understanding the biological action of the native protein. The methodology provides a step forward in the capability for investigating such intricate interactions, and a unique insight is provided into the allosteric nature of native MDM2 that cannot be observed using other techniques.
Current methodologies used to probe interactions in biological systems commonly use readout tools such as fluorescence (21–23). This technique is subject to a high background from biological media and is limited by broad emission bands and the inability to probe interactions over distances of more than 10 nm. Surface-enhanced Raman scattering (SERS) is a vibrational spectroscopy that can provide similar sensitivity to fluorescence, but narrower spectral peaks allow for simultaneous detection of multiple species (24, 25). SERS interrogates an analyte, adsorbed onto a roughened metal surface, from which further Raman signal enhancement is achieved by coinciding the laser excitation wavelength with the analyte absorbance maxima (26, 27). SERS can also be enhanced or “turned on” by aggregation of nanoparticles (NPs) in solution because of “hot spots” of higher electromagnetic fields at NP junctions (26–28). Cotton et al. pioneered the use of NP and SERS for proteomic investigations and developed the first SERS-based enzyme immunoassay in 1989 (29). Subsequently, a number of SERS-based immunoassays have been documented (30–39). Assembly of functionalized NPs via protein–ligand interactions has been previously demonstrated using techniques such as extinction spectroscopy, transmission electron microscopy, and gel electrophoresis, all of which lack the sensitivity of SERS (40–44). Such interactions have been detected via SERS on metal surfaces, where binding events are compromised by protein orientation and conformation at the surface. Solution-based studies allow structural integrity of the full-length protein to be maintained, thus providing accurate information about complex interactions: however, such investigations have yet to be reported (36).
In this report, we outline a method for NP assembly through the interaction of full-length MDM2 with an N-terminal-domain peptide ligand. By exploiting the sensitivity and selectivity of SERS, we provide insight into the allosteric nature of MDM2 in solution, which is not achievable by current methodologies, which only monitor one binding interaction, involve protein labeling, or require surface immobilization.
Results
Protein–Peptide Nanoparticle Assembly.
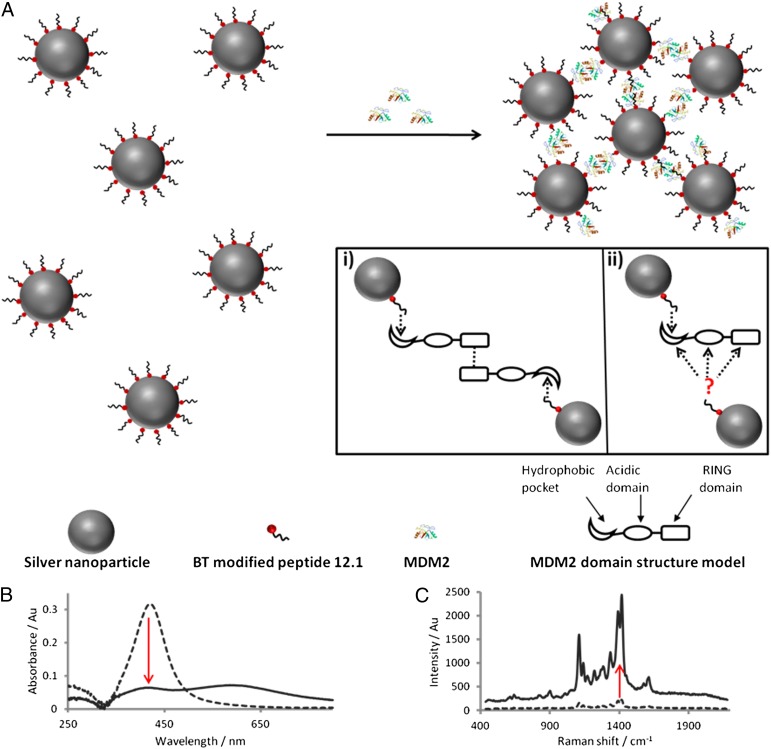
We propose a solution-based approach to investigate the interaction of full-length MDM2 with a p53 peptide mimic exploiting the sensitivity and selectivity of SERS. p53 is known to bind the N-terminal hydrophobic pocket of MDM2 by forming an ampipathic helix containing the peptide motif, FxxxWxxL (45). Peptide 12.1 (MPRFMDYWEGLN) originates from a library of p53 peptide mimics and demonstrates high-affinity binding to the MDM2 hydrophobic cleft (46). Tryptophan, a key residue involved in aromatic-aromatic interactions with MDM2 (47, 48), was replaced with alanine to create the mutant peptide 12.1WΔA, which provided a negative control to ensure biological specificity of the interaction. In theory, putative dimerization of full-length MDM2 (through its RING domain) would present two N-terminal hydrophobic pockets free (per dimer) to interact with ligands such as peptide 12.1. N-terminal interactions with peptide ligand, therefore, allow the MDM2 dimer to bring together two peptide 12.1 functionalized silver NP, peptide silver nanoparticle (PSN)-12.1, in solution (Fig. 1A, i). An alternative model for PSN-12.1 assembly, via a secondary peptide 12.1-binding site, is also illustrated (Fig. 1A, ii). The latter is unlikely because there is no evidence for two different peptide 12.1-binding sites on MDM2, and cell based studies suggest MDM2 is oligomeric in solution (16). MDM2-induced aggregation can be monitored over time by extinction spectroscopy and premodifying peptide 12.1 with a benzotriazole Raman tag, BT, enables the process to be explored using SERS. Both extinction and SERS intensity can be monitored over time to investigate the biological interactions driving this NP-assembly process.
Fig. 1.
(A) Schematic of the proposed assembly of PSN through specific interactions between MDM2 and peptide 12.1 (not to scale). Inset shows two proposed models for MDM2 bivalency resulting in PSN aggregation from a MDM2 dimerization (e.g., “oligomeric”) conformation (i) and monomeric MDM2 (ii) have two distinct binding sites with the known and an alternative peptide 12.1 binding site (not to scale). (B and C) Extinction spectroscopy (B) and SERS analysis (C) before (dashed) and after (solid line) addition of MDM2 to PSN-12.1.
Peptide Silver Nanoparticles.
Reproducibility of spectra from Raman reporters used in SERS-based immunoassays is extremely important to obtain reliable results. Benzotriazole dyes adsorb onto silver nanoparticle surfaces in the same orientation irrespective of concentration, resulting in reproducible Raman spectral intensities (49). This is attributable to steric hindrance presented by covalent interactions between N1 and N3 lone electron pairs with the silver surface (50, 51). BT has an absorbance λmax of 487 nm and, as such, is close in resonance when using an excitation wavelength of 514 nm. The most prominent peak in the BT Raman spectrum occurs at a shift of 1,416 cm−1 (Fig. 1C) and can be attributed to the azo stretch in the dye structure (Fig. S1).
Peptide 12.1 and mutant peptide 12.1WΔA were modified with BT and directly conjugated to EDTA-reduced silver NP (AgEDTA) in a one-step reaction. BT consists of a triazole moiety with an affinity for silver surfaces, a Raman active chromophore, and a stabilizing polyethylene glycol spacer (Fig. S1). Circular dichroism (CD) analysis of peptide 12.1 and BT-modified peptide 12.1 showed the modification to have no inhibitory effect on the peptide adopting a helical conformation (Fig. S2). BT-modified peptide 12.1 and mutant peptide 12.1WΔA displayed high- and low-level binding, respectively, to MDM2 in ELISA competition assays (Fig. S3). Successful PSN formation was shown by an increase in particle size through extinction spectroscopy, and matrix-associated laser desorption ionization–mass spectroscopy (MALDI-MS) analysis was used to identify BT-peptide molecules anchored on the nanoparticle surface (Figs. S4 and S5).
MDM2-Induced PSN Aggregation.
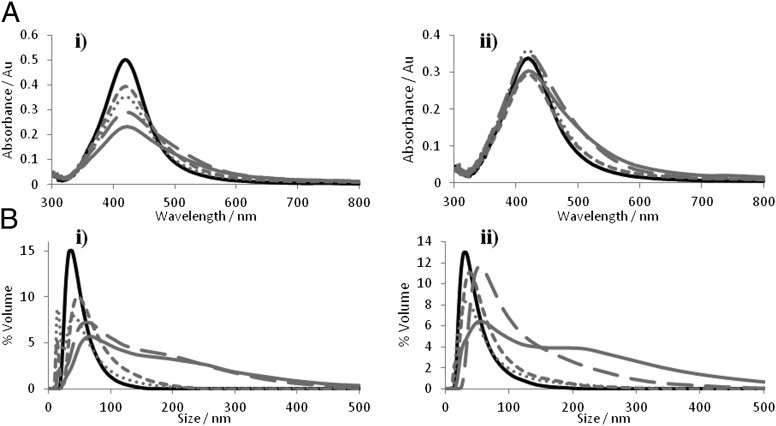
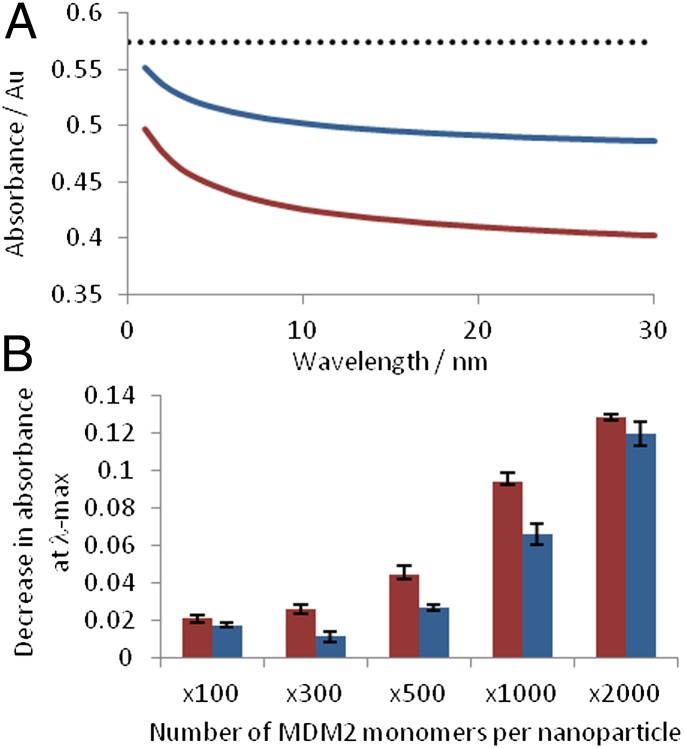
Unlabeled full-length MDM2 was added to PSN solutions at various concentrations based on a molar excess of protein to PSN. This is in line with previously published data using streptavidin for controlled assembly of biotin-functionalized gold NP (40). Aggregation of 15 pM PSN-12.1 in solution was observed following the addition of MDM2 in a concentration-dependent manner, as shown by the plasmon band decrease monitored by extinction spectroscopy (Figs. 2 and 3). A dampening in the band at 419 nm and an increase at longer wavelengths are indicative of aggregate formation, verified by the change in NP size distribution shown by dynamic light scattering (Fig. 2B). Biological specificity of the MDM2–peptide 12.1 interaction was confirmed by using mutant PSN-12.1WΔA samples in which aggregation was observed to a much lesser extent at MDM2 concentrations up to a NP: protein ratio of 1:1,000 (15 pM PSN, 15 nM MDM2) (Figs. 2 and 4 and SI Text). This confirms the importance of specific amino acid residues in the binding event between MDM2 and NP-bound peptide. At protein concentrations higher than this, the extent of aggregation between PSN-12.1 and PSN-12.1WΔA solutions cannot be distinguished by extinction spectroscopy or dynamic light scattering (Figs. 2 and 3). At these concentrations, MDM2 is present in such excess that binding to the mutant peptide 12.1WΔA is comparable to that of peptide 12.1, indicating a saturation point to the assay. Extinction spectroscopic measurements of samples taken 96 h after MDM2 addition show a much greater distinction in aggregation extent between PSN-12.1 and the mutant PSN-12.1WΔA up to the saturation concentration of 15 nM MDM2 (Fig. 2A); however, such a time duration for an immunoassay is impractical. The PSN assembly process can be monitored over time by measuring the extinction change at the λ-max, and aggregation was seen to plateau within the first 30 min (Fig. 3A). These data correlate with previous literature describing binding of p53 BOX-I to the MDM2 hydrophobic cleft to be a stable, high-affinity interaction. PSN-12.1 assembly can be interpreted through either of the models proposed in Fig. 1A; however, because there is no evidence to support the latter, the most likely explanation for the observed PSN aggregation is an active MDM2-dimer (or “oligomer”).
Fig. 2.
Extinction spectroscopy and particle size analysis of PSN solutions before and after addition of MDM2. (A and B) Extinction profiles (A) and particle size distributions (B) of PSN-12.1 (i) and PSN-12.1WΔA (ii) samples without MDM2 (black) and 96 h after addition of 300 (dotted gray), 500 (short dashed gray), 1,000 (long dashed gray), and 2,000 (solid gray) MDM2 monomers per PSN.
Fig. 3.
Extinction spectroscopy analysis of PSN aggregation. (A) Extinction spectroscopy monitored for a 30-min duration following MDM2 addition to PSN-12.1 (red) and PSN-12.1WΔA (blue) at a PSN:MDM2 molar ratio of 1:1,000. Dotted line indicates the average plasmon band intensity before MDM2 addition. (B) Change in the plasmon band monitored from the 1–30 min after MDM2 addition. Error bars illustrate the SD.
Fig. 4.
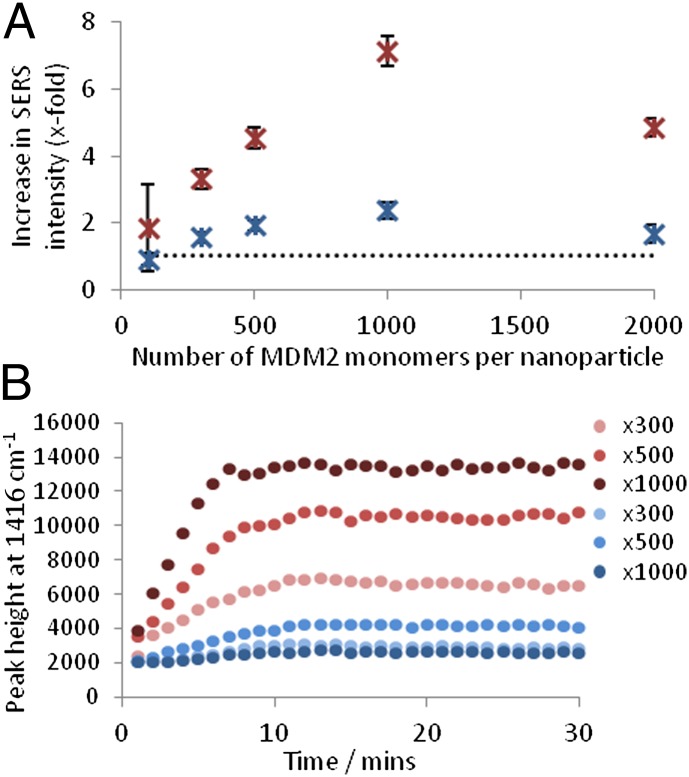
SERS analysis of PSN aggregation. (A) Calculated x-fold increase in SERS intensity following MDM2 addition to PSN-12.1 (red) and PSN-12.1WΔA (blue). (B) Peak height at 1416 cm−1 monitored every 60 seconds for 30 min following addition of varying amounts of MDM2 to PSN-12.1 (red) and PSN-12.1WΔA (blue). X-value represents the excess of MDM2 monomers per PSN. Dotted line indicates PSN samples when MDM2 is absent. Error bars illustrate the SD.
MDM2-Induced Aggregation “Turns On” SERS.
Initial SERS studies involved analysis of PSN samples after completion of aggregate assembly monitored by extinction spectroscopy. SERS enhancement was measured by comparing the standardized peak height at 1,416 cm−1 (Fig. 1B) for each sample in relation to unaggregated PSN solutions. Raman signal intensity increased in a positive correlation with MDM2 concentration up to a molar ratio of 1:1,000 PSN:MDM2 (15 pM PSN, 15 nM MDM2) (Fig. 4). This corresponds with previous extinction spectroscopy investigations indicating assay saturation at this concentration. When MDM2 was present at a larger molar excess than 1:1,000, a decrease in SERS intensity was observed (Fig. 4A). At these concentrations, protein can form almost monolayer coverage on the PSN surface, thus dampening Raman signals associated with BT but still allowing aggregation, as seen by extinction spectroscopy (Fig. 3B). Another possibility is that large aggregates form that fall out of solution; however, this explanation is contradicted by the partial aggregation observed in scanning electron microscopy (SEM) (Fig. S6). At a molar ratio of 1:1,000 PSN:MDM2 (15 pM PSN, 15 nM MDM2), an eightfold increase in peak height was observed compared with samples where protein was absent. No such signal enhancement was apparent for PSN-12.1WΔA samples or when MDM2 was replaced with a control protein, BSA (Fig. 4A and Fig. S7). This demonstrated the high biological specificity of the interaction, further validated by additional MDM2 binding studies (Fig. S8). SERS analysis of MDM2-induced PSN aggregation enables protein detection at a molar excess of 100 MDM2 per PSN (15 pM PSN, 1.5 nM MDM2), demonstrating a lower limit of detection than was achievable using extinction spectroscopy (Figs. 3B and 4A). Comparable results for PSN-12.1 and PSN-12.1WΔA samples were also more distinguishable when applying SERS rather than extinction spectroscopy (Figs. 3 and 4). These data indicate that SERS presents a more sensitive analysis technique than extinction spectroscopy for NP assembly controlled by biological interactions.
Temporal SERS Analysis of Aggregation.
Our findings show that the assembly of PSN-12.1 with MDM2 is a time- and concentration-dependent process (Fig. 3). To this end, SERS analysis was investigated to monitor the PSN assembly process over time. To minimize SERS signal variations, PSN preparation and final solution concentrations were optimized. Focus of the laser through the bulk of the solution and continuous sample rotation ensured consistent sampling of the components throughout the duration of the experiment.
The rate at which SERS intensity reached saturation was seen to increase with MDM2 concentration, and it can be interpreted from the data that the formation of PSN assemblies approaches completion within 11, 9, and 7 min for PSN:MDM2 ratios of 1:300, 1:500, and 1:1,000, respectively (15 pM PSN, 4.5–15 nM MDM2) (Fig. 4B). This is quicker than observed in extinction spectroscopy (Fig. 3A), demonstrating the higher sensitivity of SERS as an analytical tool for monitoring NP aggregation. These data demonstrate that SERS can be used as a viable tool for monitoring time-dependent NP assembly, although it must be realized that it does not represent the system found in nature owing to PSN solution kinetics.
Inhibition of the MDM2-PSN Interaction.
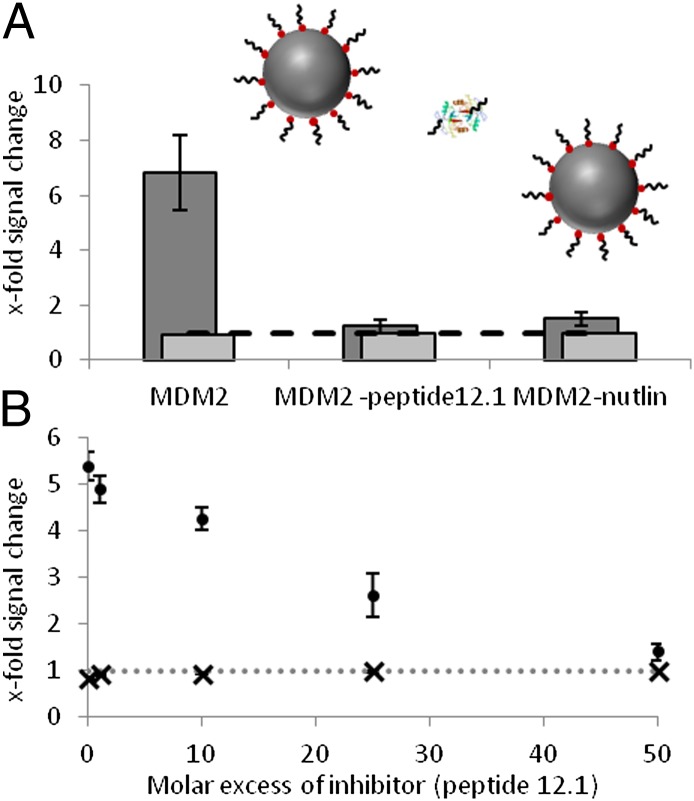
To test the potential for development of the assay for investigating MDM2 interactions with small molecules, we exposed MDM2 to N-terminal-binding ligands to competitively inhibit the aforementioned PSN-12.1 assembly. MDM2 is likely to exhibit a higher binding affinity to free peptide 12.1 (inhibitor 12.1) than to NP-bound peptide 12.1, because of the solution kinetics. Nutlin-3 is a potent and well studied small molecule inhibitor of the MDM2-p53 interaction (15). For all inhibition experiments, a molar ratio of 1:1,000 PSN:MDM2 (15 pM PSN, 15 nM MDM2) was used owing to the large extent of the aggregation observed (Figs. 2–4). MDM2 was preincubated with a 100-fold molar excess of inhibitor (0.96 mM MDM2, 96 mM inhibitor) before mixing with PSN-12.1 solutions (6.25 mL added to 400 mL of 15 pM PSN), and temporal analysis was carried out using extinction spectroscopy. A lesser decrease in the plasmon band was observed for PSN-12.1 solutions treated with MDM2 preincubated with either inhibitor 12.1 or Nutlin-3 than was evident following the addition of native MDM2 (Fig. 5). A much greater enhancement in Raman signal was also observed in the presence of native MDM2 compared with MDM2 preincubated with inhibitor (Fig. 5B). Inhibitor 12.1 and Nutlin-3 were able to bind the MDM2 hydrophobic cleft, thus blocking the binding site for peptide 12.1 molecules on PSN-12.1 and disallowing MDM2-mediated PSN assembly. Signal changes in SERS and extinction spectroscopy associated with PSN aggregation were, therefore, not observed to the same extent (Fig. 5B). It was subsequently observed that lowering the excess of inhibitor resulted in a decrease in inhibition efficiency by extinction spectroscopy and SERS (Fig. 5C). Varying the molar excess of inhibitor 12.1 prebound to MDM2 in this way demonstrates PSN-assembly inhibition in a dose-dependent manner. The extinction spectroscopy and SERS data, together, demonstrate a competitive inhibition of MDM2–peptide 12.1-driven NP assembly by inhibitor 12.1 and Nutlin-3. A 1.4× increase in SERS response was detected at the highest concentration of inhibitor 12.1, suggesting that some PSN assembly occurred (Fig. 5C). Depletion in extinction plasmon band for the same sample in extinction spectroscopy is negligible (Fig. 5C), thus identifying SERS as the superior technique to investigate inhibitor potency. SERS analysis also provides a positive response for NP assembly that is advantageous over extinction spectroscopy where a decrease in signal is monitored.
Fig. 5.
Competitive inhibition of MDM2-induced PSN aggregation. Schematic illustrates proposed MDM2-induced PSN aggregation inhibition with inhibitor peptide 12.1 and Nutlin-3. (A and B) X-fold decrease in the plasmon band monitored by extinction spectroscopy [light gray (A) and X (B)] and x-fold SERS intensity change following 30 min incubation of MDM2 with varying concentrations of inhibitor molecule [dark gray (A) and circle (B)].
Disruption of the Dimerization Interface.
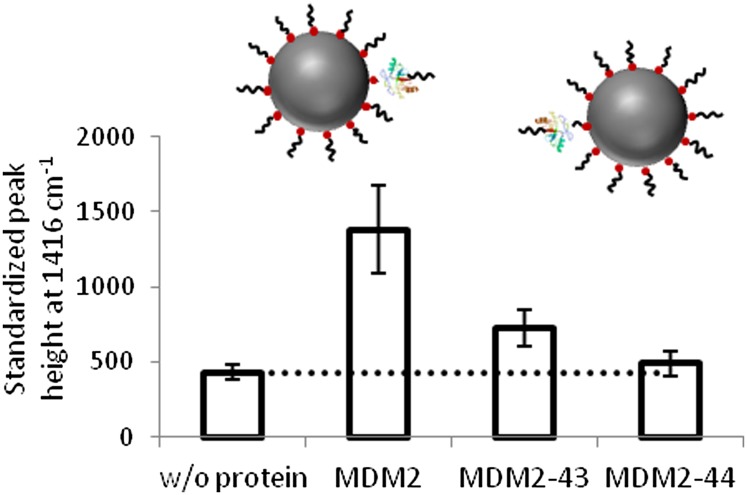
To further test the assay capabilities for investigating MDM2 and verify the requirement for MDM2 oligomerization in PSN assembly, MDM2 was premixed with self-peptides from one linear motif that stabilizes the MDM2/MDMX heterodimer at the N-terminal junction of the C-terminal RING domain (amino acids 430-LPLNAI-435) (8) at a molar ratio of 1:100 MDM2:peptide (0.96 mM MDM2, 96 mM peptide). SERS analysis of PSN solutions (15 pM) was carried out following the addition of MDM2 preincubated with peptides 43 (DKEESVESSLPLNAI) and 44 (PLNAIEPCVICQGRP) (6.25 mL added to 400 mL), which represent overlapping sequences from the dimerization interface (Fig. S9). Preincubation of MDM2 with peptides 43 and 44 resulted in a decrease in PSN-12.1 assembly, as monitored using SERS (Fig. 6). Despite both dimerization-motif peptides demonstrating an inhibitory effect on PSN-12.1 assembly, a 1.69-fold increase in SERS was observed in the presence of peptide 43 compared with a 1.14-fold increase with peptide 44. The difference in PSN-12.1 assembly inhibition potency of these two ligands indicates a positional effect of peptide-ligand binding to the MDM2 dimerization interface in preventing dimerization. As a control, the binding of peptides 43 and 44 to MDM2 using ELISA demonstrated no affect on N-terminal-binding activity (Fig. S9B). These data highlight the difference between a standard ligand-binding assay that does not distinguish between the oligomeric or monomeric nature of the target protein (Fig. S9) and a SERS-based ligand-binding assay that requires target protein “oligomerization” (Fig. 6; PSN assembly model illustrated in Fig. 1A, i and ii).
Fig. 6.
Competitive inhibition of MDM2-induced PSN aggregation. Schematic illustrates proposed MDM2-induced PSN assembly inhibition with dimerization-motif self-peptides 43 and 44. Data show SERS peak height measurements, at 1,416 cm−1, recorded for PSN-12.1 samples after completion of temporal analysis. Dotted line indicates PSN samples when MDM2 is absent. Error bars illustrate the SD.
Discussion
A number of SERS-based immunoassays have been developed for the detection of biological interactions; however, few NP–protein aggregation studies have been published. This report presents the use of protein–peptide interactions as a controlled NP-assembly template capable of “turning on” SERS. Furthermore, the protein interactions investigated are of particular biological interest owing to the critical role of MDM2 in cancer progression. PSN assembly and associated SERS enhancement were successfully inhibited by preincubating MDM2 with small-molecule-binding ligands.
We have demonstrated that full-length MDM2 is able to successfully aggregate PSN-12.1, suggesting that the MDM2 protein is in dimeric (oligomeric) state in solution, while maintaining biological activity of the hydrophobic pocket. These studies present an innovative method for interrogating the allosteric interactions of full-length unlabeled MDM2 using biologically driven NP assembly. We also demonstrate a proof-of-concept with which to use SERS-based ligand-binding assays to investigate other allosteric proteins that undergo complex conformational interactions.
Methods
Peptide–BT Conjugation.
Peptides 12.1 (SGSG-MPRFMDYWEGLN-resin) and 12.1WΔA (SGSG-MPRFMDYAEGLN-resin) were obtained bound to Wang resin via the C terminus (Almac Sciences), with the N terminus deprotected. Modification with BT was carried out via amide coupling in the solid phase and cleaved from the resin using 95% TFA (SI Methods).
Nanoparticle Bioconjugation.
AgEDTA nanoparticles were synthesized with a 40-nm diameter using the method described by Heard et al. in 1983 (52). Nanoparticles were centrifuged at 1,900 × g for 20 min and resuspended in buffer [25 mM Hepes and 20 mM KCl (pH 7.5)] before addition of BT or peptide–BT at a final concentration of 10−6 M. After shaking for a minimum of 1 h, the conjugation solutions were centrifuged at 5,000 rpm for 20 min and resuspended in buffer (×3) to remove any excess analytes. Complete BT–peptide conjugates were characterized using extinction spectroscopy, dynamic light scattering, and MALDI-MS.
Dynamic Light Scattering.
One-milliliter samples were analyzed via dynamic light scattering using a Malvern high-performance particle sizer (HPPS) using standard disposable cuvettes.
Extinction Spectroscopy.
Absorbance readings were taken from 250–650 nm using a Cary Eclipse extinction spectrometer. All spectra were baseline corrected using 25 mM Hepes buffer (pH 7.5), 20 mM KCl, as a blank. NP concentrations were calculated using the extinction coefficient for 40-nm silver nanoparticles at λ-max (ε = 2.87 × 10¹⁰). Peptide–BT concentrations were calculated using the extinction coefficient for BT at 487 nm (ε = 12017).
MALDI-MS.
Peptide samples were analyzed using a 1:1 ratio of sample to matrix, α-cyano-4-hydroxycinnamic acid (α-cyano). Ionization was conducted in the positive reflectron mode. A linear three-point calibration was achieved using a preprepared peptide mixture: 379.1 m/z (α-cyano matrix), 757.4 m/z (Bradykinin fragment), and 1,046.5 m/z (angiotensin II). To analyze nanoparticle-bound peptide samples, conjugates were removed from the nanoparticles and desalted. Nanoparticle samples were treated with DTT (10 mM) for a minimum of 30 min to displace BT from the metal surface. Following centrifugation at 5,000 rpm for 20 min, 150 μL of supernatant was desalted using PepClean C-18 spin columns (Thermo Scientific) MALDI-MS carried out on the recovered sample.
Protein Preparation.
MDM2 was purified as indicated in SI Methods. Purified full-length MDM2 was stored at −20 °C in storage buffer [25 mM Hepes (pH 7.5), 10% (vol/vol) glycerol, 1 mM benzamidine, 5 mM DTT, 290 mM KCl], and buffer exchange into assay buffer [25 mM Hepes (pH 7.5), 20 mM KCl] was performed using a concentrator with a 10-kDa molecular mass cutoff filter (Millipore). BSA was obtained from Sigma and dissolved in assay buffer. MDM2 and BSA stocks were prepared at a concentration of ∼8 × 10⁻⁷ M in assay buffer for use in NP aggregation assays. MDM2 protein was validated in the dual-site-binding assay that measures the ability of Nutlin to stimulate the interaction of MDM2 with the Rb1 peptide (10). Rb1 peptide binds to the acidic domain of MDM2 and mimics the interaction of MDM2 with the p53 central DNA-binding domain (10).
SERS Analysis.
SERS spectra were collected using a Renishaw inVia microscope system. Excitation at 514.5 nm was achieved via an Ar+ laser attenuated using neutral density filters. Spectra were obtained using 180° backscattering with the grating centered at 1400 cm−1 using a 20× long-working distance objective. Static scans with a 2-s collection time were obtained for analysis of postassay samples in disposable cuvettes. Temporal SERS analysis of samples was conducted using an NMR tube spinner microscope attachment. A 1-s scan duration was used, and one spectrum was acquired every 60-s for 30 min.
Supplementary Material
Acknowledgments
We thank Vivien Landre and Jude Nicholson for insights into the MDM2 RING domain structure, dynamics, and function. This work was supported by a Biotechnology and Biological Sciences Research Council doctoral studentship (to A.F.R.), a Cancer Research UK doctoral studentship (to F.L.), and a Royal Society Wolfson Research Merit Award (to D.G.).
Footnotes
The authors declare no conflict of interest.
This article is a PNAS Direct Submission.
This article contains supporting information online at www.pnas.org/lookup/suppl/doi:10.1073/pnas.1116637109/-/DCSupplemental.
References
- 1.Carson DA, Lois A. Cancer progression and p53. Lancet. 1995;346:1009–1011. doi: 10.1016/s0140-6736(95)91693-8. [DOI] [PubMed] [Google Scholar]
- 2.Lane DP. Cancer. p53, guardian of the genome. Nature. 1992;358:15–16. doi: 10.1038/358015a0. [DOI] [PubMed] [Google Scholar]
- 3.Vousden KH, Lu X. Live or let die: The cell’s response to p53. Nat Rev Cancer. 2002;2:594–604. doi: 10.1038/nrc864. [DOI] [PubMed] [Google Scholar]
- 4.Arva NC, et al. A chromatin-associated and transcriptionally inactive p53-Mdm2 complex occurs in mdm2 SNP309 homozygous cells. J Biol Chem. 2005;280:26776–26787. doi: 10.1074/jbc.M505203200. [DOI] [PubMed] [Google Scholar]
- 5.Fang SY, Jensen JP, Ludwig RL, Vousden KH, Weissman AM. Mdm2 is a RING finger-dependent ubiquitin protein ligase for itself and p53. J Biol Chem. 2000;275:8945–8951. doi: 10.1074/jbc.275.12.8945. [DOI] [PubMed] [Google Scholar]
- 6.Momand J, Zambetti GP, Olson DC, George D, Levine AJ. The mdm-2 oncogene product forms a complex with the p53 protein and inhibits p53-mediated transactivation. Cell. 1992;69:1237–1245. doi: 10.1016/0092-8674(92)90644-r. [DOI] [PubMed] [Google Scholar]
- 7.Oliner JD, Kinzler KW, Meltzer PS, George DL, Vogelstein B. Amplification of a gene encoding a p53-associated protein in human sarcomas. Nature. 1992;358:80–83. doi: 10.1038/358080a0. [DOI] [PubMed] [Google Scholar]
- 8.Linke K, et al. Structure of the MDM2/MDMX RING domain heterodimer reveals dimerization is required for their ubiquitylation in trans. Cell Death Differ. 2008;15:841–848. doi: 10.1038/sj.cdd.4402309. [DOI] [PubMed] [Google Scholar]
- 9.Pettersson S, Kelleher M, Pion E, Wallace M, Ball KL. Role of Mdm2 acid domain interactions in recognition and ubiquitination of the transcription factor IRF-2. Biochem J. 2009;418:575–585. doi: 10.1042/BJ20082087. [DOI] [PubMed] [Google Scholar]
- 10.Wallace M, Worrall E, Pettersson S, Hupp TR, Ball KL. Dual-site regulation of MDM2 E3-ubiquitin ligase activity. Mol Cell. 2006;23:251–263. doi: 10.1016/j.molcel.2006.05.029. [DOI] [PubMed] [Google Scholar]
- 11.Dastidar SG, Lane DP, Verma CS. Multiple peptide conformations give rise to similar binding affinities: Molecular simulations of p53-MDM2. J Am Chem Soc. 2008;130:13514–13515. doi: 10.1021/ja804289g. [DOI] [PubMed] [Google Scholar]
- 12.Ding K, et al. Structure-based design of potent non-peptide MDM2 inhibitors. J Am Chem Soc. 2005;127:10130–10131. doi: 10.1021/ja051147z. [DOI] [PubMed] [Google Scholar]
- 13.Ding K, et al. Structure-based design of spiro-oxindoles as potent, specific small-molecule inhibitors of the MDM2-p53 interaction. J Med Chem. 2006;49:3432–3435. doi: 10.1021/jm051122a. [DOI] [PubMed] [Google Scholar]
- 14.García-Echeverría C, Chène P, Blommers MJJ, Furet P. Discovery of potent antagonists of the interaction between human double minute 2 and tumor suppressor p53. J Med Chem. 2000;43:3205–3208. doi: 10.1021/jm990966p. [DOI] [PubMed] [Google Scholar]
- 15.Vassilev LT, et al. In vivo activation of the p53 pathway by small-molecule antagonists of MDM2. Science. 2004;303:844–848. doi: 10.1126/science.1092472. [DOI] [PubMed] [Google Scholar]
- 16.Poyurovsky MV, et al. The Mdm2 RING domain C-terminus is required for supramolecular assembly and ubiquitin ligase activity. EMBO J. 2007;26:90–101. doi: 10.1038/sj.emboj.7601465. [DOI] [PMC free article] [PubMed] [Google Scholar]
- 17.Uldrijan S, Pannekoek WJ, Vousden KH. An essential function of the extreme C-terminus of MDM2 can be provided by MDMX. EMBO J. 2007;26:102–112. doi: 10.1038/sj.emboj.7601469. [DOI] [PMC free article] [PubMed] [Google Scholar]
- 18.Kostic M, Matt T, Martinez-Yamout MA, Dyson HJ, Wright PE. Solution structure of the Hdm2 C2H2C4 RING, a domain critical for ubiquitination of p53. J Mol Biol. 2006;363:433–450. doi: 10.1016/j.jmb.2006.08.027. [DOI] [PubMed] [Google Scholar]
- 19.Worrall EG, Worrall L, Blackburn E, Walkinshaw M, Hupp TR. The effects of phosphomimetic lid mutation on the thermostability of the N-terminal domain of MDM2. J Mol Biol. 2010;398:414–428. doi: 10.1016/j.jmb.2010.03.023. [DOI] [PubMed] [Google Scholar]
- 20.Wawrzynow B, et al. A function for the RING finger domain in the allosteric control of MDM2 conformation and activity. J Biol Chem. 2009;284:11517–11530. doi: 10.1074/jbc.M809294200. [DOI] [PMC free article] [PubMed] [Google Scholar]
- 21.Huang SX, Chen Y. Ultrasensitive fluorescence detection of single protein molecules manipulated electrically on Au nanowire. Nano Lett. 2008;8:2829–2833. doi: 10.1021/nl801429p. [DOI] [PubMed] [Google Scholar]
- 22.Tang L, Dong C, Ren J. Highly sensitive homogenous immunoassay of cancer biomarker using silver nanoparticles enhanced fluorescence correlation spectroscopy. Talanta. 2010;81:1560–1567. doi: 10.1016/j.talanta.2010.03.002. [DOI] [PubMed] [Google Scholar]
- 23.Xia ZY, Rao JH. Biosensing and imaging based on bioluminescence resonance energy transfer. Curr Opin Biotechnol. 2009;20:37–44. doi: 10.1016/j.copbio.2009.01.001. [DOI] [PMC free article] [PubMed] [Google Scholar]
- 24.Faulds K, Jarvis R, Smith WE, Graham D, Goodacre R. Multiplexed detection of six labelled oligonucleotides using surface enhanced resonance Raman scattering (SERRS) Analyst (Lond) 2008;133:1505–1512. doi: 10.1039/b800506k. [DOI] [PubMed] [Google Scholar]
- 25.Sabatté G, et al. Comparison of surface-enhanced resonance Raman scattering and fluorescence for detection of a labeled antibody. Anal Chem. 2008;80:2351–2356. doi: 10.1021/ac071343j. [DOI] [PubMed] [Google Scholar]
- 26.Graham D, Faulds K, Smith WE. Biosensing using silver nanoparticles and surface enhanced resonance Raman scattering. Chem Commun (Camb) 2006;42:4363–4371. doi: 10.1039/b607904k. [DOI] [PubMed] [Google Scholar]
- 27.Cunningham D, et al. Practical control of SERRS enhancement. Faraday Discuss. 2006;132:135–145. doi: 10.1039/b506241a. discussion 147–158. [DOI] [PubMed] [Google Scholar]
- 28.Faulds K, Littleford RE, Graham D, Dent G, Smith WE. Comparison of surface-enhanced resonance Raman scattering from unaggregated and aggregated nanoparticles. Anal Chem. 2004;76:592–598. doi: 10.1021/ac035053o. [DOI] [PubMed] [Google Scholar]
- 29.Rohr TE, Cotton T, Fan N, Tarcha PJ. Immunoassay employing surface-enhanced Raman spectroscopy. Anal Biochem. 1989;182:388–398. doi: 10.1016/0003-2697(89)90613-1. [DOI] [PubMed] [Google Scholar]
- 30.Campbell FM, et al. SERRS immunoassay for quantitative human CRP analysis. Analyst (Lond) 2008;133:1355–1357. doi: 10.1039/b808087a. [DOI] [PubMed] [Google Scholar]
- 31.Dou X, Takama T, Yamaguchi Y, Yamamoto H, Ozaki Y. Enzyme immunoassay utilizing surface-enhanced Raman scattering of the enzyme reaction product. Anal Chem. 1997;69:1492–1495. [Google Scholar]
- 32.Douglas P, Stokes RJ, Graham D, Smith WE. Immunoassay for P38 MAPK using surface enhanced resonance Raman spectroscopy (SERRS) Analyst (Lond) 2008;133:791–796. doi: 10.1039/b715824f. [DOI] [PubMed] [Google Scholar]
- 33.Driskell JD, et al. Low-level detection of viral pathogens by a surface-enhanced Raman scattering based immunoassay. Anal Chem. 2005;77:6147–6154. doi: 10.1021/ac0504159. [DOI] [PubMed] [Google Scholar]
- 34.Grubisha DS, Lipert RJ, Park HY, Driskell J, Porter MD. Femtomolar detection of prostate-specific antigen: An immunoassay based on surface-enhanced Raman scattering and immunogold labels. Anal Chem. 2003;75:5936–5943. doi: 10.1021/ac034356f. [DOI] [PubMed] [Google Scholar]
- 35.Han XX, et al. Fluorescein isothiocyanate linked immunoabsorbent assay based on surface-enhanced resonance Raman scattering. Anal Chem. 2008;80:3020–3024. doi: 10.1021/ac702497t. [DOI] [PubMed] [Google Scholar]
- 36.Han XX, et al. Simplified protocol for detection of protein-ligand interactions via surface-enhanced resonance Raman scattering and surface-enhanced fluorescence. Anal Chem. 2008;80:6567–6572. doi: 10.1021/ac800642g. [DOI] [PubMed] [Google Scholar]
- 37.Narayanan R, Lipert RJ, Porter MD. Cetyltrimethylammonium bromide-modified spherical and cube-like gold nanoparticles as extrinsic Raman labels in surface-enhanced Raman spectroscopy based heterogeneous immunoassays. Anal Chem. 2008;80:2265–2271. doi: 10.1021/ac7026436. [DOI] [PubMed] [Google Scholar]
- 38.Ni J, Lipert RJ, Dawson GB, Porter MD. Immunoassay readout method using extrinsic Raman labels adsorbed on immunogold colloids. Anal Chem. 1999;71:4903–4908. doi: 10.1021/ac990616a. [DOI] [PubMed] [Google Scholar]
- 39.Wang G, Park H-Y, Lipert RJ, Porter MD. Mixed monolayers on gold nanoparticle labels for multiplexed surface-enhanced Raman scattering based immunoassays. Anal Chem. 2009;81:9643–9650. doi: 10.1021/ac901711f. [DOI] [PubMed] [Google Scholar]
- 40.Aslan K, Luhrs CC, Perez-Luna VH. Controlled and reversible aggregation of biotinylated gold nanoparticles with streptavidin. J Phys Chem B. 2004;108:15631–15639. [Google Scholar]
- 41.Andresen H, Gupta S, Stevens MM. Kinetic investigation of bioresponsive nanoparticle assembly as a function of ligand design. Nanoscale. 2011;3:383–386. doi: 10.1039/c0nr00469c. [DOI] [PubMed] [Google Scholar]
- 42.Du BA, Li ZP, Cheng YQ. Homogeneous immunoassay based on aggregation of antibody-functionalized gold nanoparticles coupled with light scattering detection. Talanta. 2008;75:959–964. doi: 10.1016/j.talanta.2007.12.048. [DOI] [PubMed] [Google Scholar]
- 43.Gupta S, Andresen H, Stevens MM. Single-step kinase inhibitor screening using a peptide-modified gold nanoparticle platform. Chem Commun (Camb) 2011;47:2249–2251. doi: 10.1039/c0cc04903d. [DOI] [PubMed] [Google Scholar]
- 44.Onoda A, Ueya Y, Sakamoto T, Uematsu T, Hayashi T. Supramolecular hemoprotein-gold nanoparticle conjugates. Chem Commun (Camb) 2010;46:9107–9109. doi: 10.1039/c0cc03430d. [DOI] [PubMed] [Google Scholar]
- 45.Kussie PH, et al. Structure of the MDM2 oncoprotein bound to the p53 tumor suppressor transactivation domain. Science. 1996;274:948–953. doi: 10.1126/science.274.5289.948. [DOI] [PubMed] [Google Scholar]
- 46.Böttger V, et al. Identification of novel mdm2 binding peptides by phage display. Oncogene. 1996;13:2141–2147. [PubMed] [Google Scholar]
- 47.Li C, et al. Systematic mutational analysis of peptide inhibition of the p53-MDM2/MDMX interactions. J Mol Biol. 2010;398:200–213. doi: 10.1016/j.jmb.2010.03.005. [DOI] [PMC free article] [PubMed] [Google Scholar]
- 48.Liu M, et al. A left-handed solution to peptide inhibition of the p53-MDM2 interaction. Angew Chem Int Ed Engl. 2010;49:3649–3652. doi: 10.1002/anie.201000329. [DOI] [PMC free article] [PubMed] [Google Scholar]
- 49.Graham D, et al. Synthesis of novel monoazo benzotriazole dyes specifically for surface enhanced resonance Raman scattering. Chem Commun. 1998;11:1187–1188. [Google Scholar]
- 50.Naumov S, Kapoor S, Thomas S, Venkateswaran S, Mukherjee T. SERS of benzotriazole on Ag colloid: Surface structure characterization using the DFT approach. Theochem. J Mol Struct. 2004;685:127–131. [Google Scholar]
- 51.Pergolese B, Muniz-Miranda M, Bigotto A. Study of the adsorption of 1,2,3-triazole on silver and gold colloidal nanoparticles by means of surface enhanced Raman scattering. J Phys Chem B. 2004;108:5698–5702. doi: 10.1021/jp050155z. [DOI] [PubMed] [Google Scholar]
- 52.Heard SM, Grieser F, Barraclough CG, Sanders JV. The characterization of Ag Sols by electron-microscopy, optical-absorption, and electrophoresis. J Colloid Interface Sci. 1983;93:545–555. [Google Scholar]
Associated Data
This section collects any data citations, data availability statements, or supplementary materials included in this article.


