Abstract
It has been recently stated that stress-responding genes in yeast are enriched in cryptic transcripts and that this is the cause of the differences observed between mRNA amount and RNA polymerase occupancy profiles. Other studies have shown that such differences are mainly due to modulation of mRNA stabilities. Here we analyze the relationship between the presence of cryptic transcripts in genes and their stress response profiles. Despite some of the stress-responding gene groups being indeed enriched in specific classes of cryptic transcripts, we found no statistically significant evidence that cryptic transcription is responsible for the differences observed between mRNA and transcription rate profiles.
Key words: transcription rate, cryptic transcription, mRNA stability, stress response, yeast
Introduction
The existence and potential function of nonproductive transcription and of unconventional transcripts is a hot topic of current transcription research.1 Cryptic transcripts are defined as those that are difficult to detect given their small amount and lack of correspondence with predicted canonical genes. Since functional genomics techniques have been developed, a plethora of different kinds of cryptic transcripts has been detected in all studied eukaryotes, including yeast. The absolute level of yeast cryptic transcription is not known, but estimations for the total amount of antisense transcription go from a rather low, and even controversial, 0.62%2 to up to 9.2%.3 Apparently, the more in-depth the cryptic transcription analysis, the larger the proportion of affected genes. A recent high-throughput sequencing (HTS) study found that 60.5% of genes have antisense overlapping transcripts3 but another HTS analysis only detected 310 genes (5.6%) having antisense transcription.4
It has been hypothesized that cryptic transcripts play an important role in shaping the stress response in yeast, which brings about differences between mRNA amount and RNA polymerase occupancy profiles.5 That study address the potential function of cryptic transcription by comparing the physical presence of RNAP II in genes (“occupancy,” measured by ChIP-chip) and the mature mRNA amount. However, as ChIP cannot discriminate between active and inactive forms of RNAP II, other methods, such as genomic run-on (GRO),6 that allow the measurement of the elongation activity should be taken also into account.7,8 Especially because the gene-specific differences between mRNA level and RNAP II occupancy could also be due to the gene-specific differences in the relative proportion of active (non-arrested) molecules.8 This scenario becomes even more complex when the kinetics of transcription is considered. Part of the discrepancies between changes in mRNA amounts and RNAP II occupancy5 (putative transcription rate or TR) could be explained by the kinetic delay that exists between the change in transcription and the corresponding adjustment in mRNA level.9 Moreover, several groups working in yeast and in mammalian cells reported variations in the stability of many mRNAs during the stress response by using different techniques.4,10–16 This modulation of mRNA half-lives—and not only their initial stability value5—should be considered. Nevertheless, the specific contribution of cryptic transcripts, on the one hand, and of mRNA stability regulation, on the other hand, to shaping the stress response has not been systematically evaluated.
Results and Discussion
In order to test whether cryptic transcription is important in shaping the stress response in yeast, we performed a comparative analysis of data recently obtained by our group during response to heat stress experiments.12 While we used several different cryptic transcription data sets,2,17,18 previous studies in reference 5, are restricted to just one of them.17 This last data set contains a genome-wide distribution of stable unannotated transcripts (SUT) from wild-type cells and of cryptic unstable transcripts (CUT) present only in nuclear exosome-deficient cells (rrp6). The other cryptic transcripts data sets used long-SAGE HTS to find sense and antisense CUTs,18 or employed HTS, but only studied antisense SUTs.2
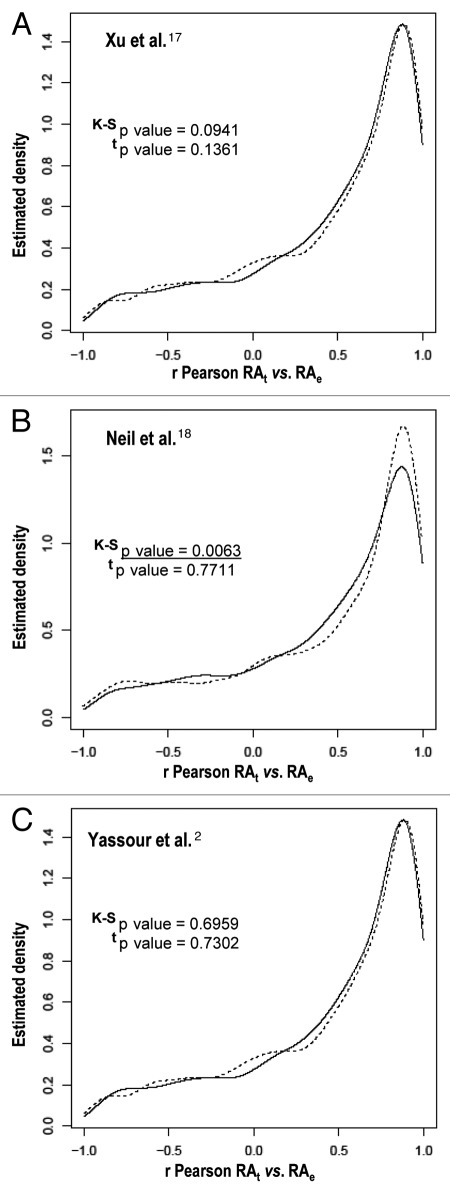
To test if cryptic transcription accounts for the discrepancies between RNAP II occupancy and mRNA level, we compared the experimentally determined mRNA levels throughout the heat stress response time course (reviewed in refs. 10 and 12 for a detailed description of the stress response analysis protocol) to the theoretical mRNA level value expected if mRNA stability did not change during the heat stress response (calculated using the kinetic equation described in refs. 9 and 10) and the TR experimental data determined by GRO.12 The plot for each gene was then analyzed and the Pearson's correlation coefficient (r) was calculated. An r value of 1 means that both experimental and theoretical mRNA levels are identical and, thus, there is no other influence on mRNA level but that of TR changes. Lower r values imply that the TR is not the only determinant of mRNA level and that other effects, such as the changes in either mRNA stability or in cryptic transcription, also play a role during the stress response. We used two kinds of representations: First, in Figure 1 we display the density functions estimated using a kernel density estimator.19 The same plot contains the estimated density functions for two different groups of genes (those with and those without cryptic transcripts). For all cryptic transcripts data sets,2,17,18 no significant difference is seen between genes with or without cryptic transcripts when using a t test (i.e., between the mean of the correlations). In the case of the Neil et al.18 data set, only a residual significance is observed using a Kolmogorov- Smirnov test (K-S).
Figure 1.
Cryptic transcription does not correlate with the differences between the transcription rate and mRNA profiles in heat stress response. We display the kernel density estimators for the r Pearson correlations between the theoretical and experimental mRNA levels in the heat stress response. The estimated densities correspond to genes with cryptic transcripts (dotted line) and to genes without cryptic transcripts (solid line), as determined by Xu et al.17 (A), Neil et al.18 (B) and Yassour et al.2 (C) Note that the same bandwidth has been used for both densities. We have tested the normality hypothesis using the Shapiro-Wilk test and the normal null hypothesis is rejected for all data sets. However, because we have large groups of genes to be compared the means can be compared using al two-sample t test (t, the Welch correction was used). Additionally, the null hypothesis of a common distribution for both groups will be tested using the two-sample Kolmogorov-Smirnov test (K-S). All the statistical tests can be found in reference 19. The p values for the K-S test and t tests are indicated in each panel. Statistically significant values are underlined. Theoretical mRNA (RAt) levels were calculated using the equation described in reference 12 and assuming a constant degradation constant (kD) equal to the steady-state value observed before stress (time 0). From that equation, the theoretical mRNA values at different times were calculated from an initial mRNA amount and the experimental TR values.12 Experimental mRNA (RAe) levels were those determined in reference 12. r Pearson correlations were calculated for individual gene values of the predicted theoretical mRNA levels plotted vs. the experimental mRNA data. See reference 10 and 12 for further details of the data sets used.
Another way to analyze the data are by plotting the correlation coefficient against the richness in cryptic transcripts (represented as a 100-genes sliding window). This reveals (Fig. S1A) that the mere existence of cryptic transcripts from the Xu et al. data set17 in a gene has very little effect (a very low slope, 0.0005) on the discrepancy between the mRNA level and the TR at which it is synthesized (r value). Moreover, when using the other two cryptic transcripts data sets,2,18 we found an even lesser effect of cryptic transcription on the discrepancy between theoretical and experimental mRNA levels, with a flat or slightly negative slope (Fig. S1B and C). Even when considering CUTs and SUTs separately,17 or sense and antisense separately,18 we obtained no significant tendency (not shown). Similar results were also found when we used the gene expression data from a different study of oxidative stress response (not shown).10 Since we previously experimentally demonstrated that mRNA stabilities vary according to predictions during stress responses,10–12 here we argue that changes in the mRNA half-life are the main cause of the discrepancies between mRNA level and the TR.
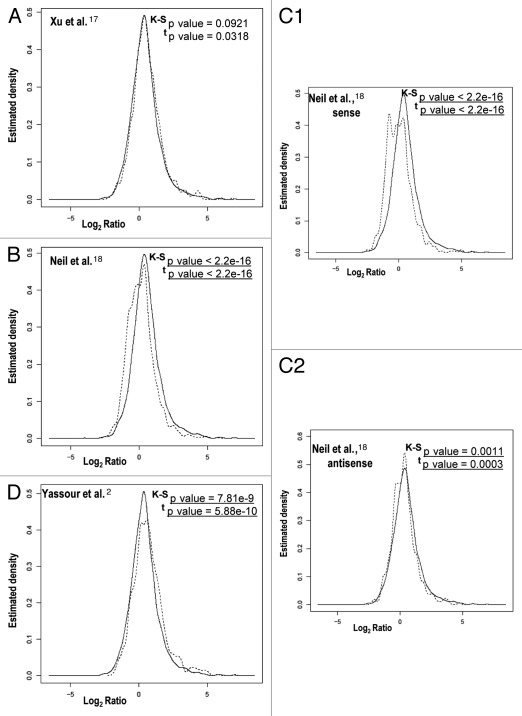
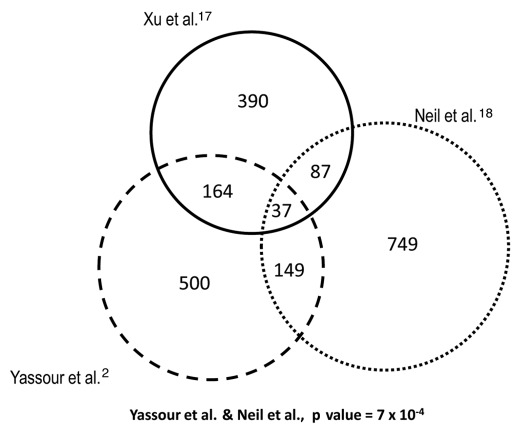
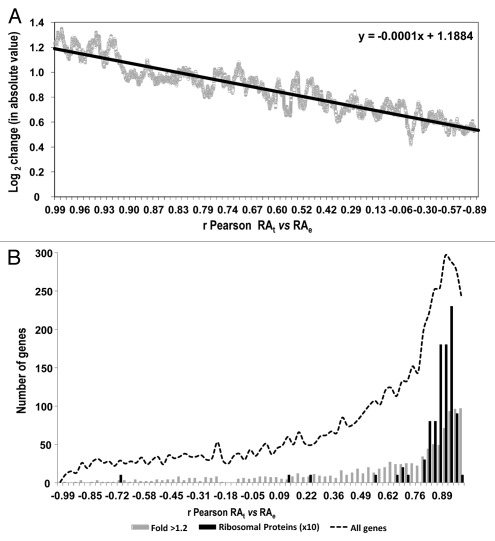
Other authors have postulated that genes involved in stress responses are enriched in long antisense transcripts and have found that there is a negative correlation in their expression relative to the expression of regular genes.2 We analyzed the differences between genes with or without overlapping cryptic transcripts in relation to their mRNA level change during the stress response (Fig. 2). In most cases, a significant difference between the two gene classes was observed. Only the cryptic transcripts data set from Xu et al.17 shows no significant difference. For this data set, we also performed a sliding window analysis of the effect of the presence of any kind of cryptic transcription and the strength of the gene response during heat stress.12 Figure S2 illustrates that there is no clear tendency (upper graph) when using the data set of Xu et al.17 unlike the very clear effect noted for the data set of Neil et al.18 Downregulated genes tend to be enriched in cryptic transcription, which is mainly due to sense cryptic transcription with a poor antisense cryptic transcription effect (Figs. 2C1 and S2C1). The genes in that part of the graph are enriched in the translation-related categories [e.g., ribosomal proteins genes (RP)—p value < 10−49]. This result may correspond to an abundance of truncated transcripts in the RP genes provoked by a large proportion of blocked RNAPs seen in their 5′ part, as we previously showed in reference 7. However, in the data set of Yassour et al.2 which corresponds exclusively to antisense cryptic transcription, the tendency is the opposite, with upregulated genes being enriched in cryptic transcription (Figs. 2D and S2D). This matches the results described by the authors, who found an over-representation of the stress-induced genes among their data set.2 Why such different results? As described above, all three cryptic transcription data sets differ considerably and, in fact, the overlapping among them is quite small and mostly non significant (Fig. 3). This can be due to the fact that each method uses a different protocol, which can be biased or affected by particular technical artifacts, therefore detecting different types of cryptic transcripts.2,17,18 Hence, the molecular mechanisms underlying the appearance of the different cryptic RNA types and their functions can be quite different. Thus, it is not surprising that they all provide different results in our analyses. In any case, our study suggests that genes responding to stress tend to be enriched in sense and antisense cryptic transcription by either decreasing or increasing their TR, respectively. This result does not necessarily mean, however, that cryptic transcription is the cause of the particular mRNA level stress response profile of those genes. In fact, we found that those genes with more marked changes in their RNA level during the stress response are not those with a lower correlation in theoretical and experimental mRNA profiles; there is even a weak tendency to a better correlation in mRNA profiles (r Pearson calculated as in Fig. 1) with the absolute ratio of change during heat stress (Fig. 4A). When analyzing the r coefficient for the mRNA profiles of those genes with both strong responses to stress and the presence of cryptic transcription (Fig. 4B), it is evident that they are not especially biased toward a low r Pearson coefficient (as defined in Fig. 1). In fact, as Figure 4B illustrates, those RP genes with a strong presence of sense cryptic transcripts (to the left end of the x axis in Graph S2C1) show a higher average r (0.896) than the total gene population (0.45). This is also true (average r = 0.793) for those genes induced by heat shock with a strong presence of antisense transcripts (to the right end in Graph D from Fig. S2). Finally, when the general profile is analyzed (dotted curve in Fig. 4B), it is clear that most genes have a fairly good r coefficient. All these results lead to the conclusion that a change in the TR is the main cause of a change in mRNA level during the stress response, and that this is even clearer for those genes with any kind of cryptic transcription.
Figure 2.
Different correlation patterns in comparisons between cryptic transcription data sets and change ratios after heat stress. We show a representation of the average ratio change (in log2 scale) of each time point after stress in relation to the zero time (x axis) against the density (y axis) of the distribution function for genes with cryptic transcripts (dotted line) and for genes without cryptic transcripts (solid line), as determined by Xu et al.17 (A), Neil et al.18 (B) and Yassour et al.2 (D). The data set of Neil et al.18 is split into sense (C1) and antisense (C2). As in Figure 1, the distributions and the means of correlation coefficients were tested by using the K-S and t tests, respectively. The p values for the K-S and t tests are indicated in each part. Statistically significant values are underlined.
Figure 3.
Different cryptic transcription data sets do not significantly overlap. The lists of genes with cryptic transcripts from Xu et al.,17 Neil et al.18 and Yassour et al.2 mostly contain different genes. We used the original data sets but selected only those genes having overlapping cryptic transcripts that were also present in our previous heat stress-response study.12 All the overlappings are not statistically significant when using a hypergeometric test, except for the overlap of Neil et al. and that of Yassour et al.2 which are significantly larger than expected with a p value of 7 × 10⁻⁴.
Figure 4.
Analyses of up- and downregulated genes after heat stress show a main dependence on the transcription rate change. (A) There is a slight positive dependence of the ratio of change (in log2 with absolute values, either up or downregulated) after stress in relation to the r correlation coefficient, calculated as in Figure 1. (B) Histogram of the correlation coefficients for the whole set of genes (dotted line) and for two particular groups [96 ribosomal protein (RP) genes (black bars) showing a considerable downregulation and a large proportion of sense cryptic transcription (shown in Fig. S2), and 1,051 upregulated genes (>1.2 on the log2 scale, see Fig. S2; gray bars)]. Note that the scale for the RP genes is magnified ten times.
In summary, we consider that understanding the functional role of cryptic transcription is becoming a very interesting research focal point. However, we also consider that changes in the TR are the main cause of changes in mRNA levels during stress responses.4,12,20 As we have shown, most of the discrepancy between RNAP occupancy (or TR) and mRNA levels during transcriptional responses can be explained by modulation in mRNA stabilities.4,6,10–16 Although the effect can be more marked for particular genes with a large proportion of cryptic transcripts, this cannot account for most of the discrepancies detected between mRNA changes and RNAP II changes. Therefore, it is more experimentally supported to argue that most discrepancies are due to both the delay required by kinetic laws and the changes occurring in mRNA stability.10–14,20–22
Acknowledgments
This work has been supported by grants from the Spanish MICINN: BFU2010-17656/BMC to E.H., BFU2010-21975-CO3-01/BMC to J.E.P.O. and BFU2010-21975-CO3-02/BMC to S.C., from the Generalitat Valenciana Prometeo 2011/088 to J.E.P.O. and from Junta de Andalucía (grants P07-CVI02623 and P08-CVI-03508) to S.C. MICINN and Junta de Andalucía grants involve FEDER resources from the European Union. V.P. is supported by an EMBO fellowship.
Abbreviations
- TR
transcription rate
- ChIP
chromatin immunoprecipitation
- GRO
genomic run-on
- SUT
stable unannotated transcripts
- CUT
cryptic unstable transcripts
- HTS
high throughput sequencing
- RP
ribosomal proteins
- RNA pol
RNA polymerase
- CTD
carboxy terminal domain (of RNAP II)
- K-S
Kolmogorov-Smirnov test
Note Added in Proof
In a recent paper, Xu et al.23 made an exhaustive study analysis of antisensetranscription in yeast and concluded that, although it affects the regulation of the gene expression, the main driving force of canonical (sense) expression is not its associated antisense expression.
Supplementary Material
References
- 1.van Bakel H, Nislow C, Blencowe BJ, Hughes TR. Most “dark matter” transcripts are associated with known genes. PLoS Biol. 2010;8:1000371. doi: 10.1371/journal.pbio.1000371. [DOI] [PMC free article] [PubMed] [Google Scholar]
- 2.Yassour M, Pfiffner J, Levin JZ, Adiconis X, Gnirke A, Nusbaum C, et al. Strand-specific RNA sequencing reveals extensive regulated long antisense transcripts that are conserved across yeast species. Genome Biol. 2010;11:87. doi: 10.1186/gb-2010-11-8-r87. [DOI] [PMC free article] [PubMed] [Google Scholar]
- 3.Ozsolak F, Kapranov P, Foissac S, Kim SW, Fishilevich E, Monaghan AP, et al. Comprehensive polyadenylation site maps in yeast and human reveal pervasive alternative polyadenylation. Cell. 2010;143:1018–1029. doi: 10.1016/j.cell.2010.11.020. [DOI] [PMC free article] [PubMed] [Google Scholar]
- 4.McKinlay A, Araya CL, Fields S. Genome-wide analysis of nascent transcription in Saccharomyces cerevisiae. G3. 2011;1:549–558. doi: 10.1534/g3.111.000810. [DOI] [PMC free article] [PubMed] [Google Scholar]
- 5.Kim TS, Liu CL, Yassour M, Holik J, Friedman N, Buratowski S, et al. RNA polymerase mapping during stress responses reveals widespread nonproductive transcription in yeast. Genome Biol. 2010;11:75. doi: 10.1186/gb-2010-11-7-r75. [DOI] [PMC free article] [PubMed] [Google Scholar]
- 6.García-Martínez J, Aranda A, Pérez-Ortín JE. Genomic run-on evaluates transcription rates for all yeast genes and identifies gene regulatory mechanisms. Mol Cell. 2004;15:303–313. doi: 10.1016/j.molcel.2004.06.004. [DOI] [PubMed] [Google Scholar]
- 7.Pelechano V, Jimeno-González S, Rodríguez-Gil A, García-Martínez J, Pérez-Ortín JE, Chávez S. Regulon-specific control of transcription elongation across the yeast genome. PLoS Genet. 2009;5:1000614. doi: 10.1371/journal.pgen.1000614. [DOI] [PMC free article] [PubMed] [Google Scholar]
- 8.Rodríguez-Gil A, García-Martínez J, Pelechano V, Muñoz-Centeno Mde L, Geli V, Pérez-Ortín JE, et al. The distribution of active RNA polymerase II along the transcribed region is gene-specific and controlled by elongation factors. Nucleic Acids Res. 2010;38:4651–4664. doi: 10.1093/nar/gkq215. [DOI] [PMC free article] [PubMed] [Google Scholar]
- 9.Pérez-Ortín JE, Alepuz PM, Moreno J. Genomics and gene transcription kinetics in yeast. Trends Genet. 2007;23:250–257. doi: 10.1016/j.tig.2007.03.006. [DOI] [PubMed] [Google Scholar]
- 10.Molina-Navarro MM, Castells-Roca L, Bellí G, García-Martínez J, Marín-Navarro J, Moreno J, et al. Comprehensive transcriptional analysis of the oxidative response in yeast. J Biol Chem. 2008;283:17908–17918. doi: 10.1074/jbc.M800295200. [DOI] [PubMed] [Google Scholar]
- 11.Romero-Santacreu L, Moreno J, Pérez-Ortín JE, Alepuz P. Specific and global regulation of mRNA stability during osmotic stress in Saccharomyces cerevisiae. RNA. 2009;15:1110–1120. doi: 10.1261/rna.1435709. [DOI] [PMC free article] [PubMed] [Google Scholar]
- 12.Castells-Roca L, García-Martínez J, Moreno J, Herrero E, Bellí G, Pérez-Ortín JE. Heat shock response in yeast involves changes in both transcription rates and mRNA stabilities. PLoS One. 2011;6:17272. doi: 10.1371/journal.pone.0017272. [DOI] [PMC free article] [PubMed] [Google Scholar]
- 13.Mata J, Marguerat S, Bähler J. Post-transcriptional control of gene expression: a genome-wide perspective. Trends Biochem Sci. 2005;30:506–514. doi: 10.1016/j.tibs.2005.07.005. [DOI] [PubMed] [Google Scholar]
- 14.Keene JD. The global dynamics of RNA stability orchestrates responses to cellular activation. BMC Biol. 2010;8:95. doi: 10.1186/1741-7007-8-95. [DOI] [PMC free article] [PubMed] [Google Scholar]
- 15.Rabani M, Levin JZ, Fan L, Adiconis X, Raychowdhury R, Garber M, et al. Metabolic labeling of RNA uncovers principles of RNA production and degradation dynamics in mammalian cells. Nat Biotechnol. 2011;29:436–442. doi: 10.1038/nbt.1861. [DOI] [PMC free article] [PubMed] [Google Scholar]
- 16.Schwanhäusser B, Busse D, Li N, Dittmar G, Schuchhardt J, Wolf J, et al. Global quantification of mammalian gene expression control. Nature. 2011;473:337–342. doi: 10.1038/nature10098. [DOI] [PubMed] [Google Scholar]
- 17.Xu Z, Wei W, Gagneur J, Perocchi F, Clauder-Münster S, Camblong J, et al. Bidirectional promoters generate pervasive transcription in yeast. Nature. 2009;457:1033–1037. doi: 10.1038/nature07728. [DOI] [PMC free article] [PubMed] [Google Scholar]
- 18.Neil H, Malabat C, d'Aubenton-Carafa Y, Xu Z, Steinmetz LM, Jacquier A. Widespread bidirectional promoters are the major source of cryptic transcripts in yeast. Nature. 2009;457:1038–1042. doi: 10.1038/nature07747. [DOI] [PubMed] [Google Scholar]
- 19.Rosner B. Fundamentals of Biostatistics. Brooks/Cole Cengage Learning; 2010. [Google Scholar]
- 20.Pérez-Ortín JE. Genomics of mRNA turnover. Brief Funct Genomic Proteomic. 2007;6:282–291. doi: 10.1093/bfgp/elm029. [DOI] [PubMed] [Google Scholar]
- 21.Grigull J, Mnaimneh S, Pootoolal J, Robinson MD, Hughes TR. Genome-wide analysis of mRNA stability using transcription inhibitors and microarrays reveals posttranscriptional control of ribosome biogenesis factors. Mol Cell Biol. 2004;24:5534–5547. doi: 10.1128/MCB.24.12.5534-47.2004. [DOI] [PMC free article] [PubMed] [Google Scholar]
- 22.Wang Y, Liu CL, Storey JD, Tibshirani RJ, Herschlag D, Brown PO. Precision and functional specificity in mRNA decay. Proc Natl Acad Sci USA. 2002;99:5860–5865. doi: 10.1073/pnas.092538799. [DOI] [PMC free article] [PubMed] [Google Scholar]
- 23.Xu Z, Wei W, Gagneur J, Clauder-Münster S, Smolik M, Huber W, Steinmetz L. Antisense expression increases gene expression variability and locus interdependency. Mol Syst Biol. 2011;7:468. doi: 10.1038/msb.2011.1. [DOI] [PMC free article] [PubMed] [Google Scholar]
Associated Data
This section collects any data citations, data availability statements, or supplementary materials included in this article.


