Abstract
An understanding of Ca2+ signalling in saliva-secreting acinar cells is important, as Ca2+ is the second messenger linking stimulation of cells to production of saliva. Ca2+ signals effect secretion via the ion channels located both apically and basolaterally in the cell. By approximating Ca2+ waves with periodic functions on the apical and basolateral membranes, we isolate individual wave properties and investigate them for their effect on fluid secretion in a mathematical model of the acinar cell. Mean Ca2+ concentration is found to be the most significant property in signalling secretion. Wave speed was found to encode a range of secretion rates. Ca2+ oscillation frequency and amplitude had little effect on fluid secretion.
Keywords: mathematical model, parotid acinar cell, oscillation frequency, Ca2+ wave speed, calcium signalling
1. Introduction
A problem commonly encountered in quantitative analysis of physiological processes is to determine which experimentally observed behaviours are important to the system and which can be approximated to produce a simple model capable of making predictions and increasing understanding. The salivation process is initiated with an electrical signal from the brain which releases an agonist, ACh, around the acinar cells. This agonist causes production of IP3 which releases Ca2+ from internal stores in the endoplasmic reticulum (ER). Ca2+ feedback on IP3 dynamics can cause periodic oscillations of Ca2+ throughout the cytoplasm at a raised baseline. The raised Ca2+ concentration opens K+ and Cl− channels, causing a change in intracellular and lumenal concentrations of Cl−, Na+ and K+. This concentration change creates an osmotic gradient which leads to increasing fluid secretion from the acinar cells. This process is completed in a great many acinar cells simultaneously and is accompanied by a shrinking of cell volume. Once the fluid is secreted from the acinar cells into the lumen as primary saliva it travels down the parotid ducts where duct cells modify the ionic content before finally being secreted in the mouth.
One mechanism that is particularly well studied is that of the Ca2+ dynamics. Ca2+ is well known to have an important role as a second messenger in a vast array of cell types. Current models of saliva secretion in the parotid acinar cells by Palk et al. (2010) and Gin et al. (2007) use compartmental models of Ca2+ to reproduce experimental results and incorporate into models for saliva secretion. These models assume homogeneous oscillations in Ca2+ throughout the cytosol and hence can be modelled using ordinary differential equations. Experimentally, however, Ca2+ is not only observed to oscillate but to travel in waves from one membrane to the other. These Ca2+ waves have been seen in many cells types including cardiac myocytes, airway smooth muscle, pancreatic acinar cells, neurons (Jaffe (1991)) and parotid acinar cells (Won et al. (2007)). Ca2+ waves and oscillations are thought to be able to encode a larger amount of signalling information than a constant Ca2+ concentration. Experimental and theoretical evidence suggests that frequency and amplitude are used to encode information in certain cell types (De Koninck and Schulman (1998), Tang and Othmer (1995) and Berridge (1997)). It is not our focus here to investigate the genesis of Ca2+ waves, for that see Sneyd et al. (2003). In this paper we seek to investigate how important the properties of Ca2+ waves are for controlling the secretion of primary saliva.
Consideration of Ca2+ waves, as opposed to homogeneous oscillations, requires consideration of amplitude, mean concentration, frequency and also the wave speed as mechanisms for signalling. Using a detailed spatial model of the Ca2+ waves makes it difficult to change one property, say the wave speed, without affecting the others. A spatial modelling approach involves numerically solving partial differential equations throughout the cytosol. Yet as regards saliva secretion, Ca2+ acts on ion channels which are located in the apical and basal membranes only. Hence using a spatial model generates far more information than is required and is not the approach taken here. Rather, we approximate Ca2+ waves by using periodic functions for Ca2+ at the basal and apical membrane. Using this approximation of Ca2+ waves we are able to isolate Ca2+ wave properties such as frequency, amplitude, wave speed and mean concentration to individually investigate their effect on saliva secretion.
2. Modelling agonist-induced saliva secretion
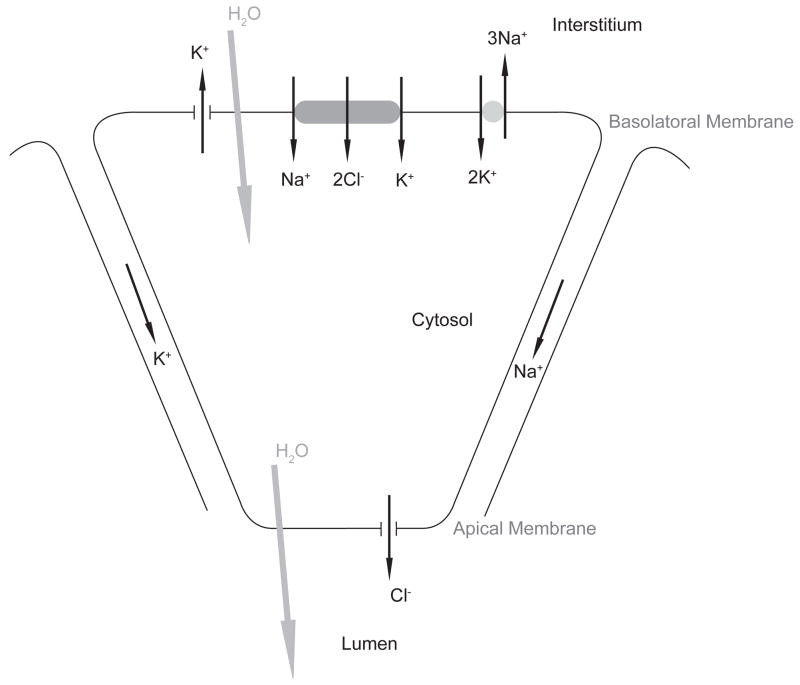
We use the mathematical model of the parotid acinar cell from Palk et al. (2010). Here saliva secretion is initiated by a raised Ca2+ concentration which open K+ and Cl− channels. This enables an ionic gradient to be maintained which allows water to flow by osmosis both transcellularly and paracellularly into the lumen. A schematic of the fluid secretion model can be seen in Figure 1.
Figure 1.
A schematic of the movement of ions responsible for saliva secretion
Being un-buffered we assume that K+, Cl− and Na+ diffuse very quickly and therefore these ionic concentrations are homogeneous throughout the three sub-domains, the interstitium, the cytosol and the lumen.
Transmembrane ion fluxes are driven by Ca2+ with the Ca2+ concentration at the apical membrane affecting the open probability of the ion channels that reside in the apical membrane and similarly the Ca2+ concentration at the basal membrane affecting the ion channels there.
Differential equations are written for the change in Cl−, K+, Na+, cell volume and the apical and basal membrane potentials. These are numerically solved using the Matlab routine ode15s. Foskett (1990) show that volume changes are tightly correlated with changes in cytosolic Cl−. Our model assumes fluid flow to change instantaneously with ionic changes, and cell volume to follow directly. Details of the model equations are given in Appendix A.
3. Simplified model of Ca2+ waves
We consider a periodic Ca2+ wave from the apical to basal membrane with a constant period such as seen experimentally by Zimmermann and Walz (1999). At any point throughout the cytosol the concentration of Ca2+ will be a periodic function with the same period and a possibly distinct mean and amplitude. We simulate a Ca2+ wave with the concentration being a periodic function at both the apical and basal membranes. We can formally write this as follows,
where Ca is the Ca2+ concentration at the apical membrane and with Cb the basal Ca2+ concentration. Both f(t) and g(t) are assumed to be periodic with the same period T and both attain their minimum values at t = 0. The parameter δ is a measure of synchronicity, when δ = 0 Ca2+ oscillations are synchronous at the two membranes. When parameter δ is non-zero there is a delay between Ca2+ peaking at the apical and basal membrane. This phase-shift can be used to simulate a Ca2+ wave with a given speed. Using this model we are free to change individual wave properties, for example the wave amplitude, without affecting the other wave properties.
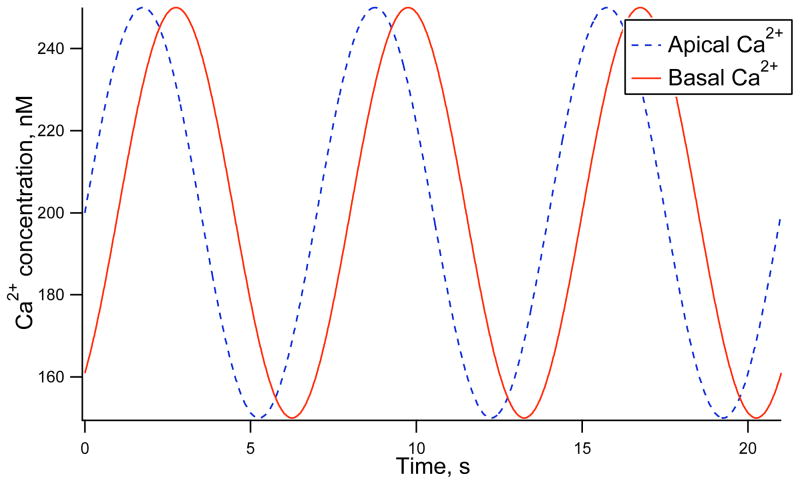
In Figure 2 we simulate an apical to basal Ca2+ wave, periodic with a period of 7 s, where the mean Ca2+ concentration and amplitude is the same at both membranes. Here a sine function was used to give the Ca2+ profile at both membranes. However, any periodic function with a similar profile to experimentally observed Ca2+ oscillations could have been used. For the remainder of the results presented a sine function is used to approximate the oscillations of Ca2+ at the apical and basal membranes. The Ca2+ concentration C is given by,
Figure 2.
Ca2+ concentrations at the apical and basal membrane numerically simulated with sine waves, period 7 s, with mean 200 nM and 50 nM amplitude. There is a 1 s time difference between the apical and basal Ca2+ peak which is equivalent to a 25 μm/s wave speed.
where Cnorm is the mean Ca2+ concentration, Camp is the amplitude of the Ca2+ oscillations, δ allows for the inclusion of a time delay and λ is the period of oscillations.
4. Analysis of the effect of Ca2+ wave speed on fluid flow
Previous work has investigated how the frequency of Ca2+ oscillations may encode signalling information in the phosphorylation of a cellular substrate by protein kinase, Goldbeter et al. (1990), and in hepatocytes, Larsen et al. (2004). We investigate the effect of wave speed on saliva secretion by varying the time difference between the peak in Ca2+ at the apical and basal membranes. Experimentally, Won et al. (2007) report a wave-speed of 27.81 μm/s with Ca2+ peaking at the apical membrane approximately 1 second before the basal membrane. These measurements suggest the distance between the two membranes is 27.81 μm: for simplification this work uses a distance of 25 μm between membranes.
In Figure 2 we numerically simulate an apical to basal Ca2+ wave having a 1 second time difference between the apical and basal Ca2+ peaks. With our assumed cell size of 25 μm from the apical to basal membrane this is equivalent to a wave speed of 25 μm/s. If instead we ran a simulation with a 2 second time between the apical and basal membrane peak in Ca2+ this would approximate a wave speed of 12.5 μm/s, assuming the same cell size. Using this idea of changing the time between apical and basal Ca2+ peaks we can simulate a range of wave speeds and observe the effect on secretion.
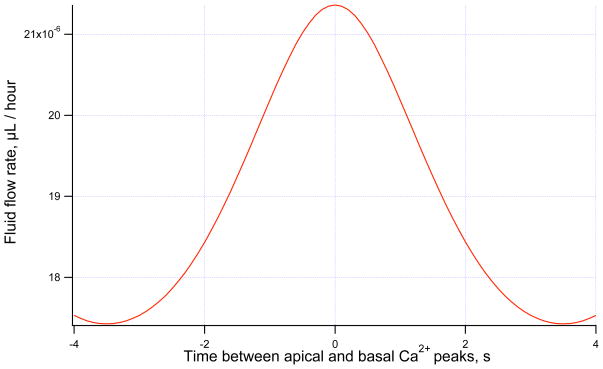
In Figure 3 the effect of the time between apical and basal Ca2+ peak can be seen on the average fluid flow rate. It is shown that maximum secretion occurs when the time difference is zero, implying synchronous Ca2+ oscillations at the two-membranes, or equivalently a homogeneous rise and fall of Ca2+ throughout the cytosol. A minimum secretion rate occurs at a time difference of 3.5 seconds. This is a time difference of exactly half the oscillation period and oscillations at the two membranes are out of phase.
Figure 3.
Fluid flow rate against time difference between apical and basal Ca2+ peak. Maximum secretion occurs when the apical and basal oscillations are synchronous. Ca2+ waves are approximated using a sine function with 150 nM mean, 100 nM amplitude and 7 s period.
For this result, and the remainder of the analysis, a sinusoidal function was used to approximate the Ca2+ oscillations at each membrane. However the same result can be reproduced for several different periodic functions at both membranes. A mathematical argument that a local maximum occurs when oscillations are synchronous for any periodic function is given in Appendix B.
The result that synchronous oscillations are most efficient appears to suggest that the experimentally observed Ca2+ waves seen by Won et al. (2007), with a 1 second time difference between apical and basal Ca2+ peak, are less than efficient at signalling saliva secretion. There are, however, some assumptions made in the analysis above that we now explore. In particular the model currently has all ion channels operating at steady state. However, experimentally the ion channels have a time dependence. We will address this model shortfall in the following section.
5. Time-dependent Cl− channel gating
In Arreola et al. (1996) the Cl− channels are found to react very quickly to changes in Ca2+ at physiologically realistic membrane potentials and Ca2+ concentrations. This quick opening and closing led us to initially use a steady-state model for the Cl− channel. We investigate whether adding the time dependence of the Cl− channel to the model affects the results relating to fluid secretion.
In Arreola et al. (1996) a four-state model is given for the Cl− channel with three closed and one open state as seen below,
Rates α1 and β1 are faster than α2 and β2 and their dependence on Ca2+ is not given explicitly in Arreola et al. (1996). Hence we simplify this model to a 2-state model using a rapid equilibrium approximation to group the three closed states, C1, C2 and C3 into one new closed state C.
This two-state model simplification approximates the experimental data well (result not shown). Applying the two-state reduction we get a differential equation for the fraction of open Cl− channels,
Here β2 is the same reverse rate as seen in Arreola et al. (1996). The forward reaction rate, α, given in terms of the original rates K1, K2 and α2 in Arreola et al. (1996), is shown below.
Here,
β2 = K2α2 s−1, α2 = 4.5 s−1 and Ca is the Ca2+ concentration at the apical membrane. Va is the membrane potential of the apical membrane. The total current through the Cl− channels is then given by
where gCl = 31.4 nS is the maximum whole cell conductance found by Arreola et al. (1996). VCl is the Nernst potential given by
where [Cl]l and [Cl]i are the Cl− concentrations in the lumen and cytosol respectively and zCl = − 1 is the valence of Cl−, R = 8.315 J mol−1 K−1, T = 310 K and F = 96490 C mol−1.
5.1. The effect of wave speed on fluid secretion rate in a model with time-dependent Cl− channels
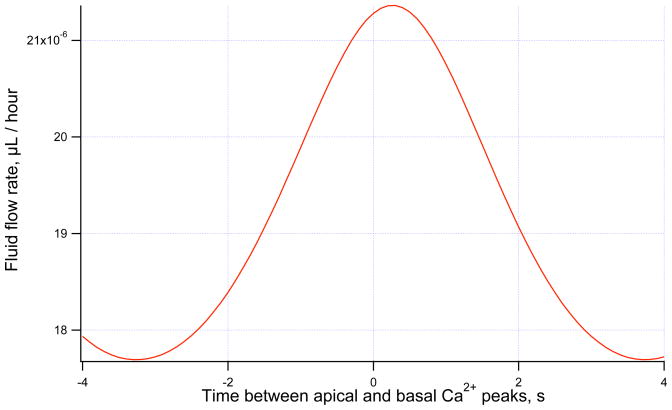
The effect of wave speed on fluid flow is investigated using the same method of varying the time difference between the apical and basal Ca2+ peaks described in Section 4. When time dependence of the Cl− channel is added to the model we find that a maximum secretion rate occurs with a small positive time difference between the Ca2+ peaking at the apical and basal membranes (see Figure 4). Ca2+ waves are simulated with a sinusoidal function with mean 150 nM, amplitude 100 nM and a period of 7 seconds.
Figure 4.
Fluid flow rate against time difference between apical and basal Ca2+ peak in a model with time-dependent Cl− channels. Maximum fluid flow occurs when Ca2+ peaks at the apical membrane 0.2 s before the basal membrane.
In Figure 4 it can be seen that maximum secretion occurs when the Ca2+ wave peaks at the apical membrane 0.2 s before the basal membrane. This roughly equates to an apical to basal wave with a speed of 125 μm/s, assuming a cell size of 25 μm from apical to basal membrane. This is much faster than the observed wave speed of 27.81 μm/s seen by Won et al. (2007).
5.2. The effect of wave period on fluid secretion rate in a model with time-dependent Cl− channels
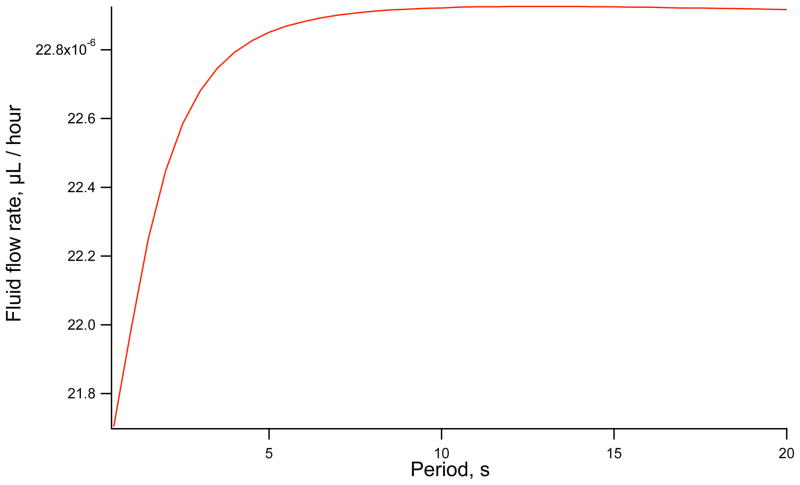
In Figure 5 a sinusoidal function is used to simulate Ca2+ at the two membranes with a mean of 100 nM and an amplitude of 50 nM.
Figure 5.
Fluid flow rate against period of Ca2+ oscillations. The maximum fluid flow rate occurs with long period oscillations.
Figure 5 shows that as the period of the Ca2+ waves is increased the average saliva secretion rate increases. If Ca2+ oscillates quickly the time-dependent Cl− channel will lag behind the current Ca2+ concentration. This results in less than maximum fluid flow. As the Ca2+ oscillation period is increased we find that fluid flow reaches a maximum. It should be noted that the rate of secretion changes very little despite large changes in oscillation period with the least efficient rate being only 96% of the most efficient period.
5.3. The effect of mean Ca2+ on fluid secretion rate in a model with time-dependent Cl− channels
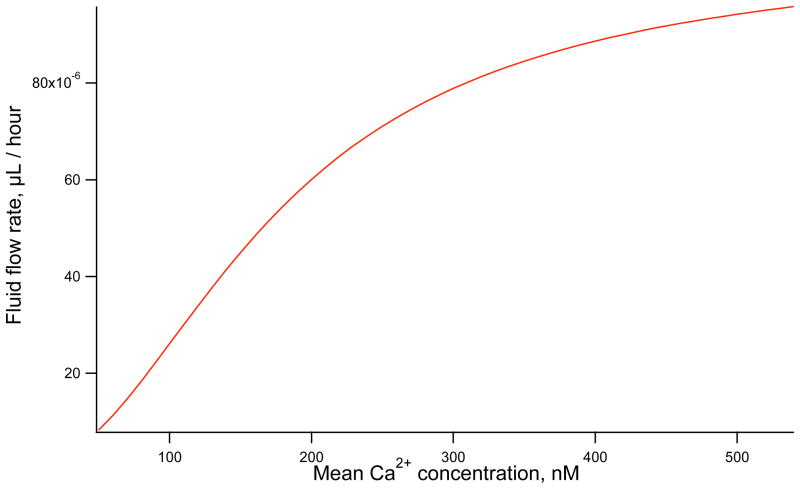
The effect of mean Ca2+ on fluid flow is seen in Figure 6. As the mean Ca2+ concentration increases the amount of secretion increases. The profile of fluid flow as Ca2+ increases takes a sigmoidal shape, initially increasing rapidly at low Ca2+ concentrations and levelling off as the ion channel open probability approaches 1. A very large difference is observed in secretion rates with a high Ca2+ concentration secreting almost 10 times the volume of low concentrations.
Figure 6.
Fluid flow rate against mean Ca2+ concentration. Larger mean Ca2+ concentrations increase secretion rate. Simulations are completed using a sine function with 20 nM amplitude and 7 s period.
5.4. The effect of oscillation amplitude on fluid secretion rate in a model with time-dependent Cl− channels
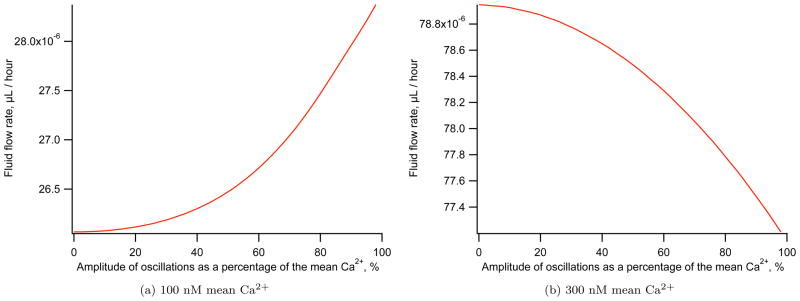
The effect of oscillation amplitude on fluid flow is investigated. With a mean Ca2+ concentration of 100 nM, increasing the amplitude of oscillations increases the rate of secretion. This can be seen in Figure 7a. If instead the mean Ca2+ is increased to 300 nM the opposite is true, Figure 7b, with increasing oscillation amplitude reducing secretion. This result can be explained by the profile of fluid flow with mean Ca2+ seen in Figure 6. At low Ca2+ concentrations the function is convex. Jensen’s inequality states
Figure 7.
Fluid flow rate against amplitude of periodic Ca2+ oscillations for two different mean Ca2+ concentrations. The maximum fluid flow rate occurs with large amplitude oscillations for a 100 nM mean Ca2+. With a larger 300 nM mean Ca2+ the maximum secretion occurs with low amplitude oscillations. Both simulations are completed with a 7 s period sine function.
where E is the expectation and f is a convex function. If we consider an oscillating function of Ca2+, this inequality says that the average secretion rate for some oscillating function of Ca2+ is greater than the rate of secretion at the mean Ca2+ concentration. Or equivalently, we expect a larger amplitude to give us greater secretion than a constant Ca2+ concentration.
With a larger mean Ca2+ concentration the profile of secretion with Ca2+ becomes concave and the converse is true with larger amplitude causing a reduction in secretion. At a mean Ca2+ concentration of around 120 nM the secretion rate as a function of Ca2+ is neither convex or concave. Here amplitude has no significant effect on secretion (result not shown).
6. Discussion
Ca2+ signals involving oscillations are commonly found in biological systems, and are thought to enable a larger bandwidth of signalling. We have found that each of the investigated properties of Ca2+ waves are capable of altering the rate of saliva secretion to differing degrees.
We find Ca2+ oscillation frequency to be inefficient at regulating secretion rate, with only a 4% change in secretion over a large range of frequencies. Any difference in secretion is due to the time-dependence of the Cl− channel as no change is observed when this is absent from the model. Gray (1988) find that given a large range of applied agonist concentrations the parotid acinar cells oscillated with a reasonably constant frequency, potentially supporting the idea that frequency encoding is unimportant in the parotid acinar cell. It is worth noting the shape of Figure 5. As the period is increased a plateau is reached. Bruce et al. (2002) report 7–11 Ca2+ oscillations per minute in parotid acinar cells giving a period of 5.5–8.5 seconds. This physiologically realistic range for oscillations lies just at the start of the plateau maximising efficiency of secretion.
As the Ca2+ wave speed is changed a noticeable change in secretion rate occurs with the least efficient wave speed secreting 83% of the maximum secretion rate that is obtained with the most efficient wave speed. Our model with time-dependent Cl− channels predicts apical to basal Ca2+ waves to be the most efficient, however the most efficient secretion is predicted for a wave speed much faster than observed experimentally by Won et al. (2007). The model used for this analysis has Cl− channels in the apical membrane and K+ in the basal membrane. There is evidence, both experimental and theoretical (Almassy et al. (2012) and Palk et al. (2010)) that apical K+ channels are found in parotid acinar cells. These K+ channels are thought to be of the maxi-K type. It is possible that the addition of these K+ channels to the model with their time dependence could make slower wave speeds more efficient to parotid acinar cell function. Future work would require a detailed study of the activation of maxi-K channels by Ca2+ in order for this to be properly resolved.
The experimentally observed wave speed of 27.81 μm/s seen by Won et al. (2007) is found to remain roughly constant in parotid acinar cells for varying amounts of stimulation, and therefore it seems unlikely that wave speed is used as a signalling mechanism. This wave speed is very similar to Ca2+ waves observed in other mammalian cell types by Jaffe (1991), with only cardiac myocytes displaying much greater wave speeds. It seems possible that a similar wave generation mechanism in different cell types might limit wave speeds to this narrow range. One might conjecture that Ca2+ waves travel at a speed which maximises fluid secretion or, alternatively, that the ion channels responsible for fluid regulation have adapted to maximise secretion for this constrained wave speed.
The effect of Ca2+ oscillation amplitude on secretion is dependent on the mean Ca2+ concentration, with increasing amplitude increasing secretion at low Ca2+ concentrations and decreasing secretion as the mean Ca2+ increases. Gray (1988) reports a large range of oscillation amplitudes seen experimentally and thus it is unclear what role amplitude might have in signalling.
By far the most significant mechanism for signalling is the mean Ca2+ concentration. Here the flow rate for low Ca2+ concentration is less than 10% what is seen for the highest concentration. Foskett and Melvin (1989) find a resting level of Ca2+ as 59 nM, increasing to 474 nM when stimulated with carbachol. According to our model this would result in a 10-fold increase in secretion. Experimentally an increase of between 6 and 13 fold is seen between resting and stimulated salivary glands, Ben-Aryeh et al. (1986) and Heft and Baum (1984).
By avoiding a detailed spatial model, wave properties are easily isolated and investigated for their effect on secretion. Several assumptions are made in using this simplified approach. Changing a global variable, such as the wave speed, is assumed to affect the apical and basal regions equally and not to affect other variables. If we were to alter the wave speed experimentally, perhaps by inhibiting the Ca2+ release channels, we might expect the profile of the oscillations at the two membranes to change. It is also likely that the frequency, amplitude and mean Ca2+ concentration would also be changed.
In Section 5 we consider the time-dependence of the Cl− channel gating using the experimental data and model of Arreola et al. (1996). There are other time-dependent processes that have not been included in this analysis. As previously mentioned, further data is needed for the inclusion of time-dependent maxi-K channels. Membrane mechanics and fluid dynamics are also likely to add time-dependent effects to the model, but are not considered due to their complexity.
The overall aim of our research is to understand the regulation of saliva secretion across temporal and spatial scales from individual ion channels to whole gland secretion rates. To create a multiscale model of saliva secretion we must decide what detail to include and what to simplify. Given that Ca2+ waves are found experimentally, a spatial modelling approach might be taken using partial differential equations to solve for Ca2+. However, unless we are particularly interested in how Ca2+ waves arise then this detailed spatial model will be numerically costly and produce large amounts of data which are not required. A conclusion from this analysis is that a detailed model of Ca2+ waves is unlikely to result in improved results relating to the rate of fluid secretion. By far the most important signalling mechanism is found to be the mean Ca2+ concentration. Therefore it is our opinion than a compartment model using ordinary differential equations with homogeneous Ca2+ oscillations is sufficient when considering secretion rate as the most important model variable. Going further, if mean secretion rate is the only model concern and extreme computational constraints existed, perhaps considering a whole-organ model, it would even be possible to ignore all oscillations completely and just consider Ca2+ as a constant function of agonist stimulation.
On the topic of signal transduction we might hypothesise that the process of salivation does not require the complex signal encoding that is seen in some other cell types. It seems unlikely that we must signal for an exact saliva secretion rate. If accuracy in the flow rate is not required then an increase in mean Ca2+ might be all that is required as a signalling mechanism. We might further hypothesise that the other experimentally observed wave properties, such as oscillation frequency and wave speed, might be tuned to values which offer the maximum efficiency in secretion for a given mean Ca2+ concentration.
Table A.1.
Model parameter values
| Physical constants | |||||
| R | 8.315 J mol−1 K−1 | T | 310 K | F | 96490 C mol−1 |
| Whole cell conductance’s | |||||
| gCl | 31.4 nS* | gK | 14 nS** | ||
| Pump Densities | |||||
| αNaK | 2.236 × 10⁻¹⁷ mol | αNKCC | 3.2 × 10⁻¹⁷ mol | ||
| Volumes | |||||
| w0 | 10−12 L | wL/w0 | 0.02 | ||
| Water permeabilities | |||||
| LPa | 1.68 × 10⁻¹⁵ L2 J−1 s−1 | LPb | 2.07 × 10⁻¹⁴ L2 J−1 s−1 | ||
| LPt | 8.4 × 10⁻¹⁷ L2 J−1 s−1 | ||||
| Cell properties | |||||
| Cm | 10−11F | x/w0 | 30.7 mM | ||
| Electrical parameters | |||||
| Rt | 6.8 × 10⁸ ohms | gt,Na | 0.955 | ||
| Ionic valence | |||||
| zCl | −1 | zK | +1 | zNa | +1 |
| Interstitial concentrations | |||||
| [Cl]e | 102.6 mM | [Na]e | 140.2 mM | [K]e | 5.3 mM |
from Arreola et al. (1996),
from Thompson and Begenisich (2006), other parameters are physical constants or model fits chosen to give the correct steady state concentrations and membrane potentials.
Acknowledgments
This work was supported by National Institutes of Health Grant R01-DE19245.
Appendix A. Model equations
Appendix A.1. Fluid flow model
A summary of the main differential equations in the fluid flow model is included below. We use the following subscript notation with [Cl]i, [Cl]l and [Cl]e denoting the Cl− concentration in the cytosol, lumen and interstitium respectively. For full details and parameter values see Palk et al. (2010), we choose to not include apical K+ channels in this analysis and therefore set αK = 1. Differential equations for the cytosolic concentrations are as follows,
| (A.1) |
| (A.2) |
| (A.3) |
where
is the current through the tight junction.
Lumenal ionic concentrations are given by the following differential equations,
| (A.4) |
| (A.5) |
| (A.6) |
Equations for the basal and apical membrane potentials are,
| (A.7) |
| (A.8) |
The fluid flow across the apical membrane is
were [Ca]i is the mean Ca2+ concentration throughout the cytosol given by
where Ca and Cb are the apical and basal Ca2+ concentrations respectively.
The basal fluid flow qb and paracellular fluid flow qtight are given respectively,
The total secretion is then given by the sum of the paracellular and transcellular components,
The cell volume is governed by the balance of incoming and outgoing fluid flow,
| (A.9) |
Full details of the fluxes and parameters used can be seen in Palk et al. (2010).
Appendix A.2. Cl− channels
For the analysis in Section 4 a steady-state model of Cl− channel gating from Arreola et al. (1996) is used (for details of the non steady-state model see Section 5). Here the Cl− channel steady-state open probability is given as
Where Ca is the Ca2+ concentration at the apical membrane and
Here Va is the membrane potential of the apical membrane. Total current through the Cl− channels is then given by,
gCl is the maximum whole cell conductance, 31.4 nS found by Arreola et al. (1996). VCl is the Nernst potential given by,
zCl = − 1 is the valence of Cl−, R = 8.315 J mol−1 K−1, T = 310 K and F = 96490 C mol−1.
Appendix A.3. K+ channels
We use the model of Takahata et al. (2003). The steady-state open probability of the K+ channel at the basal membrane is given as,
where Cb is the Ca2+ concentration at the basal membrane and nH = 2.54 and Kd = 0.182 μM. Kd is modified from the value found by Takahata et al. (2003) of Kd = 0.43 μM to give a small open probability at steady state Ca2+ concentrations.
The current through the K+ channel at the basolateral membrane, IK, is given by
where gK is the maximum whole cell conductance of 14 nS, the value found by Thompson and Begenisich (2006). VK is the nernst potentials of the basololatoral membrane given by,
here zK = +1 is the valence of K+.
Appendix A.4. Na+ - K+ - ATPase simplification
As in Palk et al. (2010) a simplified model of the Na+ - K+ - ATPase is used with the steady-state flux as follows.
| (A.10) |
With r = 1.305 × 10⁶ s−1 mM−3 and α = 0.647 mM−1. JNaK = αNaKνNaK, where αNaK = 2.236 × 10⁻¹⁷ mol is the density of the Na+ - K+ - ATPase exchanger.
Appendix A.5. Na+ - K+ - 2Cl− cotransporter simplification
As in Palk et al. (2010) a simplified model of the Na+ - K+ - 2Cl− cotransporter is used with the steady-state flux as follows.
| (A.11) |
Where rNKCC = 4.31 s−1, α1 = 1.2755 × 10⁵, α2 = 3.7894 × 10⁴ and KNKCC = 0.0282 mM4. JNKCC = νNKCCαNKCC where αNKCC = 3.2 × 10⁻¹⁷ mol is the membrane density of the cotransporter.
Appendix B. Approximate analysis of model equations: synchronous Ca2+ waves produce a local maximum for fluid secretion
Here we seek to show that the fluid secretion model with steady-state ion channels seen in Section 2 has a maximum secretion rate when Ca2+ oscillations are synchronous at apical and basal membranes. In order to do this we must make some assumptions. First we make the assumption that the membrane potentials are at quasi-steady-state, which we can justify given the very small membrane capacitance Cm. This gives,
| (B.1) |
and
| (B.2) |
Now we substitute the definitions for the currents, IK, ICl and Itight into equations B.1 and B.2, giving,
and
If we solve both these equations simultaneously we can get expressions for the membrane potentials Va and Vb. During simulations it is found that, for near isosmotic fluid secretion, fluid flow is proportional to the current through the tight junction, see Maclaren et al., 2011 (in submission). The tight junctional current is given by (Va − Vb)/Rtight, we use this as follows.
Here we have used the notations PCL = PclgCl and PK = Pkgk.
Appendix B.1. Periodic functions
We will make the assumption that during the course of one Ca2+ wave both PCL and PK are periodic functions. We take this assumption further to make these both the same periodic function with a phase difference δ. We also assume VCl and Vk stay approximately constant, a valid assumption if changes in ionic concentrations are small. We then denote, , γ = F JNak and . The expression for fluid flow then becomes,
where A and γ are positive constants and f(t) is any periodic function, period T. Now we would like to see how the average flow over the course of one period, T, depends on the phase difference δ.
We define I to be the total flow over a period, T,
We would like to find when this expression has a maximum and minimum. Taking the derivative with respect to δ,
We predict a maximum at δ = 0, so looking at the partial derivate here,
As, 2f(0) = 2f(T), being a periodic function, this gives,
and therefore a maximum or minimum occurs when there is no phase difference. To determine whether this is a maximum or minimum we look at the second derivative.
where,
and
Evaluating the first integral, I1 using integration by parts,
Evaluating the integral I3 using integration by parts,
Now
If we assume A is a positive constant and that f(t) is a positive function, both valid assumptions, then here we are taking the integral of an expression that is strictly positive. The sign of the second derivative is therefore determined by the expression (2 − γA). Looking back to the original notation, . Under physiological condition the various terms are of the following magnitude,
Therefore γA ~ O(10−2) and,
By proving the second derivative is negative we have shown that δ = 0 is a local maximum and thus there is a local maximum in secretion when Ca2+ waves are synchronous at the apical and basal membranes.
Footnotes
Publisher's Disclaimer: This is a PDF file of an unedited manuscript that has been accepted for publication. As a service to our customers we are providing this early version of the manuscript. The manuscript will undergo copyediting, typesetting, and review of the resulting proof before it is published in its final citable form. Please note that during the production process errors may be discovered which could affect the content, and all legal disclaimers that apply to the journal pertain.
References
- Almassy J, Won J, Begenisich T, Yule D. Apical ca2+-activated potassium channels in mouse parotid acinar cells. The Journal of General Physiology. 2012;139(2):121–133. doi: 10.1085/jgp.201110718. [DOI] [PMC free article] [PubMed] [Google Scholar]
- Arreola J, Melvin J, Begenisich T. Activation of calcium-dependent chloride channels in rat parotid acinar cells. The Journal of General Physiology. 1996;108(1):35–47. doi: 10.1085/jgp.108.1.35. [DOI] [PMC free article] [PubMed] [Google Scholar]
- Ben-Aryeh H, Shalev A, Szargel R, Laor A, Laufer D, Gutman D. The salivary flow rate and composition of whole and parotid resting and stimulated saliva in young and old healthy subjects. Biochemical medicine and metabolic biology. 1986;36(2):260–265. doi: 10.1016/0885-4505(86)90134-9. [DOI] [PubMed] [Google Scholar]
- Berridge M. The AM and FM of calcium signalling. Nature. 1997;386:759–760. doi: 10.1038/386759a0. [DOI] [PubMed] [Google Scholar]
- Bruce JIE, Shuttleworth TJ, Giovannucci DR, Yule DI. Phosphorylation of inositol 1,4,5-trisphosphate receptors in parotid acinar cells. a mechanism for the synergistic effects of cAMP on Ca2+ signaling. J Biol Chem. 2002;277(2):1340–1348. doi: 10.1074/jbc.M106609200. [DOI] [PubMed] [Google Scholar]
- De Koninck P, Schulman H. Sensitivity of CaM kinase II to the frequency of Ca2+ oscillations. Science. 1998;279(5348):227. doi: 10.1126/science.279.5348.227. [DOI] [PubMed] [Google Scholar]
- Foskett J, Melvin J. Activation of salivary secretion: coupling of cell volume and [Ca2+]i in single cells. Science. 1989;244(4912):1582–1585. doi: 10.1126/science.2500708. [DOI] [PubMed] [Google Scholar]
- Foskett JK. [Ca2+]i modulation of Cl- content controls cell volume in single salivary acinar cells during fluid secretion. AJP - Cell Physiology. 1990;259(6):C998–1004. doi: 10.1152/ajpcell.1990.259.6.C998. [DOI] [PubMed] [Google Scholar]
- Gin E, Crampin EJ, Brown DA, Shuttleworth TJ, Yule DI, Sneyd J. A mathematical model of fluid secretion from a parotid acinar cell. Journal of Theoretical Biology. 2007;248(1):64–80. doi: 10.1016/j.jtbi.2007.04.021. [DOI] [PMC free article] [PubMed] [Google Scholar]
- Goldbeter A, Dupont G, Berridge M. Minimal model for signal-induced Ca2+ oscillations and for their frequency encoding through protein phosphorylation. Proceedings of the National Academy of Sciences of the United States of America. 1990;87(4):1461. doi: 10.1073/pnas.87.4.1461. [DOI] [PMC free article] [PubMed] [Google Scholar]
- Gray P. Oscillations of free cytosolic calcium evoked by cholinergic and catecholaminergic agonists in rat parotid acinar cells. The Journal of Physiology. 1988;406(1):35. doi: 10.1113/jphysiol.1988.sp017367. [DOI] [PMC free article] [PubMed] [Google Scholar]
- Heft M, Baum B. Basic biological sciences unstimulated and stimulated parotid salivary flow rate in individuals of different ages. Journal of dental research. 1984;63(10):1182. doi: 10.1177/00220345840630100101. [DOI] [PubMed] [Google Scholar]
- Jaffe L. The path of calcium in cytosolic calcium oscillations - a unifying hypothesis. Proceedings of the National Academy of Sciences of the United States of America. 1991 Nov;88(21):9883–9887. doi: 10.1073/pnas.88.21.9883. [DOI] [PMC free article] [PubMed] [Google Scholar]
- Larsen A, Olsen L, Kummer U. On the encoding and decoding of calcium signals in hepatocytes. Biophysical chemistry. 2004;107(1):83–99. doi: 10.1016/j.bpc.2003.08.010. [DOI] [PubMed] [Google Scholar]
- Palk L, Sneyd J, Shuttleworth T, Yule D, Crampin E. A dynamic model of saliva secretion. Journal of Theoretical Biology. 2010 doi: 10.1016/j.jtbi.2010.06.027. [DOI] [PMC free article] [PubMed] [Google Scholar]
- Sneyd J, Tsaneva-Atanasova K, Bruce JIE, Straub SV, Giovannucci DR, Yule DI. A model of calcium waves in pancreatic and parotid acinar cells. Biophysical Journal. 2003;85(3):1392–1405. doi: 10.1016/S0006-3495(03)74572-X. [DOI] [PMC free article] [PubMed] [Google Scholar]
- Takahata T, Hayashi M, Ishikawa T. SK4/IK1-like channels mediate TEA-insensitive, Ca2+-activated K+ currents in bovine parotid acinar cells. AJP - Cell Physiology. 2003;284(1):C127–144. doi: 10.1152/ajpcell.00250.2002. [DOI] [PubMed] [Google Scholar]
- Tang Y, Othmer H. Frequency encoding in excitable systems with applications to calcium oscillations. Proceedings of the National Academy of Sciences. 1995;92(17):7869. doi: 10.1073/pnas.92.17.7869. [DOI] [PMC free article] [PubMed] [Google Scholar]
- Thompson J, Begenisich T. Membrane-delimited inhibition of maxi-K channel activity by the intermediate conductance Ca2+-activated K channel. J Gen Physiol. 2006 Feb;127(2):159–69. doi: 10.1085/jgp.200509457. [DOI] [PMC free article] [PubMed] [Google Scholar]
- Won J, Cottrell W, Foster T, Yule D. Ca2+ release dynamics in parotid and pancreatic exocrine acinar cells evoked by spatially limited flash photolysis. American Journal of Physiology-Gastrointestinal and Liver Physiology. 2007;293(6):G1166. doi: 10.1152/ajpgi.00352.2007. [DOI] [PubMed] [Google Scholar]
- Zimmermann B, Walz B. The mechanism mediating regenerative intercellular Ca2+ waves in the blowfly salivary gland. The EMBO journal. 1999;18(12):3222–3231. doi: 10.1093/emboj/18.12.3222. [DOI] [PMC free article] [PubMed] [Google Scholar]


