

Abstract
Schizophrenia is a severe psychiatric disorder with a strong genetic predisposition. Structural and functional brain deficits throughout the cerebral cortex, particularly in the language-processing associated brain regions, are consistently reported. Recently, increasing evidence from magnetic resonance imaging (MRI) studies suggests that healthy relatives of schizophrenic patients also show structural brain abnormalities in cortical gray matter (GM) volume, and thickness, suggesting that this may be associated with an unexpressed genetic liability for the disorder. Unfortunately, the findings are not consistent, which may be caused by different age ranges of the cohorts studied. In the present study, we examined the voxel-based whole brain cortical thickness, area, GM volume densities, and regional cortical thickness-related laterality indices in 14 bilateral ROIs from known language-processing circuits, in 20 schizophrenia patients, 21 young non-psychotic subjects with heightened genetic risk for schizophrenia at the peak ages for development of the disorder, and 48 matched controls. The results showed widespread significant reductions in cortical thickness, cortical GM volume density, and scattered decreases in cortical surface area in the schizophrenia patients compared with those in the high-risk subjects and normal controls. Moreover, the genetic high-risk subjects showed significantly increased regional cortical thickness in 7 of the 14 ROIs in the language-processing pathway when compared with controls. They also had increased GM volume density in scattered regions associated with language-processing when compared with the normal controls. Laterality analyses showed that the spatial distribution of abnormal cortical thickness in the schizophrenia patients as well as in the high-risk subjects, contributed to a decrease of the normal left-greater-than-right anatomical asymmetry in inferior orbital frontal area, and a increased left-greater-than-right pattern in the inferior parietal and occipital regions. Together with the existing findings from literature, the results of the present study suggest that developmental disruption of the anatomical differentiation of the hemispheres provides a basis for understanding the language impairment and symptoms of psychosis, and that these may arise because of abnormal left-right hemispheric communications that interrupt the normal flow of information processing. The early structural deficits in language-processing circuits may precede the appearance of symptoms and can indicate increased risk of developing schizophrenia.
Keywords: Schizophrenia, Genetic high-risk, Structural abnormality, Language circuits, Magnetic Resonance Image
1. Introduction
Schizophrenia is a complex, heritable mental disorder with widespread brain abnormalities reported extensively in neuroimaging studies (reviewed in (Kubicki et al., 2005; Li et al., 2009; Shenton et al., 2010)). Gray (GM) matter volume density reductions and cortical thinning have been frequently reported. Voxel-Based Morphometry (VBM) studies in first-episode, antipsychotic-naïve patients with schizophrenia have shown regional GM reductions in superior and inferior frontal regions, as well as post-central, inferior parietal lobule, and cerebellum (Jayakumar et al., 2005), and significant GM density reductions in the left posterior temporal gyrus, which is strongly associated with Heschl's gyrus (the primary auditory cortex) (Kubicki et al., 2002), compared with controls. In first-episode schizophrenia, whole brain cortical thickness studies have indicated significant reductions in prefrontal (Venkatasubramanian et al., 2008) and anterior cingulate cortices (Fornito et al., 2008), compared to controls. A recent meta-analysis of 31VBM studies in both first-episode and chronic schizophrenia patients reported that schizophrenic patients had reduced gray matter density in bilateral insular cortex, anterior cingulate, left parahippocampal gyrus, left middle frontal gyrus, postcentral gyrus, and thalamus regions, compared with controls (Glahn et al., 2008). Another meta-analysis of 27 VBM studies by the same research group compared the GM volume changes between the first-episode and the chronic schizophrenia patients and reported bilateral reductions in caudate head gray matter in first-episode patients, which were absent in chronic schizophrenia (Ellison-Wright et al., 2008). One ROI-based cortical thickness study in chronic schizophrenia patients showed significant thinning in bilateral orbitofrontal, left inferior frontal, left inferior temporal, left occipitotemporal, right medial temporal ROIs compared to controls (Kuperberg et al., 2003a). A study of adult onset chronic schizophrenia has reported a complex pattern of reduced thickness in frontal, temporal and occipital regions (Schultz et al., 2010). Probable confounders such as age, diagnosis, and anti-psychotic medication were shown to have no effect on cortical thickness in schizophrenic patients (Nesvag et al., 2008). In these studies, the frequently reported brain structures with deficits in the frontal, temporal, and parietal lobes play important roles in the language processing pathway (Li et al., 2009).
Since genetic factors play a strong role in the risk for schizophrenia, the extent of brain abnormalities in first-degree healthy relatives of schizophrenic patients have been increasingly investigated. One ROI-based morphometric study of prefrontal sub-regions in adolescent and young adult relatives of schizophrenia patients (13-28 years old) found significantly reduced bilateral ventro-medial prefrontal and frontal pole gray matter volumes compared with controls (Rosso et al., 2010). One study reported that unaffected young siblings of schizophrenia patients (25.3±4.3 years old) had significantly smaller volumes of the hippocampus corpus and tail bilaterally, but not of the head, compared with healthy controls; and siblings who later developed psychosis had smaller right hippocampus corpus and tail volumes than did those who did not develop psychosis (Witthaus et al., 2010). The findings of this study by Witthaus et al were consistent with the early findings reviewed by (Seidman et al., 2003). Two MR imaging studies that investigated cortical thickness of adult relatives of schizophrenic patients (ages 34.2±11years old) showed that compared with controls, relatives of schizophrenia patients had a bilateral decrease in cingulate thickness, decreased surface area in the superior temporal lobe, and a subtle increase of surface area in the left hemisphere, bilateral parahippocampal gyri, and in the left middle temporal lobe (Goghari et al., 2007a), and reversed hemispheric asymmetry in their cingulate sulcus thickness and a bilateral reduction in their superior temporal sulcus thickness (Goghari et al., 2007b). Studies in unaffected young siblings who have ultra high-risk for developing schizophrenia reported significantly increased right amygdala volume (Welch et al., 2010); significantly increased right prefrontal cortical folding (Stanfield et al., 2008); and significantly reduced probability of GM density in bilateral anterior cingulate, and as a trend in the left parahippocampal gyrus (Job et al., 2003), compared with controls.
On the contrary, some other studies have shown that there were no significant structural differences between unaffected relatives of schizophrenia patients and normal controls. For example, an early study reported that no significant group differences of cortical and intracranial volumes were present in relatives of schizophrenia patients (40.9±8.6 years old), compared to age-matched controls (Staal et al., 2000), and a recent study with a large sample size (age from 17-60 years old) identified widespread cortical thickness reductions in frontal and temporal lobes in schizophrenia patients, but not in unaffected siblings compared to normal controls (Goldman et al., 2009). The peak age for onset of schizophrenia is from late adolescence to young adult (DeLisi, 1992)). It is thus likely that the siblings before or at the peak ages of high-risk for developing schizophrenia and the elder siblings who have never developed illness have significantly different trajectories of anatomical development. Thus, the involvement of elder siblings and a large age range used in those familial studies may be the major cause of a lack of differences between unaffected siblings and controls.
In the current study, we focus on three cohorts of populations: patients with chronic schizophrenia, young first-order relatives of schizophrenia patients within the age range of high-risk for developing schizophrenia, and normal controls. We assessed the differences in whole brain and regional cortical thickness, area, and GM volume densities in structures relating to language-processing in the three diagnostic groups. Interest in these regions is based on our previous fMRI studies that have shown significant brain regional activation and connectivity differences in language processing and reduced normal lateralized activation using a lexical decision task with fMRI in genetic high-risk subjects and their schizophrenia relatives (Li et al., 2007a; Li et al., 2007b; Li et al., 2010). The current study includes individuals from the previous fMRI studies. We thus hypothesize that there are anatomical bases for the disturbed functional activation and connectivity in the language-processing pathways, which are developmental and appear before the onset of the clinical illness. Thus people who are at genetic high-risk for schizophrenia, as well as those who already exhibit the illness should have detectable evidence of these changes, such as in inferior orbital frontal, inferior opercular frontal, inferior parietal and superior temporal regions.
2. Methods
2.1. Subjects
A total of 89 individuals were included in this study: 48 normal controls, 21 subjects at genetic high-risk for developing schizophrenia, and 20 patients with schizophrenia. Individuals in the normal control group did not have personal or family history of any psychotic disorder, psychiatric hospitalization, or suicide in any first or second-degree relatives and were not found to have any evidence of a psychotic illness (schizophrenia, bipolar disorder or psychosis not otherwise specified) upon evaluation. Subjects in the genetic high-risk group were within the peak age range of risk for developing schizophrenia (DeLisi, 1992; Li et al., 2007a), and originated from families in which at least one first-degree relative (parent or sibling) had a diagnosis of schizophrenia or schizoaffective disorder, or in which there was a prevalence of the illness within multiple generations of the family. Although none of the subjects at genetic high-risk had a history of psychosis, 7 were diagnosed with DSM-IV axis II schizotypal personality disorder, and 4 of these 7 had a history of at least one episode of major depression. Controls were age and sex matched to high-risk subjects. Neither the normal control nor the high-risk participants were ever treated with medication for psychotic symptoms. All patients with schizophrenia were taking conventional or atypical antipsychotic medications.
Control subjects were solicited from the community by public advertisement. Patients with schizophrenia and subjects in the high-risk cohort were recruited by placing advertisements in newspapers and newsletters distributed by multiple chapters of the National Alliance on Mental Illness (NAMI) or from families who had previously participated in a genetic study of schizophrenia (DeLisi et al., 2002). Every participant underwent an interview using the Diagnostic Interview for Genetic Studies (DIGS) (Nurnberger, Jr. et al., 1994), and was diagnosed by DSM-IV criteria. Evaluations were made based upon the interview, information collected from family members, and medical records. To characterize the general and language-related cognitive capacity of each subject and test our hypothesis regarding language impairment, we aggregated the information derived from a cognitive test battery comprising 1) Full-scale, Verbal, and Performance IQ's for measuring general cognitive ability (WAIS-III for adult (Wechsler, 1997) and WISC-IV for children (Wechsler, 2004)); 2) The Verbal Comprehension Index (WAIS-VCI) used as the primary measure of verbal capacity; 3) Peabody Picture Vocabulary Test, 3rd Edition (PPVT-II) used to measure Receptive Language capacity (Dunn and Dunn, 1997); 4) Wide Range Achievement Test, 3rd Edition (WRAT) for Expressive Language and Academic Skills (Wilkinson GS, 1993); 5) The Boston Naming Test (BNT) used to detect difficulties in word retrieval (Kaplan et al., 1983); 6) Woodcock Johnson Tests of Achievement, 3rd Edition (WJTA) for Reading Comprehension (Woodcock et al., 2000); 7) California Verbal Learning Test (CVLT) used to determine verbal memory capacity (Delis et al., 1987). Handedness was tested using Edinburgh Handedness Inventory (Oldfield, 1971). Anyone with an IQ less than 85 or higher than 145 was excluded from the study. The group comparisons of the demographic and medical characteristics were shown in Table 1.
Table 1. Subject characteristics analyzed by one-way ANOVA.
| Controls (n = 48) | High-risk (n = 21) |
Schizophrenia (n = 20) |
d.f. | P | |
|---|---|---|---|---|---|
| Age | 22.0±5.1 | 21.1±5.5 | 37.7±10.3 | 2 | 0.000 |
| (range) | (16-32) | (16-30) | (20-55) | ||
| Male/Female (Chi-sq) | 24/24 | 7/14 | 13/7 | 2 | 0.176 |
| Left/Right Handed | 3/45 | 3/18 | 2/18 | -- | -- |
| Education(years) | 14.8±3.0 | 12.6±2.75 | 14.5±2.20 | 2 | 0.634 |
| Mother's Education | 13.8±3.5 | 14.5±2.5 | 12.5±2.20 | 2 | 0.695 |
| Father's Education | 15.1±2.05 | 15.0±2.225 | 14.5±3.25 | 2 | 0.942 |
| WAIS-VCI | 113.2±17.4 | 108.07±14.6 | 105.53±14.3 | 2 | 0.88 |
| PPVT-III | 102.5±12.9 | 101.3±12.2 | 102.5±16.6 | 2 | 0.87 |
| WRAT | 104.1±13.1 | 105.9±9.1 | 106.6±11.9 | 2 | 0.63 |
| WJTA | 102.4±14.2 | 104.5±11.1 | 103.5±13.3 | 2 | 0.67 |
| BNT | 103.6±15.7 | 103.1±16.6 | 101.5±12.1 | 2 | 0.71 |
| CVLT | 104.66±12.9 | 103.9±12.5 | 105.7±18.7 | 2 | 0.76 |
This study received Institutional Review Board Approval for human subjects' research at the Nathan S. Kline Institute for Psychiatric Research, a New York State Institution, and at New York University School of Medicine, where this study was performed. Written informed consents were provided by all participants after being carefully explained the nature of the study and its procedures.
2.2. Imaging acquisition protocol
Magnetic resonance brain images were acquired on a 1.5T Siemens Vision scanner (Erlangen Germany). The high resolution 3D T1-weighted magnetization prepared rapid gradient echo (MPRAGE) sequence was performed with the following parameters: TR=11.6 s; TE=4.9 ms; flip angle=15°; FOV=256×256×307 mm3; voxel size=1.0×1.2×1.2. Besides the T1-weighted structural data, we also acquired T2-weighted FLAIR and field map data for possible spatial corrections.
2.3. Imaging pre-processing
All the image files were first converted from DICOM IMA format to NIfTI format. The tool to3d from AFNI (http://afni.nimh.nih.gov/afni) was first used to assemble the data into AFNI-native format. Then the tool 3dAFNItoNIFTI was used to convert the data from AFNI to NIfTI format.
T1-weighted images were subsequently analyzed for cortical area and thickness using the Freesurfer v. 4.5 software package (http://surfer.nmr.mgh.harvard.edu/), and analyzed for the GM morphometry using Statistical Parametric Mapping Voxel-Based Morphometry 8 tool (SPM-VBM8) (http://www.fil.ion.ucl.ac.uk/spm/software/spm8/). Before we run the Freesurfer and VBM analyses, we had compared the segmentation results from the T1-weighted data and FLAIR data of the same individual considering the importance of segmentation quality for the cortical thickness and GM morphometry analyses. The segmentation results of both modalities from 15 randomly selected subjects did not show significant differences by voxel-based analysis. Thus during the follow-on analyses, we used T1-weighted data for segmentation.
2.4. Cortical surface reconstruction in individuals
Each NIfTI image was reconstructed into a three-dimensional cortical model for area and thickness measurements using Freesurfer v.4.5. Each volume was first registered with the Talairach atlas using an affine registration method. The second step was to correct intensity variations caused by magnetic field inhomogeneities, and remove non-brain tissue. Then a cutting plane was used to separate the left and right hemispheres and to remove the cerebellum and brain stem. An initial surface was generated for each hemisphere by tiling the outside of the white matter mass for that hemisphere. This initial surface was then refined to follow the intensity gradients between the white and gray matter. This surface was then nudged to follow the intensity gradients between the gray matter and CSF (this is the pial surface). Then triangular tessellation was used to produce a parametric representation of gray/white interface and then to automate the topological correction (Dale et al., 1999; Fischl et al., 1999b). The gray-white matter border surface was inflated into a sphere, then the folding pattern of each individual brain was aligned with an average folding pattern, and thus a uniform coordinate system was established. The establishment of uniform system allowed for surface based averages across subjects (Fischl et al., 1999a). Finally, surface-based labeling was used to segment the left and right hemisphere into sub-regions. Every step of cortical thickness was done using the recommended standard parameters.
Cortical thickness was measured by finding the closest white mater surface point to the given pial surface point and vice versa, and these two values were averaged (Fischl and Dale, 2000). Cortical thickness measurements were validated by histological and by manual measurements (Kuperberg et al., 2003b; Rosas et al., 2002).
2.5. Cortical thickness and laterality in language-related brain structures
Freesurfer provides the regional cortical thickness and area information based on the Destrieux atlas, which labels the human brain into 74 regions per hemisphere (Destrieux et al., 2010; Fischl et al.). To study the cortical thickness and laterality of the language-related brain regions in each group, we selected 7 regions per hemisphere from the 74 ones, and provided the Brodmann's area information of these regions. These 14 Regions of Interest (ROIs) were bilateral inferior orbital frontal gyri (Brodmann's Area (BA) 45), bilateral middle frontal gyri (BA 46), bilateral inferior opercular frontal gyri (BA 44), bilateral inferior parietal gyri (BA 40), bilateral angular gyri (BA 39), bilateral superior temporal gyri (BA 22), and bilateral occipital cortex (BA 17-19). The selected regions have been reported to be the core areas in the visual and auditory based language processing circuits (Li et al., 2009). Laterality Indices (LI) of cortical thickness from each pair of bilateral region were calculated by using LI=(Left-Right)/(Left+Right).
2.6. VBM analysis in individuals
Voxel-based morphometry (VBM) was used to examine gray matter volume density differences between groups. VBM data analysis was performed using the latest version of the Statistical Parametric Mapping software package (SPM8) running under the MATLAB 7.10.0 (R2010a) platform. T1-weighted images were oriented to a standard MNI (Montreal Neurological Institute) template and then spatially normalized using high-dimensional DARTEL (Diffeomorphic Anatomical Registration Through Exponentiated Lie algebra) normalization (Ashburner, 2007). The DARTEL normalization warping process increases registration between individuals, improving localization and increasing sensitivity in statistical analyses. Remaining non-brain tissue was removed by selecting the “clean up any partitions” option in the VBM toolbox. The ORNML filter was set to 0.7, and relative differences in regional gray matter volume corrected for individual brain size were analyzed using the “modulated normalized-nonlinear only” option during the segmentation process into gray matter (GM), white matter (WM), and cerebrospinal fluid (CSF) tissues. A bias corrected image volume and a partial volume effect (PVE) label image were used to remove noise. Covariance matrices were created to check the quality of the data procession before applying an 8mm FWHM Gaussian smoothing kernel to further eliminate inhomogeneities in the data. Explicit masks for both WM and GM were created.
2.7. Group statistical analyses
One-way analysis of variance (ANOVA) and post hoc t tests were performed to determine any demographic, clinical, or language-related cognitive differences between groups.
A repeated-measures General Linear Model (GLM) was used for group comparisons of the whole brain and ROI-based cortical thickness, area, and LI measures. Age, gender, and handedness impacts were corrected by adding these measures as covariates. False Discovery Rate of p<0.05 was used. Cortical thickness values were contrasted using a surface-based general linear model.
To test whether handedness would significantly impact the structural brain patterns, we performed the GLM group comparisons of the cortical thickness LI measures in the three groups by excluding the left-handed subjects in each group. Age and gender impacts were corrected by adding these measures as covariates. False Discovery Rate of p<0.05 was used.
Analysis of covariance (ANCOVA) was used to compare the GM morphometry results in the normal control, high-risk, and patient groups. Age, gender, and handedness impacts were corrected by adding these measures as covariates. False discovery rate (FDR) was set at p<0.05.
3. Results
3.1. Group comparisons in demographic, clinical, and language-related cognitive measures
Table 1 showed the results of the group comparisons in demographic, clinical and language-related cognitive measures. No group demographic differences were found, with the exception of age (the patients were significantly older than the relatives and controls). There were no group differences for measurements in the language-related battery.
3.2. Group comparisons in cortical thickness, area, and brain laterality
Visual demonstrations of the group comparisons of the whole brain cortical thickness were shown in Figures 1 and 2, by mapping to an inflated average brain and an average white matter surface respectively. A 10-mm Gaussian filter was used for smoothing the displayed images. Results of the whole brain comparisons of cortical thickness and area in controls, high-risk people and schizophrenia patients were summarized in Table 2. From the comparisons, schizophrenia patients showed significant global decreases of cortical thickness and area compared to normal controls and the high-risk people. However, scattered regional increase of cortical surface area were shown in left side superior temporal gyrus and right side inferior frontal and occipital regions in schizophrenia patients. Interestingly, comparisons in high-risk vs. controls showed significant regional increases of cortical thickness and area in frontal, temporal, parietal and occipital lobe in the high-risk people, except the significant decreased cortical area in right inferior frontal gyrus.
Figure 1.
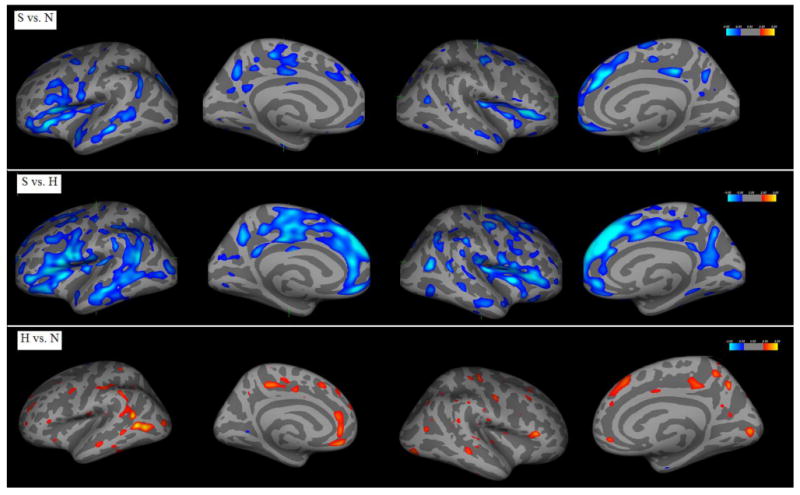
Group comparisons of whole brain cortical thickness mapped to an inflated average brain.
Figure 2.
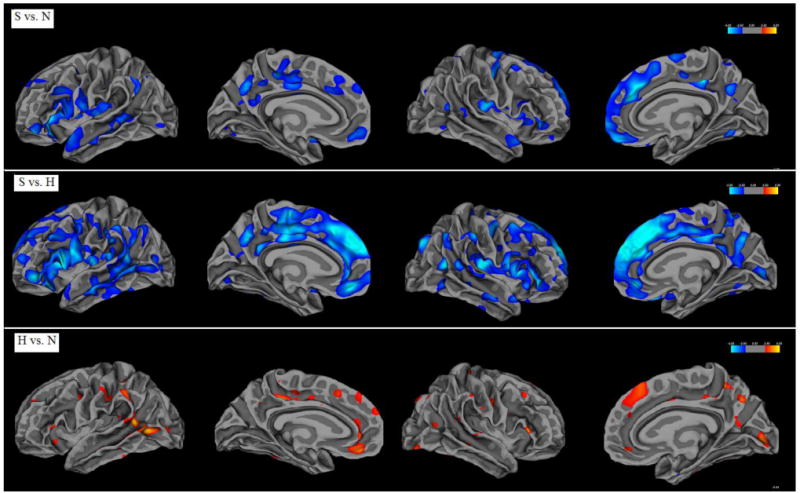
Group comparisons of whole brain cortical thickness mapped to an average white matter surface.
Table 2. whole brain comparisons of cortical thickness and area in controls, high-risk people and schizophrenia patients.
| Left hemisphere | Cortical Thickness | Cortical Surface Area |
|---|---|---|
| S vs. N | Significant decrease in large amount of regions of frontal and temporal lobe, and some occipital and parietal lobe in S | Significant decrease in some regions of parietal lobe and slight increases in temporal lobe in S |
| S vs. H | Significant decrease in frontal and temporal lobe, and some in parietal lobe in S | Slight decrease in frontal and parietal lobe in S |
| H vs. N | Regional increase in temporal-occipital, frontal and parietal lobe in H | Slight increase in parietal lobe in H |
| Right hemisphere | Cortical Thickness | Cortical Surface Area |
| S vs. N | Mostly frontal reduction with some temporal and parietal reduction in S | Slight parietal reduction and slight increase in frontal and occipital lobe in S |
| S vs. H | Mostly frontal and temporal reduction with some parietal reduction in S | Slight, scattered frontal, parietal reduction and slight increase in frontal lobe in S |
| H vs. N | Slight, scattered increase in frontal, temporal, occipital and parietal regions in H | Slight reduction in frontal lobe and slight increase in parietal lobe in H |
S=schizophrenia patients; H=high-risk people; N=normal controls
Comparisons of the quantities of regional cortical thickness in the 14 bilateral ROIs in the anatomical pathway for language-processing in the three diagnostic groups showed significant group differences (overall p=0.003). Results of the post hoc analyses were shown in Table 3. From Table 3, we see significantly reduced cortical thickness in most of the ROIs in schizophrenia patients compared to the high-risk subjects and normal controls. However, the cortical thickness in left inferior parietal gyrus (left BA 40) in schizophrenia patients was significantly increased compared to the high-risk subjects and normal controls. Compared to normal controls, the high-risk subjects showed significantly increased quantities of cortical thickness in bilateral inferior orbital and middle frontal gyri (bilateral BA 45, 46), right side inferior parietal, angular, and superior temporal gyri (right BA 39, 40, 22).
Table 3. Group comparisons of the quantities of regional cortical thickness in the anatomical regions in language-processing pathway.
| Brain region | BA | Cortical thickness (mm) (Mean ± SD) | Statistical values | ||||
|---|---|---|---|---|---|---|---|
| S | H | N | F | p | p for Post-hoc t tests | ||
| L_ inferior orbital frontal gyrus | 45 | 2.44±0.27 | 3.00±0.19 | 2.84±0.21 | 35.11 | <0 .001 | S<H (<0.001); S<N (<0.001); H>N(=0.011) |
| R_inferior orbital frontal gyrus | 2.67±0.28 | 2.95±0.26 | 2.87±0.28 | 7.846 | 0.001 | S<H (<0.001); S<N (=0.009); H>N(=0.049) |
|
| L_middle frontal gyrus | 46 | 2.61±0.19 | 2.82±0.17 | 2.71±0.23 | 5.569 | 0.005 | S<H(=0.001); H>N(=0.036) |
| R_middle frontal gyrus | 2.65±0.21 | 2.95±0.21 | 2.75±0.24 | 5.845 | 0.004 | S<H(=0.001); H>N(=0.021) |
|
| L_inferior opercular frontal gyrus | 44 | 2.56±0.23 | 2.89±0.21 | 2.80±0.26 | 10.154 | < 0.001 | S<H(<0.001); S<N(<0.001) |
| R_ inferior opercular frontal gyrus | 2.64±0.26 | 2.94±0.23 | 2.86±0.28 | 8.487 | <0.001 | S<H(<0.001); S<N(=0.003) |
|
| L_inferior parietal gyrus | 40 | 3.24±0.33 | 2.79±0.16 | 2.72±0.26 | 29.87 | <0 .001 | S>H(<0.001); S>N(<0.001) |
| R_ inferior parietal gyrus | 2.65±0.22 | 2.89±0.23 | 2.74±0.21 | 7.242 | 0.001 | S<H(<0.001); H>N(=0.006) |
|
| L_angular gyrus | 39 | 2.57±0.25 | 2.80±0.19 | 2.72±0.22 | 5.582 | 0.005 | S<H(=0.002); S<N(<0.014) |
| R_angular gyrus | 2.68±0.25 | 3.03±0.23 | 2.75±0.21 | 4.135 | 0.019 | S<H(<0.006); H>N(=0.038) |
|
| L_superior temporal gyrus | 22 | 2.60±0.20 | 2.83±0.14 | 2.76±0.20 | 8.709 | < 0.001 | S<H(<0.001); S<N(=0.002) |
| R_ superior temporal gyrus | 2.36±0.15 | 2.72±0.13 | 2.45±0.13 | 6.193 | 0.003 | S<H (=0.001); S<N (=0.03); H>N(=0.047) |
|
| L_occipital cortex | 17-19 | 2.08±0.14 | 2.08±0.09 | 2.05±0.11 | .941 | 0.394 | |
| R_occipital cortex | 2.03±0.13 | 2.05±0.08 | 2.09±0.10 | 4.792 | 0.011 | S<H(=0.003); S<N(=0.028) |
|
BA=Brodmann's Area; S=schizophrenia patients; H=high-risk people; N=normal controls
Group comparisons of the quantities of regional cortical surface areas in the 14 bilateral ROIs showed that schizophrenia patients had significantly reduced cortical surface area in left angular gyrus (left BA 39) compared to the normal controls (p=0.037). No significant differences were reported between the high-risk and control groups. Group comparisons of the LIs of regional cortical surface areas reported no group differences.
Group comparisons of the LIs of regional cortical thickness in the 14 bilateral ROIs of the three diagnostic groups showed significant group differences (overall p=0.000). Results of the post hoc analyses were shown in Table 4. From Table 4, schizophrenia patients showed significantly reduced cortical thickness laterality in inferior orbital frontal lobe, and significantly increased cortical thickness laterality in inferior parietal and occipital lobes, compared to both the high-risk subjects and normal controls. Although no significant group differences of LIs were shown between the high-risk subjects and controls, the high-risk people have trend of reduced LIs in the inferior orbital frontal and occipital lobe, compared to controls.
Table 4. Group comparisons of Laterality Indices of cortical thickness in the anatomical regions in language-processing pathway.
| Brain region | BA | Thickness laterality (Mean ± SD) | Statistical value | ||||
|---|---|---|---|---|---|---|---|
| S | H | N | F | p | p for Post-hoc t tests | ||
| inferior orbital frontal gyri | 45 | 0.05±0.04 | 0.01±0.03 | 0.00±0.03 | 11.55 | < 0.001 | S<H (<0.001); S<N (<0.001) |
| middle frontal gyri | 46 | 0.01±0.02 | 0.01±0.02 | 0.01±0.02 | 0.238 | 0.789 | |
| Inferior opercular frontal gyri | 44 | 0.01±0.03 | 0.02±0.03 | 0.01±0.04 | 0.232 | 0.794 | |
| inferior parietal gyri | 40 | 0.10±0.04 | 0.02±0.03 | 0.01±0.04 | 56.33 | <0.001 | S>H (<0.001); S>N (<0.001) |
| angular gyri | 39 | 0.02±0.03 | 0.01±0.03 | 0.01±0.03 | 1.737 | 0.182 | |
| superior temporal gyri | 22 | 0.02±0.02 | 0.01±0.02 | 0.00±0.02 | 2.546 | 0.084 | |
| occipital cortex | 17-19 | 0.01±0.02 | 0.00±0.02 | 0.01±0.02 | 17.08 | <0.001 | S>N(<0.001); H>N(<0.001) |
BA=Brodmann's Area; S=schizophrenia patients; H=high-risk people; N=normal controls
After excluding all the left-handed participants, the comparisons of the cortical thickness LIs in the 14 bilateral ROIs still showed significant group differences (overall p=0.000). Results of the post hoc analyses showed that schizophrenia patients had significantly reduced cortical thickness laterality in inferior orbital frontal lobe, and significantly increased cortical thickness laterality in inferior parietal and occipital lobes, compared to both the high-risk subjects and normal controls. These results confirmed that the inclusion of the a few left-handed subjects in each group did not affect the results of statistical comparisons in the language-related brain structures.
3.3. Group comparisons in gray matter morphometry
VBM group comparisons of the GM density are shown in Figures 3. Schizophrenia patients showed significant global decrease in GM density compared to the high-risk subjects and controls. Three clusters of significantly increased GM density were shown in the high-risk people, compared with controls, and are located in right superior medial frontal gyrus (4, 48, 45 in standard MNI space), left thalamus (-6, -15, 1), and left caudate (-14, 3, 18).
Figure 3.
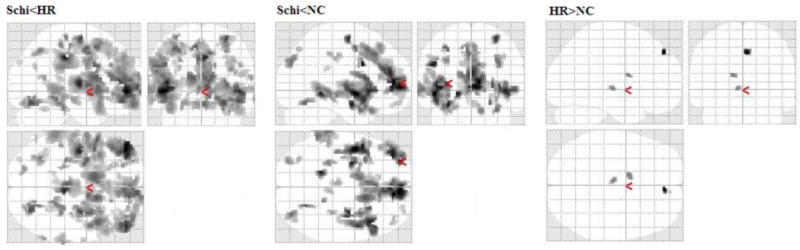
Group comparisons of whole brain GM densities in the three groups.
4. Discussion
The present MRI study examined the voxel-based whole brain cortical thickness, GM surface area, GM volume density, and that in 14 anatomical regions associated with language-processing, in patients with chronic schizophrenia, genetic high-risk people who were still within the age of risk for developing the illness, and in controls with no family history of schizophrenia. It has been well documented that neurons within the cerebral cortex are organized into ontogenetic columns that run perpendicular to the surface of the brain (Mountcastle, 1997). A radial unit hypothesis postulated that the size of the cortical surface area is driven by the number of columns, whereas cortical thickness is influenced by the number of cells within a column (Rakic, 1988). Several recent studies suggested that cortical surface area and thickness are distinct rather than redundant features of cortical structure (Im et al., 2008; Pontious et al., 2008). Although MR-based cortical thickness and surface area are not equivalent to the real anatomical ones, these efficient in vivo measures can provide us useful information about the brain anatomical structures.
Results of the present study showed widespread significant reductions of cortical thickness, cortical volume density, and scattered decrease of cortical surface area in chronic schizophrenia patients, compared to controls and the high-risk subjects. These findings were consistent with existed results reported in previous studies (Jayakumar et al., 2005; Fornito et al., 2008; Glahn et al., 2008; Venkatasubramanian et al., 2008; Chan et al., 2011). Among these global anatomical deficits in schizophrenia patients, cortical thickness of 13 ROIs in the anatomical pathway for visual language-processing were significantly reduced, except that in left inferior parietal gyrus. Analysis of cortical thickness laterality in these language-related anatomical regions showed significantly reduced left-greater-than-right laterality in inferior orbital frontal, and significantly increased left-greater-than-right laterality in inferior parietal lobe and occipital lobe. Our previous fMRI studies have found that schizophrenia patients had significantly increased regional brain activation in bilateral inferior parietal and superior occipital lobe (bilateral BA 19, 40), left side superior temporal gyrus (left BA 22), right side inferior frontal gyrus (right BA 44, 45), and significantly reduced left-greater-than-right laterality of functional activation in inferior frontal gyri (Li et al., 2007a; Li et al., 2007b). The findings of the present study suggest that the significantly reduced cortical thickness in the anatomical regions for visual language-processing pathway may contribute to the language-related functional abnormality in schizophrenia. Among these abnormal regional literalities, increased laterality in occipital area was replicated in the high-risk cohort. Bilateral occipital areas are important regions for visual processing. This result suggests that the abnormal anatomical laterality in the primary visual cortex may reflect the early development of onset of the illness.
The results of this study also showed that compared to the normal controls, the genetic high-risk subjects showed increased regional cortical thickness in 7 of the 14 ROIs in the language-processing pathway, and increased GM volume density in scattered regions located in right superior medial frontal gyrus, left thalamus, and left caudate. These involved anatomical regions are functionally associated with language-processing, thought, and emotions (Whitford et al., 2007). Previous studies also reported similar findings in the young high-risk subjects, such as increase of surface area in bilateral parahippocampal gyri (associated with emotion), and left middle temporal lobe (associated with reading and speech) (Goghari et al., 2007a); reversed hemispheric asymmetry in cingulate sulcal thickness (associated with emotion) (Goghari et al., 2007b); significantly increased right amygdala volume (associated with emotion) (Welch et al., 2010); significantly increased right prefrontal cortical folding (associated with speech and thought) (Stanfield et al., 2008), compared with controls. These findings together suggest that the early abnormalities of the cortical neuron development in these cortical regions in both the number of columns (related to cortical surface area) and the number of cells within a column (related to cortical thickness) may contribute to the origins of the associated cognitive dysfunctions and psychotic symptoms, such as language impairment, thought and emotion.
Laterality analyses showed that the spatial distribution of abnormal cortical thickness in the schizophrenia patients as well as in the high-risk subjects, contribute to a decrease of the normal left-greater-than-right anatomical asymmetry in inferior orbital frontal area, and a increased left-greater-than-right pattern in the inferior parietal and occipital regions. Although any model relating the neurobiological abnormalities observed in research studies of schizophrenia to its clinical pathology and genetic determinants has not yet been established and validated, Crow and colleagues have postulated that altered cerebral asymmetry is an underlying and necessary component for the expression of schizophrenia (Mitchell and Crow, 2005). A recent fMRI study found that lateralization of brain activation during language processing was correlated with the severity of auditory hallucinations (Sommer et al., 2008). Another two studies reported loss of functional brain laterality during language processing in first-episode schizophrenia patients compared to controls (Bleich-Cohen et al., 2009; van Veelen et al., 2011). Together with existing findings, the results of the present study suggest that developmental disruption of the anatomical differentiation of the hemispheres provides a basis for understanding the symptoms of psychosis. Abnormal left-right hemispherical communications may interrupt the normal flow of information processing, thus leading to misperceptions of what is heard and perceived during social interactions.
There are, however, some limitations to the present study. The sample included both male and female subjects. However, a meta-analysis reported no significant difference in language lateralization between men and women (Sommer et al., 2004). In addition, a few left-handed subjects were in each group. However, this is unlikely to affect our results, as the majority of right-handed people have left brain language dominant, whereas left-handed people have 85% left hemispheric dominant, 15% bilaterally dominant, and rarely right side dominant (Thilers et al., 2007). From our pilot whole brain activation and ROI-based fMRI studies, we did not see altered language laterality in the left-handed individuals (Li et at., 2007a and 2007b). In the present study, we tested the handedness impact on the group comparisons of the cortical thickness patterns in the language-related brain structures, by comparing the group comparison results of the regional LIs with and without including the left-handed subjects. Third, the schizophrenia patients were significantly elder than the high-risk subjects and normal controls. Considering these limitations, we have added age, handedness and sex as the covariates in our analyses.
Acknowledgments
This project was partially supported by a grant from NIMH, R21 MH071720.
Footnotes
Publisher's Disclaimer: This is a PDF file of an unedited manuscript that has been accepted for publication. As a service to our customers we are providing this early version of the manuscript. The manuscript will undergo copyediting, typesetting, and review of the resulting proof before it is published in its final citable form. Please note that during the production process errors may be discovered which could affect the content, and all legal disclaimers that apply to the journal pertain.
References
- Ashburner J. A fast diffeomorphic image registration algorithm. Neuroimage. 2007;38:95–113. doi: 10.1016/j.neuroimage.2007.07.007. [DOI] [PubMed] [Google Scholar]
- Bleich-Cohen M, Hendler T, Kotler M, Strous RD. Reduced language lateralization in first-episode schizophrenia: an fMRI index of functional asymmetry. Psychiatry Research: Neuroimaging. 2009;171(2):82–93. doi: 10.1016/j.pscychresns.2008.03.002. [DOI] [PubMed] [Google Scholar]
- Chan RC, Di X, McAlonan GM, Gong QY. Brain anatomical abnormalities in high-risk individuals, first-episode, and chronic schizophrenia: an activation likelihood estimation meta-analysis of illness progression. Schizophrenia Bulletin. 2011;37(1):177–188. doi: 10.1093/schbul/sbp073. [DOI] [PMC free article] [PubMed] [Google Scholar]
- Dale AM, Fischl B, Sereno MI. Cortical surface-based analysis. I. Segmentation and surface reconstruction. Neuroimage. 1999;9:179–194. doi: 10.1006/nimg.1998.0395. [DOI] [PubMed] [Google Scholar]
- Delis DC, Kramer JH, Kaplan DT, Ober BA. California Verbal Learning Test, Research Edition. The Psychological Corporation; San Antonio, TX: 1987. [Google Scholar]
- DeLisi LE. The significance of age of onset for schizophrenia. Schizophrenia Bulletin. 1992;18:209–215. doi: 10.1093/schbul/18.2.209. [DOI] [PubMed] [Google Scholar]
- DeLisi LE, Shaw SH, Crow TJ, Shields G, Smith AB, Larach VW, Wellman N, Loftus J, Nanthakumar B, Razi K, Stewart J, Comazzi M, Vita A, Heffner T, Sherrington R. A genome-wide scan for linkage to chromosomal regions in 382 sibling pairs with schizophrenia or schizoaffective disorder. American Journal of Psychiatry. 2002;159:803–812. doi: 10.1176/appi.ajp.159.5.803. [DOI] [PubMed] [Google Scholar]
- Destrieux C, Fischl B, Dale A, Halgren E. Automatic parcellation of human cortical gyri and sulci using standard anatomical nomenclature. Neuroimage. 2010;53(1):1–15. doi: 10.1016/j.neuroimage.2010.06.010. [DOI] [PMC free article] [PubMed] [Google Scholar]
- Dunn M, Dunn M. Peabody Picture Vocabulary Test. 3rd. American Guidance Service; Circle Pines, MN: 1997. [Google Scholar]
- Ellison-Wright I, Glahn DC, Laird AR, Thelen SM, Bullmore E. The anatomy of first-episode and chronic schizophrenia: an anatomical likelihood estimation meta-analysis. American Journal of Psychiatry. 2008;165:1015–1023. doi: 10.1176/appi.ajp.2008.07101562. [DOI] [PMC free article] [PubMed] [Google Scholar]
- Fischl B, Dale AM. Measuring the thickness of the human cerebral cortex from magnetic resonance images. Proceedings of the National Academy of Sciences of the United States of America. 2000;97:11050–11055. doi: 10.1073/pnas.200033797. [DOI] [PMC free article] [PubMed] [Google Scholar]
- Fischl B, Sereno MI, Dale AM. Cortical surface-based analysis. II: Inflation, flattening, and a surface-based coordinate system. Neuroimage. 1999a;9:195–207. doi: 10.1006/nimg.1998.0396. [DOI] [PubMed] [Google Scholar]
- Fischl B, Sereno MI, Tootell RB, Dale AM. High-resolution intersubject averaging and a coordinate system for the cortical surface. Human Brain Mapping. 1999b;8:272–284. doi: 10.1002/(SICI)1097-0193(1999)8:4<272::AID-HBM10>3.0.CO;2-4. [DOI] [PMC free article] [PubMed] [Google Scholar]
- Fischl B, van der Kouwe A, Destrieux C, Halgren E, Segonne F, Salat DH, Busa E, Seidman LJ, Goldstein J, Kennedy D, Caviness V, Makris N, Rosen B, Dale AM. Automatically parcellating the human cerebral cortex. Cerebral Cortex. 2004;14(1):11–22. doi: 10.1093/cercor/bhg087. [DOI] [PubMed] [Google Scholar]
- Fornito A, Yucel M, Wood SJ, Adamson C, Velakoulis D, Saling MM, McGorry PD, Pantelis C. Surface-based morphometry of the anterior cingulate cortex in first episode schizophrenia. Human Brain Mapping. 2008;29:478–489. doi: 10.1002/hbm.20412. [DOI] [PMC free article] [PubMed] [Google Scholar]
- Glahn DC, Laird AR, Ellison-Wright I, Thelen SM, Robinson JL, Lancaster JL, Bullmore E, Fox PT. Meta-analysis of gray matter anomalies in schizophrenia: application of anatomic likelihood estimation and network analysis. Biological Psychiatry. 2008;64(9):774–781. doi: 10.1016/j.biopsych.2008.03.031. [DOI] [PMC free article] [PubMed] [Google Scholar]
- Goghari VM, Rehm K, Carter CS, MacDonald AW., III Regionally specific cortical thinning and gray matter abnormalities in the healthy relatives of schizophrenia patients. Cerebral Cortex. 2007a;17:415–424. doi: 10.1093/cercor/bhj158. [DOI] [PubMed] [Google Scholar]
- Goghari VM, Rehm K, Carter CS, MacDonald AW. Sulcal thickness as a vulnerability indicator for schizophrenia. British Journal of Psychiatry. 2007b;191:229–233. doi: 10.1192/bjp.bp.106.034595. [DOI] [PubMed] [Google Scholar]
- Goldman AL, Pezawas L, Mattay VS, Fischl B, Verchinski BA, Chen Q, Weinberger DR, Meyer-Lindenberg A. Widespread reductions of cortical thickness in schizophrenia and spectrum disorders and evidence of heritability. Archives of General Psychiatry. 2009;66:467–477. doi: 10.1001/archgenpsychiatry.2009.24. [DOI] [PMC free article] [PubMed] [Google Scholar]
- Im K, Lee JM, Lyttelton O, Kim SH, Evans AC, Kim SI. Brain size and cortical structure in the adult human brain. Cerebral Cortex. 2008;18:2181–2191. doi: 10.1093/cercor/bhm244. [DOI] [PubMed] [Google Scholar]
- Jayakumar PN, Venkatasubramanian G, Gangadhar BN, Janakiramaiah N, Keshavan MS. Optimized voxel-based morphometry of gray matter volume in first-episode, antipsychotic-naive schizophrenia. Progress in Neuropsychopharmacology and Biological Psychiatry. 2005;29:587–591. doi: 10.1016/j.pnpbp.2005.01.020. [DOI] [PubMed] [Google Scholar]
- Job DE, Whalley HC, McConnell S, Glabus M, Johnstone EC, Lawrie SM. Voxel-based morphometry of grey matter densities in subjects at high risk of schizophrenia. SchizophreniaResearch. 2003;64:1–13. doi: 10.1016/s0920-9964(03)00158-0. [DOI] [PubMed] [Google Scholar]
- Kaplan EL, Goodglass H, Weintraub S. Boston Naming Test. Second. The Psychological Corporation; San Antonio, TX: 1983. [Google Scholar]
- Kubicki M, McCarley RW, Shenton ME. Evidence for white matter abnormalities in schizophrenia. Current Opinion in Psychiatry. 2005;18:121–134. doi: 10.1097/00001504-200503000-00004. [DOI] [PMC free article] [PubMed] [Google Scholar]
- Kubicki M, Shenton ME, Salisbury DF, Hirayasu Y, Kasai K, Kikinis R, Jolesz FA, McCarley RW. Voxel-based morphometric analysis of gray matter in first episode schizophrenia. Neuroimage. 2002;17:1711–1719. doi: 10.1006/nimg.2002.1296. [DOI] [PMC free article] [PubMed] [Google Scholar]
- Kuperberg GR, Broome MR, McGuire PK, David AS, Eddy M, Ozawa F, Goff D, West WC, Williams SC, van der Kouwe AJ, Salat DH, Dale AM, Fischl B. Regionally localized thinning of the cerebral cortex in schizophrenia. Archives of General Psychiatry. 2003a;60:878–888. doi: 10.1001/archpsyc.60.9.878. [DOI] [PubMed] [Google Scholar]
- Kuperberg GR, Broome MR, McGuire PK, David AS, Eddy M, Ozawa F, Goff D, West WC, Williams SC, van der Kouwe AJ, Salat DH, Dale AM, Fischl B. Regionally localized thinning of the cerebral cortex in schizophrenia. Archives of General Psychiatry. 2003b;60:878–888. doi: 10.1001/archpsyc.60.9.878. [DOI] [PubMed] [Google Scholar]
- Li X, Branch C, DeLisi L. Language pathway abnormalities in schizophrenia: a review of fMRI and other imaging studies. Current Opinion in Psychiatry. 2009;22:131–139. doi: 10.1097/YCO.0b013e328324bc43. [DOI] [PubMed] [Google Scholar]
- Li X, Branch CA, Ardekani BA, Bertisch H, Hicks C, DeLisi LE. fMRI study of language activation in schizophrenia, schizoaffective disorder and in individuals genetically at high risk. Schizophrenia Research. 2007a;96:14–24. doi: 10.1016/j.schres.2007.07.013. [DOI] [PMC free article] [PubMed] [Google Scholar]
- Li X, Branch CA, Bertisch HC, Brown K, Szulc KU, Ardekani BA, DeLisi LE. An fMRI study of language processing in people at high genetic risk for schizophrenia. Schizophrenia Research. 2007b;91:62–72. doi: 10.1016/j.schres.2006.12.016. [DOI] [PMC free article] [PubMed] [Google Scholar]
- Li X, Branch CA, Nierenberg J, DeLisi LE. Disturbed functional connectivity of cortical activation during semantic discrimination in patients with schizophrenia and subjects at genetic high-risk. Brain Imaging and Behavior. 2010;4:109–120. doi: 10.1007/s11682-010-9090-3. [DOI] [PubMed] [Google Scholar]
- Mitchell RL, Crow TJ. Right hemisphere language functions and schizophrenia: the forgotten hemisphere? Brain. 2005;128:963–978. doi: 10.1093/brain/awh466. [DOI] [PubMed] [Google Scholar]
- Mountcastle VB. The columnar organization of the neocortex. Brain. 1997;120(Pt 4):701–722. doi: 10.1093/brain/120.4.701. [DOI] [PubMed] [Google Scholar]
- Nesvag R, Lawyer G, Varnas K, Fjell AM, Walhovd KB, Frigessi A, Jonsson EG, Agartz I. Regional thinning of the cerebral cortex in schizophrenia: effects of diagnosis, age and antipsychotic medication. Schizophrenia Research. 2008;98:16–28. doi: 10.1016/j.schres.2007.09.015. [DOI] [PubMed] [Google Scholar]
- Nurnberger JI, Jr, Blehar MC, Kaufmann CA, York-Cooler C, Simpson SG, Harkavy-Friedman J, Severe JB, Malaspina D, Reich T. Diagnostic Interview for Genetic Studies. Rationale, unique features, and training. NIMH Genetics Initiative. Archives of General Psychiatry. 1994;51:849–859. doi: 10.1001/archpsyc.1994.03950110009002. discussion 863-864. [DOI] [PubMed] [Google Scholar]
- Oldfield RC. The Assessment and Analysis of Handedness: The Edinburgh Inventory. 9. Pergamon Press; Oxford: 1971. pp. 97–113. [DOI] [PubMed] [Google Scholar]
- Pontious A, Kowalczyk T, Englund C, Hevner RF. Role of intermediate progenitor cells in cerebral cortex development. Developmental Neuroscience. 2008;30:24–32. doi: 10.1159/000109848. [DOI] [PubMed] [Google Scholar]
- Rakic P. Specification of cerebral cortical areas. Science. 1988;241:170–176. doi: 10.1126/science.3291116. [DOI] [PubMed] [Google Scholar]
- Rosas HD, Liu AK, Hersch S, Glessner M, Ferrante RJ, Salat DH, van der Kouwe A, Jenkins BG, Dale AM, Fischl B. Regional and progressive thinning of the cortical ribbon in Huntington's disease. Neurology. 2002;58:695–701. doi: 10.1212/wnl.58.5.695. [DOI] [PubMed] [Google Scholar]
- Rosso IM, Makris N, Thermenos HW, Hodge SM, Brown A, Kennedy D, Caviness VS, Faraone SV, Tsuang MT, Seidman LJ. Regional prefrontal cortex gray matter volumes in youth at familial risk for schizophrenia from the Harvard Adolescent High Risk Study. Schizophrenia Researc. 2010;123:15–21. doi: 10.1016/j.schres.2010.06.015. [DOI] [PMC free article] [PubMed] [Google Scholar]
- Schultz CC, Koch K, Wagner G, Roebel M, Nenadic I, Schachtzabel C, Reichenbach JR, Sauer H, Schlosser RG. Complex pattern of cortical thinning in schizophrenia: results from an automated surface based analysis of cortical thickness. Psychiatry Research: Neuroimaging. 2010;182:134–140. doi: 10.1016/j.pscychresns.2010.01.008. [DOI] [PubMed] [Google Scholar]
- Seidman LJ, Pantelis C, Keshavan MS, Faraone SV, Goldstein JM, Horton NJ, Makris N, Falkai P, Caviness VS, Tsuang MT. A review and new report of medial temporal lobe dysfunction as a vulnerability indicator for schizophrenia: a magnetic resonance imaging morphometric family study of the parahippocampal gyrus. Schizophrenia Bulletin. 2003;29:803–830. doi: 10.1093/oxfordjournals.schbul.a007048. [DOI] [PubMed] [Google Scholar]
- Shenton ME, Whitford TJ, Kubicki M. Structural neuroimaging in schizophrenia: from methods to insights to treatments. Dialogues in Clinical Neuroscience. 2010;12:317–332. doi: 10.31887/DCNS.2010.12.3/mshenton. [DOI] [PMC free article] [PubMed] [Google Scholar]
- Sommer IE, Aleman A, Bouma A, Kahn RS. Do women really have more bilateral language representation than men? A meta-analysis of functional imaging studies. Brain. 2004;127:1845–1852. doi: 10.1093/brain/awh207. [DOI] [PubMed] [Google Scholar]
- Sommer IE, Diederen KM, Blom JD, Willems A, Kushan L, Slotema K, Boks MP, Daalman K, Hoek HW, Neggers SF, Kahn RS. Auditory verbal hallucinations predominantly activate the right inferior frontal area. Brain. 2008;131:3169–3177. doi: 10.1093/brain/awn251. [DOI] [PubMed] [Google Scholar]
- Staal WG, Hulshoff Pol HE, Schnack HG, Hoogendoorn ML, Jellema K, Kahn RS. Structural brain abnormalities in patients with schizophrenia and their healthy siblings. American Journal of Psychiatry. 2000;157:416–421. doi: 10.1176/appi.ajp.157.3.416. [DOI] [PubMed] [Google Scholar]
- Stanfield AC, Moorhead TW, Harris JM, Owens DG, Lawrie SM, Johnstone EC. Increased right prefrontal cortical folding in adolescents at risk of schizophrenia for cognitive reasons. Biological Psychiatry. 2008;63:80–85. doi: 10.1016/j.biopsych.2007.04.012. [DOI] [PubMed] [Google Scholar]
- Thilers PP, MacDonald SW, Herlitz A. Sex differences in cognition: the role of handedness. Physiology and Behaviour. 2007;92:105–109. doi: 10.1016/j.physbeh.2007.05.035. [DOI] [PubMed] [Google Scholar]
- van Veelen NM, Vink M, Ramsey NF, Sommer IE, van BM, Hoogendam JM, Kahn RS. Reduced language lateralization in first-episode medication-naive schizophrenia. Schizophrenia Research. 2011;127(1-3):195–201. doi: 10.1016/j.schres.2010.12.013. [DOI] [PubMed] [Google Scholar]
- Venkatasubramanian G, Jayakumar PN, Gangadhar BN, Keshavan MS. Automated MRI parcellation study of regional volume and thickness of prefrontal cortex (PFC) in antipsychotic-naive schizophrenia. Acta Psychiatrica Scandinavica. 2008;117:420–431. doi: 10.1111/j.1600-0447.2008.01198.x. [DOI] [PubMed] [Google Scholar]
- Wechsler D. Wechsler Adult Intelligence Scale. Third. The Psychological Corporation; San Antonio, TX: 1997. [Google Scholar]
- Wechsler D. Wechsler Adult Intelligence Scale. Third. The Psychological Corporation; San Antonio, TX: 2004. [Google Scholar]
- Welch KA, Stanfield AC, Moorhead TW, Haga K, Owens DC, Lawrie SM, Johnstone EC. Amygdala volume in a population with special educational needs at high risk of schizophrenia. Psychological Medicine. 2010;40:945–954. doi: 10.1017/S0033291709990870. [DOI] [PubMed] [Google Scholar]
- Whitford TJ, Rennie CJ, Grieve SM, Clark CR, Gordon E, Williams LM. Brain maturation in adolescence: Concurrent changes in neuroanatomy and neurophysiology. Human Brain Mapping. 2007;28:228–237. doi: 10.1002/hbm.20273. [DOI] [PMC free article] [PubMed] [Google Scholar]
- Wilkinson GS. The Wide Range Achievement Test. 3rd. Wide Range, Inc.; Wilmington, DE: 1993. [Google Scholar]
- Witthaus H, Mendes U, Brune M, Ozgurdal S, Bohner G, Gudlowski Y, Kalus P, Andreasen N, Heinz A, Klingebiel R, Juckel G. Hippocampal subdivision and amygdalar volumes in patients in an at-risk mental state for schizophrenia. Journal of Psychiatry and Neuroscience. 2010;35:33–40. doi: 10.1503/jpn.090013. [DOI] [PMC free article] [PubMed] [Google Scholar]
- Woodcock RW, McGrew KS, Mather N. Woodcock-Johnson. Third Editio. Riverside Publishing; Itasca, IL: 2000. [Google Scholar]