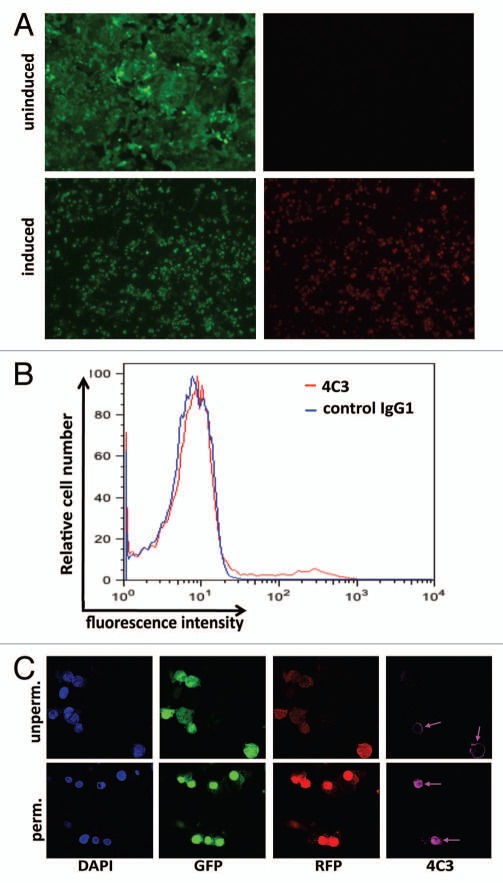
Figure 2.
Characterization of Vero-219 cells. (A) The four parts are photomicrographs of Vero-219 cells containing rKSHV.219 showing detection of GFP under both induced (with Back50 + sodium butyrate stimulation, 24 h, lower parts) and uninduced (upper parts) conditions. (B) Flow cytometry analysis of K8.1A on the cell surface of induced Vero-219 cells by anti K8.1A mAb 4C3 (compared with isotype control antibody) at 48 h post-induction. (C) Confocal microscopic analysis of the staining of induced Vero-219 cells at 48 h post induction under un-permeabilized (upper parts) and permeabilized (lower parts) conditions.

