

Abstract
Functional connectivity networks have become a central focus in neuroscience because they reveal key higher-dimensional features of normal and abnormal nervous system physiology. Functional networks reflect activity-based coupling between brain regions that may be constrained by relatively static anatomical connections, yet these networks appear to support tremendously dynamic behaviors. Within this growing field, the stability and temporal characteristics of functional connectivity brain networks have not been well characterized. We evaluated the temporal stability of spontaneous functional connectivity networks derived from multi-day scalp encephalogram (EEG) recordings in five healthy human subjects. Topological stability and graph characteristics of networks derived from averaged data epochs ranging from 1 s to multiple hours across different states of consciousness were compared. We show that, although functional networks are highly variable on the order of seconds, stable network templates emerge after as little as ∼100 s of recording and persist across different states and frequency bands (albeit with slightly different characteristics in different states and frequencies). Within these network templates, the most common edges are markedly consistent, constituting a network “core.” Although average network topologies persist across time, measures of global network connectivity, density and clustering coefficient, are state and frequency specific, with sparsest but most highly clustered networks seen during sleep and in the gamma frequency band. These findings support the notion that a core functional organization underlies spontaneous cortical processing and may provide a reference template on which unstable, transient, and rapidly adaptive long-range assemblies are overlaid in a frequency-dependent manner.
Introduction
An expanding focus in neuroscience has been on the complex functional interdependencies between widespread brain regions that underlie normal and abnormal cortical processing (Bullmore and Sporns, 2009; Wig et al., 2011). These relationships can be identified as temporally coordinated interregional activities using a variety of multivariate physiological recording techniques, including functional MRI (fMRI), magnetoencephalography, near-infrared spectroscopy, electrocorticography, and scalp electroencephalography (EEG) (Fox and Raichle, 2007; Bullmore and Sporns, 2009; Stam et al., 2009; Homae et al., 2010; Kramer et al., 2010). The resulting functional brain networks represent dynamic coupling or connectivity patterns between brain regions that are distinct from underlying anatomical links (Honey et al., 2009; Ponten et al., 2010). Despite growing interest in these dynamic networks as a new modality through which to understand information processing, development, and disease, their temporal characteristics have not been well characterized.
Extensive work using fMRI has identified reproducible, internally generated functional brain networks derived from correlated physiologic blood oxygen level-dependent (BOLD) signals between brain regions (Gusnard and Raichle, 2001; Greicius et al., 2003; Damoiseaux et al., 2006; Fransson, 2006; Fox and Raichle, 2007). Although fMRI recordings provide exquisite anatomical resolution, temporal resolution is limited to several seconds, and scan times are typically performed over several minutes during constrained behavioral states. The stability of intrinsic functional brain networks derived from finer temporal resolutions and spanning longer periods of time remains poorly characterized but would shed light on the endogenous dynamics of nervous system activity.
By providing direct, temporally precise recordings of underlying neuronal activity non-invasively, the scalp EEG may provide the only practical opportunity to study the temporal dynamics of functional networks over large-scale brain regions in neurologically normal human subjects. To date, early work evaluating functional brain networks using EEG has been confined to brief, cross-sectional epochs of data across many subjects, with recording lengths ranging from only a few to several hundreds of seconds during varied cognitive states (Pachou et al., 2008; de Haan et al., 2009; Leistedt et al., 2009; Douw et al., 2010; Isler et al., 2010; Moeller et al., 2011). It remains unknown whether a consistent functional network structure emerges spontaneously across time or persists across cognitive states.
We evaluated the dynamics of functional connectivity networks derived from scalp EEG signals using longitudinal recordings covering multiple days. We found that functional networks are highly variable from 1 s to the next; however, an ensemble of network topologies averaged over ∼100 s resulted in persistent “template” network structures. These network templates were dominated by a small number of commonly appearing edges constituting a “core” network. Although some differences could be identified, most core network structures persisted across all states of consciousness and frequency bands over multiple days. In contrast, measures of global network connectivity—density and clustering coefficient—varied depending on states and frequency bands. These findings support the growing theoretical framework that internally generated large-scale functional brain networks may provide dynamic, heterotopic scaffolding for adaptive cortical processing and integration at multiple spatiotemporal scales.
Materials and Methods
Subjects and EEG recordings.
Five subjects (four females, one male, aged 26–41 years) with normal neurological exams, normal brain imaging, non-epileptic events, and normal multi-day EEG recordings (as defined by clinical electroencephalographers independent from this study) were retrospectively identified from the Massachusetts General Hospital neurophysiology unit. Identified non-epileptic events leading to diagnostic evaluation in these subjects included non-epileptic seizures (n = 2), cardiogenic syncope (n = 2), and obstructive sleep apnea (n = 1). All subjects underwent multi-day EEG recordings of at least 48 h duration. The subjects did not receive alcohol, sedatives, or anticonvulsant medications during the monitoring period.
Recordings included electrooculogram (two channels), EEG (19 channels, Ag/AgCl electrodes placed according to the 10–20 international system referred to a C2 spinous process reference: FP2, F4, C4, P4, O2, F8, T4, T6, Fz, Cz, Pz, Fp1, F3, C3, P3, O1, F7, T3, and T5), and electrocardiogram using a standard clinical recording system (Xltek, a subsidiary of Natus Medical). Signals were sampled at 256 or 512 Hz and stored on a local server. Analysis of the data from these subjects was performed retrospectively under protocols monitored by the local Institutional Review Board according to National Institutes of Health guidelines.
EEG preparation.
Forty-eight contiguous hours of EEG recordings were manually reviewed by an experienced electroencephalographer (C.J.C.) and epochs with large movement and muscle artifact removed. Sleep stages [wake (W), stage 1 (N1), stage 2 (N2), slow wave sleep (N3), and rapid eye movement sleep (REM)] were manually scored and clipped by experienced neurophysiologists (M.T.B. and C.J.C.) following standard criteria (Silber et al., 2007) on 30 s epochs. When mixed sleep features were present within a 30 s epoch, smaller subsections were identified. Data were concatenated to generate a single continuous file for each state.
The data were filtered with high- and low-pass filters (third-order Butterworth, zero-phase shift digital filtering) for frequency bands of interest [broadband (0.5–55 Hz)], and the average reference was subtracted. A running Gaussian filter with a 4 s baseline was applied to further remove very slow drift artifact. For REM and wake segments, eyeblinks and saccades were identified as large deviations from the baseline mean amplitude in Fp1 and Fp2 electrodes above a threshold determined by visual inspection for each subject. Each identified eye movement artifact (± surrounding 100 ms) was removed.
Network construction.
To construct the functional networks, the prepared EEG data were divided into discrete 1 s windows for coupling analysis. We chose this window size to balance signal stationarity and accurate assessment of the coupling measure (described below). Windows that contained concatenated data from noncontiguous time points were discarded. Within each window, the data were normalized from each electrode to have zero mean and unit variance before coupling analysis.
To measure electrode associations between the time series recorded at two electrodes, we used two measures of linear coupling: the cross-correlation and coherence. For broadband analysis, the maximal cross-correlation between all electrode pairs was calculated, allowing a lag of ±200 ms. The choice of lag time was selected to encompass the duration of known neurophysiological processes and cross-cortical conduction times (Varela et al., 2001; Garcia et al., 2011). For analysis of narrower frequency bands of interest, we applied the coherence measure. For this, we used a multitaper method [time bandwidth product of 2, four tapers for delta (0.5–4 Hz), theta (4–8Hz), alpha (8–12Hz) bands; time bandwidth product of 4, six tapers for beta (12–20 Hz); and time bandwidth product of 15, six tapers for high beta/low gamma (20–50Hz)] and computed the coherence at center frequencies (2, 6, 10, 16, and 35 Hz) for all electrode pairs. Frequency bands were selected to overlap with classically recognized EEG band frequencies. Although many linear and nonlinear measures can be used to assess signal coupling, most appear to perform equally well on simulated and observed macroscopic brain voltage data (Ansari-Asl et al., 2006; Osterhage et al., 2007). For both the cross-correlation and coherence measures, analytic and computationally efficient significance tests exist. To correct for multiple comparisons, a linear step-up false detection rate controlling procedure was used with q = 0.05. For this choice of q, 5% of the network connections are expected to be falsely declared (Benjamini and Hochberg, 1995). A detailed discussion of the statistical testing applied to one of these measures can be found in the study of Kramer et al. (2009).
For each 1 s window, the connectivity of the EEG data was represented as a network in the form of an undirected binary adjacency matrix M. Significant coupling (either cross-correlation or coherence) between two electrodes i and j, indicating an edge in the functional network, was represented as M(i,j) = M(j,i) = 1. If electrodes i and j lack significant coupling, M(i,j) = M(j,i) = 0. Diagonal matrix elements, M(i,i), were always set to 0. The binary networks generated from each window were then averaged across time to create weighted functional networks representative of varied epoch lengths ranging from 1 to 5000 s. Averaged networks were also generated for the entire available recording period for each subject and in each state and frequency band. Binary and weighted networks were visualized with electrodes represented as nodes and edges weighted according to the values in the summed adjacency matrix (Fig. 1).
Figure 1.

Construction of functional networks from multivariate scalp EEG recordings. A, Example 5 s of EEG data recorded from 19 electrodes (broadband, 0.5–55 Hz). B, For each 1-s interval for each electrode pair, the cross-correlation is calculated. Two example traces recorded from O1 and T5 electrode tracings here. The maximum absolute value of the cross-correlation (blue circle) determines the significance of the coupling. (Note that, for evaluation of specific frequency bands, coherence was computed for each frequency band of interest using the multitaper method.) C, Example binary adjacency matrices derived from five 1-s epochs. Significant electrode coupling is represented in black and given a value of 1. D, Example weighted adjacency matrix generated from averaging n-binary matrices, where n ranged from 1 to 5000, representing 1 s to ∼83 min recording epochs. E, Average matrices derived from same epoch lengths are visualized, characterized, and compared.
Volume conduction.
Volume conduction of signals propagated from a common source may lead to identification of spuriously coupled scalp EEG signals. Previous methods to reduce the impact of common generators have attempted to remove information from time series data that is more likely to be explained by a common source (Nunez et al., 1997; Nolte et al., 2004; Stam et al., 2007). A second, but related, problem in identification of functional networks from scalp EEG is the impact of montage selection on observed EEG signals. Here, average reference was selected to emphasize identification of both spatially distributed and focal activities with varied dipole orientations (Nunez et al., 1997, 1999). Subtraction of the average signal from all time series, however, may result in the identification of spurious coupling (negative correlation) between cortical regions with large-amplitude signals and those that are relatively inactive. Here, to address both problems, we have removed all edges in which the maximum absolute value of the cross-correlation or coherence measure occurred at zero time lag between time series.
To examine the impact of this method, we performed a forward model simulation consisting of a four-shell spherical head model (Nunez and Srinivasan, 2005). The four shells consisted of the following: scalp (outer radius, 9.2 cm; conductivity, 0.44 S/m); skull (outer radius, 8.7 cm; conductivity, 0.015 S/m); cerebrospinal fluid (CSF) (outer radius, 8.2 cm; conductivity, 1.8); and brain (outer radius, 8.0 cm; conductivity, 0.44 S/m). Just below the brain surface (at radius 7.99 cm), 514 radial dipole sources were evenly distributed across the upper half sphere. We simulated each dipole to evolve independently in time after a pink noise process (with slope 1/f0.5) for 1 s at a sampling rate of 500 Hz and computed the scalp voltage for each moment in time. The propagation of the voltage signal from dipole source to scalp spatially blurs the voltage activity (Fig. 2A). Because in this simulation the dipole sources evolve independently, any coupling of voltage activity observed at the scalp surface results solely from the effects of volume conduction. To assess this effect, we computed the maximum absolute value of the cross-correlation between two scalp voltage signals as a function of geodesic distance on the scalp (Fig. 2B). For intermediate distances, the correlation is weaker, and we declare no edge using our statistical measure above. For short and long distances, the spurious correlation is strong and we identify network edges. If edges identified when the maximum absolute value cross-correlation occurs at zero time lag are removed, all spurious edges are identified, and the resulting functional network possess no edges, as expected for independently evolving dipole sources.
Figure 2.

Forward model simulation of volume conduction. We implemented a four-shell spherical head model, placing 514 radially oriented dipole sources on the upper half of the innermost sphere (methods adapted from Nunez and Srinivasan, 2005). We simulated 500 time steps, assigning each dipole source uncorrelated pink noise. We then measured the coupling (see Materials and Methods, Network construction) between sensors at the scalp surface (outer sphere). A, Example voltage map on cortex (left) and scalp (right) demonstrating blurring of voltage signal on the scalp surface compared with cortex. B, Distribution of maximum absolute value of the cross-correlation between scalp voltage signals as a function of geodesic distance on the scalp. Green (red) circles indicate edges (non-edges) in the resulting functional network, and filled black circles indicate the maximum absolute value of the correlation occurred at zero time lag.
This forward model simulation suggests that removing edges with maximal coupling strength occurring at zero time lag successfully eradicates spurious edges attributable to volume conduction. This method likely removes some edges that are attributable to true cross-cortical coupling. However, in post hoc analysis, we found excellent fidelity between the average networks generated with edges identified at zero time lag included with those with edges identified at zero time lag excluded across the entire recording session (cross-correlation, 0.94 ± 0.10). Thus, this method provides a conservative measure in which identified edges can be interpreted excluding the effects of volume conduction without excessive impact on the resulting functional networks.
Network measures.
To analyze the similarity between two networks, we computed the normalized two-dimensional (2D) cross-correlation with zero shift between the two networks. The normalization requires first computing, for each matrix, the scale, s, equal to the sum of its elements squared. The 2D cross-correlation is then normalized by the square root of the product of s for each matrix. We note that, in the normalization, the diagonal elements of each adjacency matrix and the edges identified at zero time lag are fixed to zero. For each epoch length evaluated, we calculated the average 2D cross-correlation of all networks averaged over the same duration.
For additional characterization of the network structures and comparison with the literature, we computed the average density and clustering coefficient of the networks. The average density of a network, d, is defined as the number of edges observed divided by the total number of possible edges. The global clustering coefficient, C, is defined as the average of local clustering coefficients of all nodes, where local clustering coefficient is defined as the proportion of edges between the neighbors of a node divided by the total number of possible edges between the neighbors of the node. To compute these network measures, we used algorithms from the Brain Connectivity Toolbox (Rubinov and Sporns, 2010). Disconnected nodes were counted as contributing zero triangles in the calculation of global clustering coefficient. We note that clustering coefficient measures are primarily affected by the density and degree distribution (Faust, 2007). Thus, for each network, we normalize the computed clustering coefficient against the average clustering coefficient generated from 500 randomized configuration models in which the degree distribution is preserved (Newman, 2010).
For each subject, network similarity measures were grouped according to state of consciousness and frequency band. Subject results were pooled and averaged for each group (e.g., N1 stability measurements were averaged among the five subjects). To limit multiple comparisons, similarity measures for data lengths of 100 s were analyzed for differences between groups. Differences in group means were first evaluated using a one-way ANOVA test, and, if a significant difference was found, pairwise t tests were performed. Significant differences in graph metric distributions generated between groups were calculated using the Kolmogorov–Smirnov test. Interactions between the effects of state and frequency on density were tested using ordinary least-squares regression on categorical independent variables.
Surrogate data generation.
To test for robustness against the null hypothesis that the observed functional networks have random structure, the 2D cross-correlation values were calculated for shuffled subject networks and random networks. For random networks, symmetric edges were drawn from an ordinary binomial distribution (p = 0.05 to mimic the observed average density). These individual networks were then averaged to generate weighted networks representative of observed networks averaged over varying-length epochs. For shuffled data, the observed network size and density were maintained. For each observed network (deduced from 1 s of EEG data as described above), the edge locations were randomly shuffled. The resulting (undirected) networks were then averaged over data epochs, and the similarity between these shuffled networks was computed.
Results
Network structure emerges over time. Visual inspection of functional networks revealed no apparent consistent structure across 1 s epochs. Instead, there was marked variability in the networks from second to second, even when epochs were obtained from the same state of consciousness (Fig. 3A). This finding was consistent with long-standing observations that cortical connectivity patterns represent transient neuronal assemblies that are rapidly adaptive to behavior (Nudo et al., 1996; Chu and Jones, 2000), mental state (Fingelkurts, 2004), and the environment (Buonomano and Merzenich, 1998).
Figure 3.
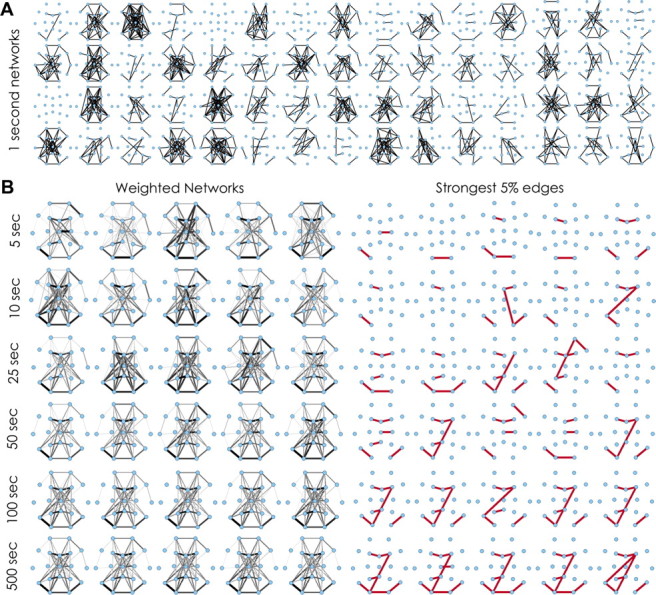
Visualization of functional network similarity and epoch length. A, Example binary functional networks derived from 1-s epochs in a single subject during REM sleep. Marked variability in network topology is evident. B, Example weighted average networks derived from varying epoch lengths from the same subject during REM sleep. The width of the edge is drawn proportional to its weight (scaled to the frequency of the most common edge). The most persistent edges present in each of these networks (those with weights above the 95th percentile) are shown on the right in red. Variability between networks derived from 5, 10, 25, and 50 s epochs is evident. A recurrent network template (left) and core topology (right) emerges in networks generated from 100 s epochs that remains stable across networks derived from longer (500 s) epochs.
To evaluate whether consistent functional connectivity patterns and recurrent topological structures emerge over longer epochs, we inspected networks generated from the entire 48 h dataset for each subject. Random or homogenous coupling activity between all brain regions is expected to produce functional networks with a uniform structure over time, whereas organized coupling patterns would produce recurrent, non-uniform topological structures. The distribution of edges present in networks derived from all 1 s epochs across the 48 h recording session was not uniform. Edge distribution was positively skewed for each subject, with most edges rarely present and a much smaller number of edges present with high frequency in each subject. For example, across all subjects using broadband analysis, 82.7 ± 2.2% of edges were present in <10% of 1 s epochs, 17.3 ± 2.20% of edges were present in 10–30% of 1 s epochs, and 13.3 ± 6.4% of edges were present in >30% of 1 s epochs.
Stable network “templates” emerge within ∼100 s. Visual inspection of averaged networks generated from increasing epoch lengths revealed complex, weighted network structures comprising edges present at different frequencies over the duration of the epoch. These template structures appeared remarkably stable across randomly selected epochs as brief as 100 s across the recording sample (Fig. 3B). To characterize the temporal stability of functional networks, we calculated the average 2D cross-correlation between networks averaged across epoch lengths of increasing duration (ranging from 1 to 5000 s) for each subject. The presence of high correlation between networks (value near 1) indicates topological similarity between their structures, and a value near 0 signifies low similarity. Consistent with visual inspection, for each subject, we found that the 2D cross-correlation between functional networks was low for networks derived from 1 s epochs (0.09 ± 0.02) but high for networks derived from longer epochs. The 2D cross-correlation achieved near-maximal values (0.84 ± 0.05) for networks derived from 100 s epochs. In comparison, cross-correlation values for random networks and shuffled networks (see Materials and Methods) remained near 0 (at 100 s epoch lengths, −0.015 and 0.007 ± 0.006, respectively; Fig. 4).
Figure 4.
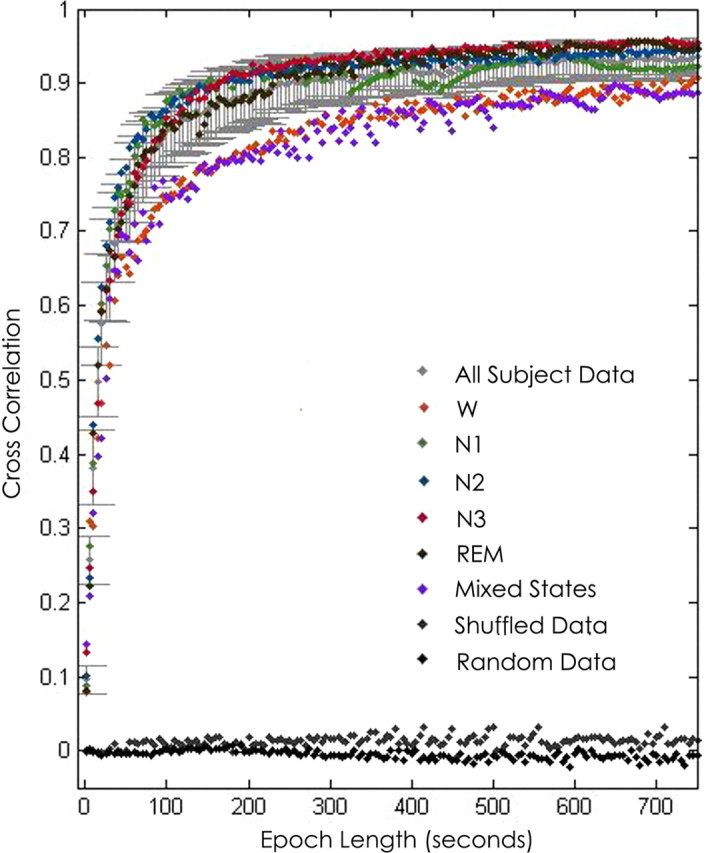
Functional network stability and epoch length. Functional network stability is plotted as the average 2D cross-correlation (y-axis) for all networks derived from increasing epoch lengths (x-axis) across 48 h samples for each subject. Mean ± SD cross-correlation for networks derived from randomly selected and averaged 1 s epochs for each subject are shown in light gray. Networks are highly variable for epochs <20 s but rapidly stabilize with increasing epoch lengths and achieve near-maximal cross-correlation values for epochs >100 s. Mean cross-correlation for shuffled (dark gray) and random data (black) remain near zero for all simulated epoch lengths. Networks derived from the same state of consciousness (wake, N1, N2, N3, and REM) are more similar than networks compared between different states of consciousness (purple). Functional networks derived from wakefulness are significantly less stable than those derived from all sleep states (p < 0.02).
Network templates are remarkably consistent across states. The above analysis of network stability does not account for the changing state of consciousness of a subject over time. To address this, we evaluated the stability of networks restricted within each state (W, N1, N2, N3, and REM). A similar timescale for temporal stability of averaged networks was seen in each state, with near-maximal similarity achieved between networks derived from ∼100 s epochs. However, networks derived from wakefulness were significantly less stable than networks derived from any other state (ANOVA, p = 0.002; t test, p < 0.02 for all comparisons; Fig. 4). To evaluate for stability of network structure between states of consciousness, we examined the 2D cross-correlation between networks derived from the same state (i.e., N1 epochs compared with all other N1 epochs) and between networks derived from epochs from different states (mixed epochs). When 100 s epochs were evaluated, networks derived from the same state had a higher cross-correlation (0.84 ± 0.05) than networks that were compared between states (0.75 ± 0.003, p < 0.004; Fig. 4).
Despite the subtle differences in network topology evident between states, networks compared from different states were strikingly similar to each other (mean cross-correlation values for mixed states, 0.75 ± 0.003 for 100 s epochs). Visual inspection of networks derived from the entire sampling period available from each state revealed similar network structures across all states of consciousness in each subject (Fig. 5). To further investigate the persistence of network structures across states, we evaluated the cross-correlation between the most common (top 5% most commonly appearing) edges in network templates derived from the duration of the recording session for each state. We found that the topology of these most common edges were consistent across states (cross-correlation = 0.69 ± 0.02), constituting a core network that persisted with high probability across states (Fig. 5).
Figure 5.

Functional network stability across subjects and states. Average networks derived from the entire recording session for each subject for each state of consciousness. The widths of the edges are drawn proportional to the frequency with which the edges appear in the sample (scaled to the frequency of the most common edge). Consistent functional network topologies are evident in each subject across all states. The most common edges present in each subject (those with weights above the 95th percentile) are shown in red. Although functional networks are stable across time for each subject, they vary considerable across subjects.
Visual inspection revealed that core edges were more likely to be found between adjacent electrodes (75.6%) and with a predilection for within hemisphere connections (71.7%) compared with between-hemisphere connections (26.1%).
Network templates are consistent across frequency bands. To characterize frequency-dependent effects on network structure, we evaluated the stability of networks generated from data centered at five frequency bands of interest: delta (0.5–4 Hz), theta (4–8 Hz), alpha (8–12 Hz), low beta (12–20 Hz), and high beta/low gamma (20–50 Hz). When networks were averaged across varying epoch sizes, network features again stabilized within ∼100 s in each frequency band (Fig. 6B). At 100 s epochs, there was no significant difference in cross-correlation between networks generated from each frequency band (ANOVA, p = 0.28; Fig. 6B). When 100 s epochs were evaluated, networks derived from the same frequency band tended to have a higher cross-correlation (0.74 ± 0.092) than networks compared across different frequency bands (0.67 ± 0.09, p = 0.09).
Figure 6.

Functional network stability across frequency bands. A, Average networks derived from the entire recording session in a single subject in each frequency band of interest [delta (0.5–4 Hz), theta (4–8 Hz), alpha (8–12 Hz) beta (12–20 Hz), and gamma (20–50 Hz)]. The widths of the edges are drawn proportional to the frequency with which the edge appears in the sample. Consistent functional network topologies are evident across all frequencies. The most stable edges (those with weights above the 95 percentile) are shown in red. B, Functional network stability is plotted as the average 2D cross-correlation (y-axis) for all networks derived from increasing epoch lengths (x-axis) for each frequency band and mixed frequency bands compared with each other. Networks are highly variable for epochs <20 s but rapidly stabilize with increasing lengths and achieve near-maximal cross-correlation values for epochs >100 s. Similar curves are seen for each frequency band. Networks compared within the same frequency are more similar then networks compared from different frequency bands (plotted in gray). C, Top, Empirical cumulative distribution function of density measures for all 1 s networks for each frequency band and all subjects. Graph characteristics vary significantly between frequency bands (p < 0.0001 for all comparisons). Sparsest networks were seen in the low gamma and theta bands for each subject.
The similarity between networks derived from different frequency bands was nonetheless striking; across the five frequency bands, networks averaged across 100 s epochs achieved cross-correlation values of ∼0.67 between different frequencies. Visual inspection of frequency-based coherence networks generated from the entire sampling period (48 h) revealed marked persistence of core topologies across all frequency bands (Fig. 6A). To investigate the persistence of dominant network structures across frequency bands, we evaluated the cross-correlation between the most common edges (top 5%) in network templates derived from the duration of the recording session in each frequency band. We found that highest-frequency edges were markedly similar across each frequency band (cross-correlation = 0.61 ± 0.04), constituting a persistent cross-frequency network core.
Although persistent coupling appeared between the same electrode pairs for all frequency bands, visual inspection of raw EEG signals suggested that the periods of coupling were not necessarily present at the same moment in time (Fig. 7). To characterize the similarity between networks generated from different frequency bands at the same moment in time, we evaluated the average 2D cross-correlation of networks generated from the same 1 s epoch (i.e., a network derived from the beta frequency band at time n of the EEG recording to networks derived from each other frequency band at time n of the EEG recording) and the average 2D cross-correlation of networks generated from randomly chosen temporally separate 1 s epochs (selected from a uniform distribution across the length of the recording sample; n = 1000). There was no difference in 2D cross-correlation between networks selected from the same 1 s epoch (0.11 ± 0.03) and networks compared from temporally separate 1 s epochs (0.01 ± 0.03) across frequency bands (p = 0.31). Therefore, although networks had a similar average topology across all frequency bands analyzed, network edges were not more likely to be present across frequency bands at the same time.
Figure 7.

Signal coupling across frequencies is not synchronous. Left, Example EEG data from two electrodes that are highly coupled on average. Strong coupling was apparent between the same electrode pair at each frequency band, although not necessarily at the same time. Here, in the delta band, coupling is strongest in the first second, whereas in the alpha band, coupling is strong in the third second, and in the beta band, coupling is strong in the second and third seconds. Right, Example EEG data from two electrodes that are not highly coupled on average. Coupling is not strong between this electrode pair at any frequency band.
Template network structures are not consistent across subjects. Although consistent network structures were evident in relatively short time samples (∼100 s) across multiple days and states of consciousness for each subject, visual inspection revealed marked variability in template networks between subjects (Fig. 5). Networks generated from the same subject were significantly more similar than networks generated from different subjects (2D cross-correlation at 100 s, 0.84 ± 0.05 and 0.42 ± 0.20, respectively, p < 0.005). 2D cross-correlation values for average networks generated from the entire sampling period (48 h) compared between subjects 0.68 ± 0.16 (Fig. 8A). Therefore, template network topologies, although more similar than random or shuffled networks, are highly variable between subjects.
Figure 8.

Functional network stability and graph characteristics across subjects and states. A, Functional network stability plotted as the average 2D cross-correlation for all networks derived from increasing epoch lengths. Networks are markedly less similar between subjects than within the same subject but more similar than random or shuffled networks. B, Top, Empirical cumulative distribution function of density measures for all 1 s networks for each state and all subjects. Bottom, Empirical cumulative distribution function of clustering coefficient values of 1 s networks for each state and all subjects. Graph characteristics vary significantly between states (p < 0.0001 for all comparisons). Similar distributions were seen for each subject. Sparsest networks with lowest clustering were present in N3, followed by N2 in each subject. Densest networks with highest clustering are present during wakefulness in each subject. REM and N1 states had intermediate values, which were near-equivalent to wake values in one subject.
Graph characteristics differ between states and frequency bands but are consistent across subjects. To further characterize the observed functional networks, we evaluated average density and clustering coefficient for each state and each frequency band. These two measures were chosen as two of the primary, characteristic measures of the topology of a network. The density, d, is the fraction of total possible edges present in a network [bounded between 0 (no edges) and 1 (all possible edges are present)] and broadly represents the overall connectivity of a network. The clustering coefficient, C, measures the fraction of possible triangles (the presence of edges among all nodes in a grouping of 3) that are present in a network and represents the tendency of nodes in the network to cluster by virtue of their nearest-neighbor connectivity. To adjust for the impact of density and degree on clustering coefficient, this measure was normalized against random networks with the same degree distribution (see Materials and Methods, Network measures).
For each state, the functional networks were sparsely connected, with mean d ranging from 0.0.03 to 0.07 and mean C ranging from 0.71 to 1.32. For each subject, unlike the template network topological structure, the distribution of average densities and clustering coefficients differed consistently between states of consciousness (p < 0.01 for all comparisons). For each subject, average density was higher during wakefulness than sleep, with lowest values present during stages N2 and N3. Conversely, average clustering coefficient was highest during stages N2 and N3 and lowest during wakefulness (W: d = 0.07 ± 0.0.02, C = 0.78 ± 0.03; N1: d = 0.06 ± 0.02, C = 0.76 ± 0.40; N2: d = 0.04 ± 0.01, C = 0.98 ± 0.25; N3: d = 0.03 ± 0.010, C = 1.32 ± 0.24; REM: d = 0.05 ± 0.02, C = 0.71 ± 0.46; Fig. 8B). Density and clustering coefficient were not correlated (Pearson's r, −0.03).
For each frequency band, the average density and clustering coefficient of functional networks spanned a broader range (mean d range, 0.05–0.18; mean C range, 2.86–4.91). The distribution of average densities and clustering coefficients was significantly different between frequency bands (p < 0.001 for all comparisons; Fig. 6C). Networks generated from the delta and beta frequency bands had highest average density, with lowest average clustering seen in the beta band; conversely, networks generated from the alpha, theta, and gamma bands were sparsest and more highly clustered (delta: d = 0.12 ± 0.03, C = 3.78 ± 076; theta: d = 0.05 ± 0.02, C = 4.91 ± 1.80; alpha: d = 0.07 ± 0.02, C = 4.12 ± 1.35; beta, d = 0.18 ± 0.06, C = 2.86 ± 1.24; gamma d = 0.05 ± 0.01, C = 3.60 ± 0.81). Density and clustering coefficient were not correlated (Pearson's r, −0.06). We found significant interactions between the effects of state and frequency on density (p < 0.001 for all frequencies), with the beta band demonstrating a markedly higher density during sleep compared with wakefulness (conditional mean densities of the interaction of frequency with state: delta, 0.08 ± 0.001; theta, 0.04 ± 0.001; alpha, 0; beta, 0.16 ± 0.001; gamma, 0.04 ± 0.001). Networks therefore have common dominant edges across state of consciousness and frequency band but differ in density and clustering coefficient. Consistent with previous work, sparsest and most highly clustered networks were seen during sleep (Ferri et al., 2007; Kar et al., 2011). Densest networks with low clustering were consistently seen in the delta band, and sparsest networks with high clustering were consistently present in the gamma band across states and subjects.
Discussion
Using multi-day scalp EEG recordings from five healthy human subjects, we found that functional networks are highly variable when evaluated on the timescale of seconds. However, we found that consistent large-scale functional relationships recur spontaneously, generating quasi-stable template network structures. The most common, dominant edges within this template constituted a persistent network core. These conserved subnetworks became evident when functional networks—derived from 1 s windows of EEG data—were averaged over epochs of at least ∼100 s in duration. The resulting templates were present across all days of recording, states of consciousness, and frequency bands evaluated. Although the temporal dynamics of network stability and measures of network connectivity were strikingly similar across subjects, the structure of each network template varied across individuals.
Large-scale, functional connectivity brain networks have long been identified by correlating markers of metabolic activity between brain regions using positron emission tomography (PET) and fMRI (Friston et al., 1994; Biswal et al., 1995; Raichle et al., 2001; Greicius et al., 2003). Highly correlated fluctuations in fMRI BOLD signal that decrease during cognitive tasks (“default-mode networks”) or are present at rest (“resting state networks”) have been found to be a useful biomarker for developmental stage and disease (Buckner et al., 2008; Bassett and Bullmore, 2009; Power et al., 2010). Recent work has suggested that fMRI BOLD signal fluctuations may colocalize with slow fluctuations in EEG gamma power (He and Raichle, 2009; Ko et al., 2011), but how, and whether, the BOLD signal relates to brain electrophysiology remains incompletely understood (Bartels et al., 2008; Britz et al., 2010; Hlinka et al., 2010).
fMRI resting networks appear to be stable within the same day when averaged over at least 5 min (Whitlow et al., 2011; Park et al., 2012); however, more detailed investigation of the short- and long-term temporal dynamics of these networks has been limited by the temporal resolution of the BOLD signal (∼1 s) and constraints on fMRI scan duration (typically several minutes). Here, using a direct measure of neuronal activity, we find that functional brain networks are rapidly shifting over short time intervals; however, spontaneous neuronal connectivity patterns recur with high probability over time. These large-scale network templates are individual specific and strikingly stable through unconstrained states of consciousness and across multiple days, with persistent dominant edges constituting a network core. How functional and structural networks are related remains an open research question (Rubinov et al., 2009). The variability of functional networks over short time intervals and across individuals suggests that these assemblies do not simply reflect relatively static large-scale macroscopic anatomical connectivity patterns (Honey et al., 2009; Yasmin et al., 2009; Ponten et al., 2010). Our findings of a core functional organization within these dynamical systems may therefore reflect an overlay of rapidly changing biophysical mechanisms on more static structural anatomy. These observations complement a growing body of literature that intrinsic and persistent core functional assemblies sculpt the complex organization of neuronal processing at multiple spatiotemporal scales (Singer, 1999; Fingelkurts, 2004; Laufs, 2008; Bullmore and Sporns, 2009; Deco et al., 2011).
Our findings of network instability on the order of seconds and network stabilization on the order of ∼100 s implicate at least one consistent “timescale” on which cortical brain networks appears to operate. This temporal stability could not be reproduced with surrogate data generated from random or shuffled networks and was consistent across subjects and all states of consciousness and frequency bands. Very slow oscillations on the order of <0.1 Hz (phases of ∼10 s and greater) dominate functional networks identified using fMRI (Fox and Raichle, 2007) and peak oscillations at 0.017 Hz (∼60 s) may correlate with the fluctuation of power in brain voltage oscillations (Ko et al., 2011). We find that average functional network templates emerge on a similar timescale (∼100 s). Cortical information processing and integration is hierarchically organized across several fundamental scales, ranging from milliseconds [synaptic integration and spiking patterns (Singer, 1999)], hundreds of milliseconds [theta integration across local field potentials (Mizuseki et al., 2009)], to hours [molecular “clocks” underlying circadian rhythms of consciousness (Lefta et al., 2011)]. The timescale for functional network stability observed here (∼100 s) may provide a temporally appropriate cadence for modulation and integration of large-scale cortical processes (ranging from tens to hundreds of milliseconds) across multiple frequencies (Baria et al., 2011). Functional cortical networks could thus provide internally generated quasi-regular heterotopic scaffolding to selectively modulate transient, lower probability cortical processes (Deco et al., 2011). That the template network components observed here were not present as oscillating phase-locked discrete events but were observed to emerge probabilistically over ∼100 s time course, could enable fluid temporal integration across cortical events joined both forward and backward in time.
Consistent with growing evidence that higher-frequency networks may be more focally distributed, we observed denser, less clustered networks in delta frequency and sparser, highly clustered networks in the gamma frequency (Singer, 1999; Miller et al., 2007; He and Raichle, 2009; Tallon-Baudry, 2009; Baria et al., 2011). Although beta frequency power decreases during sleep relative to wakefulness, we have observed an increase in functional network density during sleep, consistent with previous work demonstrating that coherence between electrodes is increased in beta as a result of the presence of sleep spindles (12–15 Hz) (Achermann and Borbély, 1998a,b; Gross and Gotman, 1999). Although the density and clustering of networks varied across frequency bands, there was marked persistence of the most common edges across frequency bands. This finding is consistent with the observation that similar network templates persisted across sleep states, which are indexed primarily based on frequency content (Silber et al., 2007). Notably, specific edges were not necessarily present simultaneously across frequency bands, suggesting that cross-frequency network templates may not coincide. These global observations suggest that long-range integration preferentially occurs between similar brain regions across all frequencies on average but that coupling strength may fluctuate across frequency bands over time. Our findings are consistent with observations that different frequency bands might have “crosstalk” between them at any one time (Klimesch, 1996; Friston, 1997; von Stein et al., 2000; Varela et al., 2001; Laufs, 2008; He et al., 2010), thus simultaneously providing additional dimensions of information transfer across cross-frequency network assemblies. Cross-frequency coupling localized to different brain regions in distinct frequencies and with distinct phase relationships (Fell and Axmacher, 2011) were not identified in our analysis. Additional examination of the temporal features of long-distance, edge-specific, cross-frequency coupling relationships will be required to further characterize the network properties of such complex interdependencies.
A common limitation to EEG-based analysis includes the poor spatial resolution of the EEG signal that constrains identification of complex network structures and ignores the contribution of subcortical structures. Despite these limitations encountered in the scalp EEG signal, we and others have identified fine stable graph characteristics across time and subjects using these techniques (Ferri et al., 2007; Boersma et al., 2011; Moeller et al., 2011). Furthermore, because the EEG represents the spatially blurred average activity of millions of underlying cortical neurons propagated through the cortex, CSF, skull, and scalp and further assigned to a near-regular lattice of scalp electrode locations, volume averaging may bias analyses toward the identification of spurious edges between electrodes, especially adjacent electrodes. However, in our analysis, we have used conservative method to remove coupling relationships likely to be caused by volume conduction, allowing us to interpret remaining identified edges as representing interregional coupling. Finally, we also recognize that the spatial resolution of the recording equipment may influence the temporal stability of identified networks. Recording techniques with denser cortical spatial resolution will have increased sensitivity to pick up local coupling shifts that may be spatially averaged using EEG, resulting in more stable network architecture over time. Nonetheless, we have observed similar timescales for functional network stability in long-term intracranial electrocorticography (Kramer et al., 2011), suggesting that the timescale observed for functional network stability may reflect a consistent, intrinsic process.
Despite these limitations, it is important to recognize that EEG data are widely available and offer a unique opportunity for in vivo evaluation of large-scale cortical networks in healthy and diseased populations of all ages and in a wide variety of circumstances. The brevity of data that is required to generate a stable and representative functional network within a given individual is promising for the feasibility of future research and the development of therapeutically useful biomarkers of integrated brain dynamics. Our findings suggest that, using functional network techniques, a routine EEG (usually at least 30 min long) contains sufficient information to reliably and tractably characterize the core functional network of a subject. These core networks may provide individual-specific baseline physiological phenotypes and null hypotheses for event-specific dynamic network structures as well as population level state- and frequency-specific graph characteristics. Additional work evaluating how these core networks develop and persist across months, years, and the lifespan—and how they are disrupted in disease—may provide enormous insight into their function and potential utility as biomarkers of neurological disease.
Footnotes
S.S.C. and M.B.W. are supported by National Institutes of Health/National Institute of Neurological Disorders and Stroke Grant NS062092. C.J.C. is supported by the Child Neurology Foundation, the American Academy of Neurology, and the Clinical Investigator Training Program: Harvard/Massachusetts Institute of Technology Health Sciences and Technology, Beth Israel Deaconess Medical Center, in collaboration with Pfizer and Merck. M.A.K. holds a Career Award at the Scientific Interface from the Burroughs Wellcome Fund.
The authors declare no competing financial interests.
References
- Achermann P, Borbély AA. Temporal evolution of coherence and power in the human sleep electroencephalogram. J Sleep Res. 1998a;7(Suppl 1):36–41. doi: 10.1046/j.1365-2869.7.s1.6.x. [DOI] [PubMed] [Google Scholar]
- Achermann P, Borbély AA. Coherence analysis of the human sleep electroencephalogram. Neuroscience. 1998b;85:1195–1208. doi: 10.1016/s0306-4522(97)00692-1. [DOI] [PubMed] [Google Scholar]
- Ansari-Asl K, Senhadji L, Bellanger JJ, Wendling F. Quantitative evaluation of linear and nonlinear methods characterizing interdependencies between brain signals. Phys Rev E Stat Nonlin Soft Matter Phys. 2006;74 doi: 10.1103/PhysRevE.74.031916. 031916. [DOI] [PMC free article] [PubMed] [Google Scholar]
- Baria AT, Baliki MN, Parrish T, Apkarian AV. Anatomical and functional assemblies of brain BOLD oscillations. J Neurosci. 2011;31:7910–7919. doi: 10.1523/JNEUROSCI.1296-11.2011. [DOI] [PMC free article] [PubMed] [Google Scholar]
- Bartels A, Logothetis NK, Moutoussis K. fMRI and its interpretations: an illustration on directional selectivity in area V5/MT. Trends Neurosci. 2008;31:444–453. doi: 10.1016/j.tins.2008.06.004. [DOI] [PubMed] [Google Scholar]
- Bassett DS, Bullmore ET. Human brain networks in health and disease. Curr Opin Neurol. 2009;22:340–347. doi: 10.1097/WCO.0b013e32832d93dd. [DOI] [PMC free article] [PubMed] [Google Scholar]
- Benjamini Y, Hochberg Y. Controlling the false discovery rate: a practical and powerful approach to multiple testing. J R Stat Soc Series B Stat Methods. 1995;57:289–300. [Google Scholar]
- Biswal B, Yetkin FZ, Haughton VM, Hyde JS. Functional connectivity in the motor cortex of resting human brain using echo-planar MRI. Magn Reson Med. 1995;34:537–541. doi: 10.1002/mrm.1910340409. [DOI] [PubMed] [Google Scholar]
- Boersma M, Smit DJ, de Bie HM, Van Baal GC, Boomsma DI, de Geus EJ, Delemarre-van de Waal HA, Stam CJ. Network analysis of resting state EEG in the developing young brain: structure comes with maturation. Hum Brain Mapp. 2011;32:413–425. doi: 10.1002/hbm.21030. [DOI] [PMC free article] [PubMed] [Google Scholar]
- Britz J, Van De Ville D, Michel CM. BOLD correlates of EEG topography reveal rapid resting-state network dynamics. Neuroimage. 2010;52:1162–1170. doi: 10.1016/j.neuroimage.2010.02.052. [DOI] [PubMed] [Google Scholar]
- Buckner RL, Andrews-Hanna JR, Schacter DL. The brain's default network: anatomy, function, and relevance to disease. Ann N Y Acad Sci. 2008;1124:1–38. doi: 10.1196/annals.1440.011. [DOI] [PubMed] [Google Scholar]
- Bullmore E, Sporns O. Complex brain networks: graph theoretical analysis of structural and functional systems. Nat Rev Neurosci. 2009;10:186–198. doi: 10.1038/nrn2575. [DOI] [PubMed] [Google Scholar]
- Buonomano DV, Merzenich MM. Cortical plasticity: from synapses to maps. Annu Rev Neurosci. 1998;21:149–186. doi: 10.1146/annurev.neuro.21.1.149. [DOI] [PubMed] [Google Scholar]
- Chu CJ, Jones TA. Experience-dependent structural plasticity in cortex heterotopic to focal sensorimotor cortical damage. Exp Neurol. 2000;166:403–414. doi: 10.1006/exnr.2000.7509. [DOI] [PubMed] [Google Scholar]
- Damoiseaux JS, Rombouts SA, Barkhof F, Scheltens P, Stam CJ, Smith SM, Beckmann CF. Consistent resting-state networks across healthy subjects. Proc Natl Acad Sci USA. 2006;103:13848–13853. doi: 10.1073/pnas.0601417103. [DOI] [PMC free article] [PubMed] [Google Scholar]
- Deco G, Jirsa VK, McIntosh AR. Emerging concepts for the dynamical organization of resting-state activity in the brain. Nat Rev Neurosci. 2011;12:43–56. doi: 10.1038/nrn2961. [DOI] [PubMed] [Google Scholar]
- de Haan W, Pijnenburg YA, Strijers RL, van der Made Y, van der Flier WM, Scheltens P, Stam CJ. Functional neural network analysis in frontotemporal dementia and Alzheimer's disease using EEG and graph theory. BMC Neurosci. 2009;10:101. doi: 10.1186/1471-2202-10-101. [DOI] [PMC free article] [PubMed] [Google Scholar]
- Douw L, de Groot M, van Dellen E, Heimans JJ, Ronner HE, Stam CJ, Reijneveld JC. “Functional connectivity” is a sensitive predictor of epilepsy diagnosis after the first seizure. PLoS One. 2010;5:e10839. doi: 10.1371/journal.pone.0010839. [DOI] [PMC free article] [PubMed] [Google Scholar]
- Faust K. Very local structure in social networks. Sociol Methodol. 2007;37:209–256. [Google Scholar]
- Fell J, Axmacher N. The role of phase synchronization in memory processes. Nat Rev Neurosci. 2011;12:105–118. doi: 10.1038/nrn2979. [DOI] [PubMed] [Google Scholar]
- Ferri R, Rundo F, Bruni O, Terzano MG, Stam CJ. Small-world network organization of functional connectivity of EEG slow-wave activity during sleep. Clin Neurophysiol. 2007;118:449–456. doi: 10.1016/j.clinph.2006.10.021. [DOI] [PubMed] [Google Scholar]
- Fingelkurts AA. Making complexity simpler: multivariability and metastability in the brain. Int J Neurosci. 2004;114:843–862. doi: 10.1080/00207450490450046. [DOI] [PubMed] [Google Scholar]
- Fox MD, Raichle ME. Spontaneous fluctuations in brain activity observed with functional magnetic resonance imaging. Nat Rev Neurosci. 2007;8:700–711. doi: 10.1038/nrn2201. [DOI] [PubMed] [Google Scholar]
- Fransson P. How default is the default mode of brain function? Further evidence from intrinsic BOLD signal fluctuations. Neuropsychologia. 2006;44:2836–2845. doi: 10.1016/j.neuropsychologia.2006.06.017. [DOI] [PubMed] [Google Scholar]
- Friston KJ. Another neural code? Neuroimage. 1997;5:213–220. doi: 10.1006/nimg.1997.0260. [DOI] [PubMed] [Google Scholar]
- Friston KJ, Tononi G, Reeke GN, Jr, Sporns O, Edelman GM. Value-dependent selection in the brain: simulation in a synthetic neural model. Neuroscience. 1994;59:229–243. doi: 10.1016/0306-4522(94)90592-4. [DOI] [PubMed] [Google Scholar]
- Garcia JO, Grossman ED, Srinivasan R. Evoked potentials in large-scale cortical networks elicited by TMS of the visual cortex. J Neurophysiol. 2011;106:1734–1746. doi: 10.1152/jn.00739.2010. [DOI] [PMC free article] [PubMed] [Google Scholar]
- Greicius MD, Krasnow B, Reiss AL, Menon V. Functional connectivity in the resting brain: a network analysis of the default mode hypothesis. Proc Natl Acad Sci USA. 2003;100:253–258. doi: 10.1073/pnas.0135058100. [DOI] [PMC free article] [PubMed] [Google Scholar]
- Gross DW, Gotman J. Correlation of high-frequency oscillations with the sleep-wake cycle and cognitive activity in humans. Neuroscience. 1999;94:1005–1018. doi: 10.1016/s0306-4522(99)00343-7. [DOI] [PubMed] [Google Scholar]
- Gusnard DA, Raichle ME. Searching for a baseline: functional imaging and the resting human brain. Nat Rev Neurosci. 2001;2:685–694. doi: 10.1038/35094500. [DOI] [PubMed] [Google Scholar]
- He BJ, Raichle ME. The fMRI signal, slow cortical potential and consciousness. Trends Cogn Sci. 2009;13:302–309. doi: 10.1016/j.tics.2009.04.004. [DOI] [PMC free article] [PubMed] [Google Scholar]
- He BJ, Zempel JM, Snyder AZ, Raichle ME. The temporal structures and functional significance of scale-free brain activity. Neuron. 2010;66:353–369. doi: 10.1016/j.neuron.2010.04.020. [DOI] [PMC free article] [PubMed] [Google Scholar]
- Hlinka J, Alexakis C, Diukova A, Liddle PF, Auer DP. Slow EEG pattern predicts reduced intrinsic functional connectivity in the default mode network: an inter-subject analysis. Neuroimage. 2010;53:239–246. doi: 10.1016/j.neuroimage.2010.06.002. [DOI] [PubMed] [Google Scholar]
- Homae F, Watanabe H, Otobe T, Nakano T, Go T, Konishi Y, Taga G. Development of global cortical networks in early infancy. J Neurosci. 2010;30:4877–4882. doi: 10.1523/JNEUROSCI.5618-09.2010. [DOI] [PMC free article] [PubMed] [Google Scholar]
- Honey CJ, Sporns O, Cammoun L, Gigandet X, Thiran JP, Meuli R, Hagmann P. Predicting human resting-state functional connectivity from structural connectivity. Proc Natl Acad Sci USA. 2009;106:2035–2040. doi: 10.1073/pnas.0811168106. [DOI] [PMC free article] [PubMed] [Google Scholar]
- Isler JR, Martien KM, Grieve PG, Stark RI, Herbert MR. Reduced functional connectivity in visual evoked potentials in children with autism spectrum disorder. Clin Neurophysiol. 2010;121:2035–2043. doi: 10.1016/j.clinph.2010.05.004. [DOI] [PubMed] [Google Scholar]
- Kar S, Routray A, Nayak BP. Functional network changes associated with sleep deprivation and fatigue during simulated driving: validation using blood biomarkers. Clin Neurophysiol. 2011;122:966–974. doi: 10.1016/j.clinph.2010.08.009. [DOI] [PubMed] [Google Scholar]
- Klimesch W. Memory processes, brain oscillations and EEG synchronization. Int J Psychophysiol. 1996;24:61–100. doi: 10.1016/s0167-8760(96)00057-8. [DOI] [PubMed] [Google Scholar]
- Ko AL, Darvas F, Poliakov A, Ojemann J, Sorensen LB. Quasi-periodic Fluctuations in Default Mode Network Electrophysiology. J Neurosci. 2011;31:11728–11732. doi: 10.1523/JNEUROSCI.5730-10.2011. [DOI] [PMC free article] [PubMed] [Google Scholar]
- Kramer MA, Eden UT, Cash SS, Kolaczyk ED. Network inference with confidence from multivariate time series. Phys Rev E Stat Nonlin Soft Matter Phys. 2009;79 doi: 10.1103/PhysRevE.79.061916. 061916. [DOI] [PubMed] [Google Scholar]
- Kramer MA, Eden UT, Kolaczyk ED, Zepeda R, Eskandar EN, Cash SS. Coalescence and fragmentation of cortical networks during focal seizures. J Neurosci. 2010;30:10076–10085. doi: 10.1523/JNEUROSCI.6309-09.2010. [DOI] [PMC free article] [PubMed] [Google Scholar]
- Kramer MA, Eden UT, Lepage KQ, Kolaczyk ED, Bianchi MT, Cash SS. Emergence of persistent networks in long-term intracranial EEG recordings. J Neurosci. 2011;31:15757–15767. doi: 10.1523/JNEUROSCI.2287-11.2011. [DOI] [PMC free article] [PubMed] [Google Scholar]
- Laufs H. Endogenous brain oscillations and related networks detected by surface EEG-combined fMRI. Hum Brain Mapp. 2008;29:762–769. doi: 10.1002/hbm.20600. [DOI] [PMC free article] [PubMed] [Google Scholar]
- Lefta M, Wolff G, Esser KA. Circadian rhythms, the molecular clock, and skeletal muscle. Curr Top Dev Biol. 2011;96:231–271. doi: 10.1016/B978-0-12-385940-2.00009-7. [DOI] [PMC free article] [PubMed] [Google Scholar]
- Leistedt SJ, Coumans N, Dumont M, Lanquart JP, Stam CJ, Linkowski P. Altered sleep brain functional connectivity in acutely depressed patients. Hum Brain Mapp. 2009;30:2207–2219. doi: 10.1002/hbm.20662. [DOI] [PMC free article] [PubMed] [Google Scholar]
- Miller KJ, Leuthardt EC, Schalk G, Rao RP, Anderson NR, Moran DW, Miller JW, Ojemann JG. Spectral changes in cortical surface potentials during motor movement. J Neurosci. 2007;27:2424–2432. doi: 10.1523/JNEUROSCI.3886-06.2007. [DOI] [PMC free article] [PubMed] [Google Scholar]
- Mizuseki K, Sirota A, Pastalkova E, Buzsáki G. Theta oscillations provide temporal windows for local circuit computation in the entorhinal-hippocampal loop. Neuron. 2009;64:267–280. doi: 10.1016/j.neuron.2009.08.037. [DOI] [PMC free article] [PubMed] [Google Scholar]
- Moeller F, Maneshi M, Pittau F, Gholipour T, Bellec P, Dubeau F, Grova C, Gotman J. Functional connectivity in patients with idiopathic generalized epilepsy. Epilepsia. 2011;52:515–522. doi: 10.1111/j.1528-1167.2010.02938.x. [DOI] [PMC free article] [PubMed] [Google Scholar]
- Newman MEJ. Networks: an introduction. New York: Oxford UP; 2010. [Google Scholar]
- Nolte G, Bai O, Wheaton L, Mari Z, Vorbach S, Hallett M. Identifying true brain interaction from EEG data using the imaginary part of coherency. Clin Neurophysiol. 2004;115:2292–2307. doi: 10.1016/j.clinph.2004.04.029. [DOI] [PubMed] [Google Scholar]
- Nudo RJ, Wise BM, SiFuentes F, Milliken GW. Neural substrates for the effects of rehabilitative training on motor recovery after ischemic infarct. Science. 1996;272:1791–1794. doi: 10.1126/science.272.5269.1791. [DOI] [PubMed] [Google Scholar]
- Nunez PL, Srinivasan R. Electric fields of the brain: the neurophysics of EEG. Ed 2. New York: Oxford UP; 2005. [Google Scholar]
- Nunez PL, Srinivasan R, Westdorp AF, Wijesinghe RS, Tucker DM, Silberstein RB, Cadusch PJ. EEG coherency. I. Statistics, reference electrode, volume conduction, Laplacians, cortical imaging, and interpretation at multiple scales. Electroencephalogr Clin Neurophysiol. 1997;103:499–515. doi: 10.1016/s0013-4694(97)00066-7. [DOI] [PubMed] [Google Scholar]
- Nunez PL, Silberstein RB, Shi Z, Carpenter MR, Srinivasan R, Tucker DM, Doran SM, Cadusch PJ, Wijesinghe RS. EEG coherency. II. Experimental comparisons of multiple measures. Clin Neurophysiol. 1999;110:469–486. doi: 10.1016/s1388-2457(98)00043-1. [DOI] [PubMed] [Google Scholar]
- Osterhage H, Mormann F, Wagner T, Lehnertz K. Measuring the directionality of coupling: phase versus state space dynamics and application to EEG time series. Int J Neural Syst. 2007;17:139–148. doi: 10.1142/S0129065707001019. [DOI] [PubMed] [Google Scholar]
- Pachou E, Vourkas M, Simos P, Smit D, Stam CJ, Tsirka V, Micheloyannis S. Working memory in schizophrenia: an EEG study using power spectrum and coherence analysis to estimate cortical activation and network behavior. Brain Topogr. 2008;21:128–137. doi: 10.1007/s10548-008-0062-5. [DOI] [PubMed] [Google Scholar]
- Park B, Kim JI, Lee D, Jeong SO, Lee JD, Park HJ. Are brain networks stable during a 24-hour period? Neuroimage. 2012;59:456–466. doi: 10.1016/j.neuroimage.2011.07.049. [DOI] [PubMed] [Google Scholar]
- Ponten SC, Daffertshofer A, Hillebrand A, Stam CJ. The relationship between structural and functional connectivity: graph theoretical analysis of an EEG neural mass model. Neuroimage. 2010;52:985–994. doi: 10.1016/j.neuroimage.2009.10.049. [DOI] [PubMed] [Google Scholar]
- Power JD, Fair DA, Schlaggar BL, Petersen SE. The development of human functional brain networks. Neuron. 2010;67:735–748. doi: 10.1016/j.neuron.2010.08.017. [DOI] [PMC free article] [PubMed] [Google Scholar]
- Raichle ME, MacLeod AM, Snyder AZ, Powers WJ, Gusnard DA, Shulman GL. A default mode of brain function. Proc Natl Acad Sci USA. 2001;98:676–682. doi: 10.1073/pnas.98.2.676. [DOI] [PMC free article] [PubMed] [Google Scholar]
- Rubinov M, Sporns O. Complex network measures of brain connectivity: uses and interpretations. Neuroimage. 2010;52:1059–1069. doi: 10.1016/j.neuroimage.2009.10.003. [DOI] [PubMed] [Google Scholar]
- Rubinov M, Sporns O, van Leeuwen C, Breakspear M. Symbiotic relationship between brain structure and dynamics. BMC Neurosci. 2009;10:55. doi: 10.1186/1471-2202-10-55. [DOI] [PMC free article] [PubMed] [Google Scholar]
- Silber MH, Ancoli-Israel S, Bonnet MH, Chokroverty S, Grigg-Damberger MM, Hirshkowitz M, Kapen S, Keenan SA, Kryger MH, Penzel T, Pressman MR, Iber C. The visual scoring of sleep in adults. J Clin Sleep Med. 2007;3:121–131. [PubMed] [Google Scholar]
- Singer W. Neuronal synchrony: a versatile code for the definition of relations? Neuron. 1999;24:49–65. 111–125. doi: 10.1016/s0896-6273(00)80821-1. [DOI] [PubMed] [Google Scholar]
- Stam CJ, Nolte G, Daffertshofer A. Phase lag index: assessment of functional connectivity from multi channel EEG and MEG with diminished bias from common sources. Hum Brain Mapp. 2007;28:1178–1193. doi: 10.1002/hbm.20346. [DOI] [PMC free article] [PubMed] [Google Scholar]
- Stam CJ, de Haan W, Daffertshofer A, Jones BF, Manshanden I, van Cappellen van Walsum AM, Montez T, Verbunt JP, de Munck JC, van Dijk BW, Berendse HW, Scheltens P. Graph theoretical analysis of magnetoencephalographic functional connectivity in Alzheimer's disease. Brain. 2009;132:213–224. doi: 10.1093/brain/awn262. [DOI] [PubMed] [Google Scholar]
- Tallon-Baudry C. The roles of gamma-band oscillatory synchrony in human visual cognition. Front Biosci. 2009;14:321–332. doi: 10.2741/3246. [DOI] [PubMed] [Google Scholar]
- Varela F, Lachaux JP, Rodriguez E, Martinerie J. The brainweb: phase synchronization and large-scale integration. Nat Rev Neurosci. 2001;2:229–239. doi: 10.1038/35067550. [DOI] [PubMed] [Google Scholar]
- von Stein A, Chiang C, König P. Top-down processing mediated by interareal synchronization. Proc Natl Acad Sci USA. 2000;97:14748–14753. doi: 10.1073/pnas.97.26.14748. [DOI] [PMC free article] [PubMed] [Google Scholar]
- Whitlow CT, Casanova R, Maldjian JA. Effect of resting-state functional MR imaging duration on stability of graph theory metrics of brain network connectivity. Radiology. 2011;259:516–524. doi: 10.1148/radiol.11101708. [DOI] [PubMed] [Google Scholar]
- Wig GS, Schlaggar BL, Petersen SE. Concepts and principles in the analysis of brain networks. Ann N Y Acad Sci. 2011;1224:126–146. doi: 10.1111/j.1749-6632.2010.05947.x. [DOI] [PubMed] [Google Scholar]
- Yasmin H, Aoki S, Abe O, Nakata Y, Hayashi N, Masutani Y, Goto M, Ohtomo K. Tract-specific analysis of white matter pathways in healthy subjects: a pilot study using diffusion tensor MRI. Neuroradiology. 2009;51:831–840. doi: 10.1007/s00234-009-0580-1. [DOI] [PubMed] [Google Scholar]