

Abstract
Previous studies have found that cortical responses to different stimuli become less distinctive as people get older. This age-related dedifferentiation may reflect the broadening of the tuning curves of category-selective neurons (broadening hypothesis) or it may be due to decreased activation of category-selective neurons (attenuation hypothesis). In this study, we evaluated these hypotheses in the context of the face-selective neural network. Over 300 participants, ranging in age from 20 to 89 years, viewed images of faces, houses, and control stimuli in a functional magnetic resonance imaging session. Regions within the core face network and extended face network were identified in individual subjects. Activation in many of these regions became significantly less face-selective with age, confirming previous reports of age-related dedifferentiation. Consistent with the broadening hypothesis, this dedifferentiation in the fusiform face area (FFA) was driven by increased activation to houses. In contrast, dedifferentiation in the extended face network was driven by decreased activation to faces, consistent with the attenuation hypothesis. These results suggest that age-related dedifferentiation reflects distinct processes in different brain areas. More specifically, dedifferentiation in FFA activity may be due to broadening of the tuning curves for face-selective neurons, while dedifferentiation in the extended face network reflects reduced face- or emotion-selective activity.
Introduction
Neural representations become less distinctive with age. This phenomenon of dedifferentiation is thought to reflect a decline in the integrity of the aging brain (Baltes and Lindenberger, 1997; Li et al., 2004). Age-related neural dedifferentiation has been most studied in ventral visual cortex, in which brain regions that are specialized for specific visual categories in young adults show less selectivity in older adults (Park et al., 2004; Chee et al., 2006; Payer et al., 2006). However, the mechanisms underlying such dedifferentiation remain poorly understood.
Neural dedifferentiation could stem from reduced specificity. Neurons that respond selectively to a specific visual category during young adulthood may respond to other visual categories in old age. In other words, dedifferentiation may reflect the broadening of the tuning curves of category-selective neurons (broadening hypothesis). This would manifest as an increased response to nonpreferred visual categories with increasing age, with little change in the response to the preferred category.
Alternatively, dedifferentiation could be driven by a loss of sensitivity. That is, neurons that respond selectively to a specific visual category in young adults may not respond as strongly to that category in older adults (attenuation hypothesis). This would manifest as a decline in the response to the preferred visual category with age, with little change in the response to nonpreferred categories. Of course, these two hypotheses are not mutually exclusive; dedifferentiation could reflect both broadening and attenuation.
In this study, we used functional MRI (fMRI) to investigate age-related neural dedifferentiation in regions of the core and extended face network (Ishai, 2008). As part of the Dallas Lifespan Brain Study, we identified core face-selective regions, including the fusiform face area (FFA), the occipital face area (OFA), and the superior temporal sulcus (STS), as well as other face-selective regions in over 300 subjects by contrasting fMRI activation in response to faces with activation in response to houses. In contrast to previous studies, which have largely focused on young and older adults but neglected middle-aged adults, the present sample included more than 40 subjects in each decade of life, from the 20s to the 80s. This approach allowed us to investigate the complete adult life course of neural dedifferentiation. Consistent with previous studies of age-related neural dedifferentiation (Park et al., 2004; Payer et al., 2006), we found a decline in face selectivity (i.e., face > house) with age in many of these regions. We then tested whether this decline in face selectivity was due to increased house-related activity (broadening), decreased face-related activity (attenuation), or both, in each of these regions.
Materials and Methods
Participant demographics.
Participants were recruited from the Dallas–Fort Worth community for the Dallas Lifespan Brain Study. Participants (n = 318) were distributed equally across each decade of the lifespan from age 20 to 89 years (Table 1). All study procedures were reviewed and approved by the Institutional Review Boards at the University of Texas (UT) at Dallas and the University of Texas Southwestern Medical Center. All participants provided written consent before their participation.
Table 1.
Participant demographics and neuropsychological assessments
| Age decade | n (women) | Years of education | MMSE | General health | Digit comparison | Letter number sequence | Vocabulary |
|---|---|---|---|---|---|---|---|
| 20 | 44 (28) | 16.09 (2.26) | 28.93 (1.23) | 76.82 (14.98) | 73.36 (10.16) | 12.41 (2.76) | 15.78 (5.05) |
| 30 | 48 (30) | 17.60 (2.79) | 28.50 (1.27) | 77.40 (18.88) | 72.88 (14.06) | 12.25 (2.50) | 16.28 (6.64) |
| 40 | 44 (29) | 16.09 (2.77) | 28.55 (1.17) | 80.68 (15.54) | 66.52 (12.49) | 12.16 (3.38) | 17.54 (6.88) |
| 50 | 44 (28) | 17.45 (2.45) | 28.75 (0.94) | 81.74 (17.56) | 67.64 (10.68) | 12.20 (3.47) | 21.53 (6.40) |
| 60 | 45 (27) | 16.98 (2.68) | 28.18 (1.25) | 82.00 (12.99) | 60.67 (12.43) | 11.07 (2.42) | 22.36 (7.02) |
| 70 | 47 (30) | 15.87 (2.86) | 27.91 (1.32) | 82.61 (11.91) | 56.77 (11.25) | 9.83 (2.33) | 20.80 (6.89) |
| 80 | 46 (29) | 15.52 (2.51) | 27.33 (1.10) | 78.48 (15.59) | 49.63 (9.55) | 8.74 (2.26) | 22.05 (6.46) |
Values are means (SDs). General health is self-reported general health ratings and Vocabulary is the Advanced Vocabulary Test I from the Kit of Factor-Referenced Cognitive Tests (Ekstrom et al., 1976).
All participants were right-handed with no self-reported history of neurological or psychiatric illness. Participants with Mini-Mental State Exam (MMSE) scores below 26, a history of chemotherapy in the past five years, coronary bypass, major substance abuse, disorders of the immune system, or any MRI safety contraindications were excluded in the recruitment phase. All participants had corrected visual acuity of 20/30 or better on a Snellen eye chart.
Table 1 summarizes participants' demographics and neuropsychological assessments. MMSE score decreased with age (b = −0.023, t = −6.851, p < 0.001) but overall were high and fell within the range of normal function. Self-reported health did not vary with age (b = 0.066, t = 1.576, p = 0.128). Digit comparison (b = −0.452, t = −13.982, p < 0.001) and letter–number sequence (b = −0.061, t = −7.739, p < 0.001) showed typical age-related decline, and vocabulary scores improved with age (b = 0.118, t = 6.432, p < 0.001). This pattern of decreased fluid ability and increased crystallized knowledge with age is commonly found in the aging literature (Park and Reuter-Lorenz, 2009).
Experimental design.
During an fMRI session, participants passively viewed grayscale images of human faces (ranging in age from 18 to 94 years), houses, and phase-scrambled control images. The control images were created by scrambling the phase information present in all of the experimental stimuli so that the spatial frequency information was otherwise preserved but the visual information was meaningless. Images of nonhuman primates, cats, and chairs were also included, but will not be discussed in this paper. Images were presented in 16 s blocks, at a rate of 2 s per image. Eight blocks of each category were presented across two runs (four blocks per run). The order of the blocks was randomized in each participant. Stimuli were presented via E-prime (Psychology Software Tools) and displayed by a back-projection system. Due to a technical problem, three subjects did not complete the scan and were removed from further analyses.
fMRI data acquisition.
Brain images were acquired with a Philips Achieva 3T whole-body scanner at UT Southwestern using the Philips SENSE parallel acquisition technique. Functional scans were acquired as axial slices, with a voxel size of 3.4 mm × 3.4 mm × 3.5 mm. At each of 148 BOLD acquisitions per run, 43 axial slices were acquired covering the whole brain (TR = 2.0 s, TE = 25 ms, flip angle = 80°). A high-resolution axial T1 MPRAGE scan was also acquired (voxel size, 1 mm isotropic; TR = 8.27 ms, TE = 3.82 ms).
fMRI data analysis.
Functional and anatomical data were processed using SPM5 (Wellcome Department of Cognitive Neurology, London, UK; http://www.fil.ion.ucl.ac.uk) and FreeSurfer 4.4.1 (Martinos Center for Biomedical Imaging; http://surfer.nmr.mgh.harvard.edu). First, the functional images underwent slice-timing correction and realignment to the mean volume, after which the anatomical image was coregistered with the mean functional image. Then, the anatomical image underwent reconstruction in FreeSurfer. This procedure resulted in a surface-based reconstruction of the brain anatomy with identification of gray/white matter boundaries and gyral/sulcal folding patterns. It also yielded a set of parameters that enabled us to map volumetric images onto the surface space. Using these parameters, individual functional images were mapped onto the surface space. These functional images were surface-smoothed using a Gaussian kernel of 8 mm full-width at half-maximum. This FreeSurfer reconstruction process failed in five of the subjects. These subjects were removed from further analyses, leaving a total of 310 participants in the remaining analyses.
The functional images were mapped back onto individual volume space, then fit to the standard general linear model (GLM) with a high-pass filter at 1/128 Hz, correcting for temporal autocorrelation with an AR(1) model. The model included separate regressors for each of the experimental conditions in each run convolved with a canonical hemodynamic response function, as well as six nuisance covariates modeling head movement. This procedure resulted in volumetric brain maps of parameter estimates (β) for the face condition and the house condition in each participant. In addition, t-maps and β-maps for the face > house contrast were created. These volumetric maps were then mapped onto each participant's native surface space. The FreeSurfer reconstruction procedure also provides cortical thickness measures at each cortical point; these measures were subsequently used to control for individual differences in brain structure.
ROIs in the core face network.
The bilateral FFA, OFA, and STS were manually identified in each participant by well trained research assistants who were blind to each participant's age. The search space included the middle fusiform gyrus, lateral occipitotemporal sulcus, and inferior temporal gyrus for the FFA; the inferior occipital gyrus/sulcus and the middle occipital gyrus for the OFA; and the middle portion of the middle temporal gyrus and superior temporal sulcus up to the angular gyrus for the STS. Within these anatomical masks, the largest local peak of the face > house contrast t-map was identified for each region and each subject. Then, a contiguous region (∼200 mm2) surrounding each peak was defined as the ROI. A contiguous region, rather than a spherical region, was primarily used for these manually defined ROIs to preserve individual ROI shapes whenever possible; however, the overall results were qualitatively identical when these ROIs were defined spherically (8 mm radius, ∼200 mm2).
In some subjects, no local peak was identified even at a liberal threshold (t = 1.65; i.e., at the individual level, the following areas were not identifiable: left FFA in 18 subjects, right FFA in 17 subjects, left OFA in 26 subjects, right OFA in 17 subjects, left STS in 48 subjects, and right STS in 23 subjects). In these cases, the peak vertex defined by the group-level face-selective map (see Group-level random-effects analysis, below), remapped from the average surface space to individual surface space, was selected as the peak for that ROI.
Group-level random-effects analysis.
A group-level face-selective map was then constructed in the average surface space to verify the group-level activation patterns (Fig. 1). To accomplish this, intersubject registration was performed using the surface-based atlas by mapping individual cortical folding patterns to the FreeSurfer average curvature map (Fischl et al., 1999). This surface-based approach minimizes potential biases that may result from a template (typically used in volume-based analyses) that is more similar to one age group than to others. Using these intersubject registration parameters, each participant's functional contrast map for the face > house contrast was transformed into a group-level surface space. Then, we conducted a second-level random-effects analysis to identify regions showing greater activation for faces compared with houses across subjects (p < 10−9, uncorrected) while controlling for cortical thickness (Fig. 1). This analysis identified robust activity in the core face network, including bilateral FFA (peaks at −39.8, −44.4, −12.3, and 40.5, −49.0, −11.9), bilateral OFA (peaks at −39.5, −72.7, 5.4, and 41.9, −67.2, 7.0), and bilateral STS (peaks at −50.7, −60.7, 12.1, and 47.6, −44.3, 8.6). Note that all coordinates are in Talairach space.
Figure 1.

Group-level face-selective regions overlaid on an inflated brain surface. Warm colors (red–yellow) show significant face > house activation controlling for cortical thickness; cool colors (shades of blue) indicate the reverse contrast (p < 10−9, uncorrected). LH, Left hemisphere; RH, right hemisphere.
ROIs in the extended face network.
In addition to eliciting activation in the core face regions, faces are also known to elicit neural activations in additional regions that collectively have been termed the “extended face network” (Ishai, 2008). The extended face network includes the amygdala (AMG), the inferior frontal gyrus (IFG), and the orbitofrontral cortex (OFC). These regions, unlike the core face network regions, are typically more difficult to identify at an individual level because their response magnitudes are not as robust as, say, FFA. To investigate age-related dedifferentiation in the extended face network, ROIs were identified in each participant using the group-level face-selective map, thresholded at p < 10−9. Consistent with previous findings (Ishai, 2008), we found face-selective activity in the bilateral IFG (left, peaks at −44.9, 16.1, 7.4 and −45.7, 18.8, 17.1; right, peak at 48.5, 25.3, 3.7). We also observed face-selective activity in the right precentral sulcus (peak at 43.9, 2.5, 37.3) and the bilateral dorsal medial prefrontal cortex (dmPFC; peaks at −7.1, 53.8, 22.5 and 9.3, 54.4, 14.1). We speculate that self-referential processing, possibly associated with viewing faces (Frith and Frith, 2003; Amodio and Frith, 2006), triggered face-selective activity in these regions. ROIs were then defined by a spherical region (8 mm radius) around the peak vertex within the clusters from the group map (Fig. 1). Last, the AMG was defined from each participant's volumetric anatomical image based on the FreeSurfer subcortical segmentation results. Note that we did not observe strong BOLD responses in the OFC, probably due to susceptibility artifacts in this region.
Regression analysis.
In each ROI, we examined face-selectivity (face > house) using a regression model. If age-related neural dedifferentiation exists in the face network, face-selectivity should decrease as a function of age, as a smaller difference between face- and house-related activation is expected in old age. To investigate potential curvilinear relationships between age and face-selectivity, we tested a quadratic model with the mean parameter estimate as a response, mean-centered age and age squared as predictors, and the mean cortical thickness (or volume in the case of AMG) as a covariate. However, age squared was not significant for any ROI (ps > = 0.121), so only the linear term was tested in the rest of the analyses. In Figures 2 and 3, predicted parameter estimates and 95% confidence intervals were plotted against age at the mean cortical thickness level. T-statistics associated with the age regressor are reported in the Results, below.
Figure 2.

A, B, Predicted parameter estimates of face-selective activity (face > house; solid lines) and 95% confidence intervals (dotted lines) as a function of age in the core face network (A) and the extended face network (B). *p < 0.05; **p < 0.01; ***p < 0.001.
Figure 3.
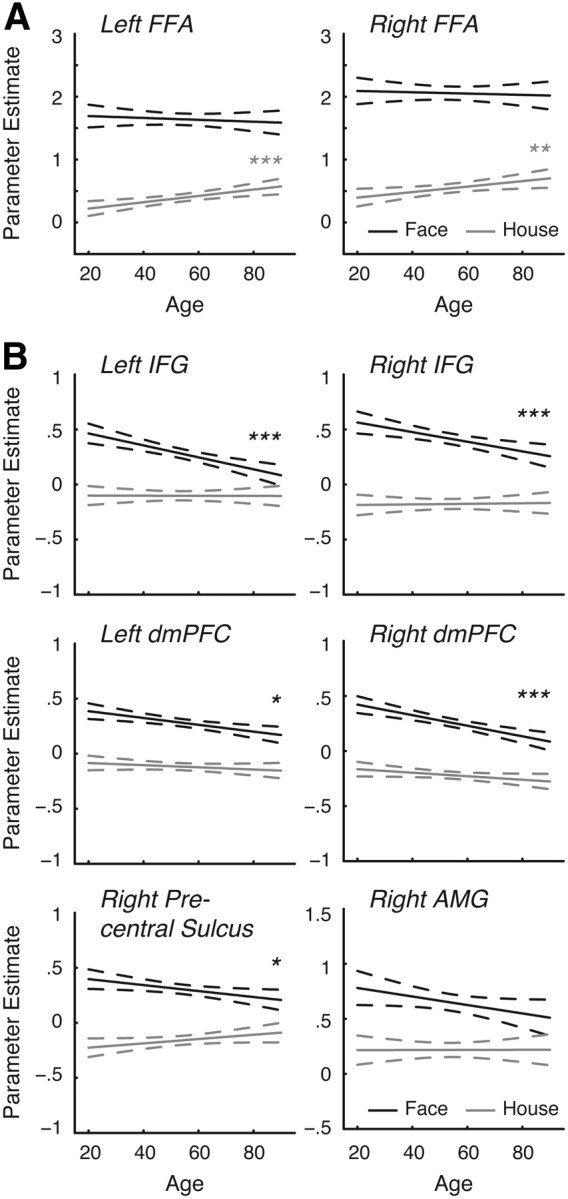
A, B, Predicted parameter estimates of face-related (face > phase-scrambled control; solid black lines) and house-related (house > phase-scrambled control; solid gray lines) activity and 95% confidence intervals (dotted lines) as a function of age in the FFA (A) and ROIs in the extended face network (B). *p < 0.05; **p < 0.01; ***p < 0.001.
Next, in regions showing neural dedifferentiation, we examined face- and house-related activity (face > control and house > control) as a function of age, controlling for cortical thickness. The broadening hypothesis predicts that neural dedifferentiation in face-selectivity is driven by increasing house-related activity but stable face-related activity. In contrast, the attenuation hypothesis predicts that neural dedifferentiation reflects decreasing face-related activity but stable house-related activity.
Results
Dedifferentiation in the face network
We assessed age-related dedifferentiation in the core and extended face networks (Fig. 2). In the FFA, we observed a significant decrease in face-selective activity with increasing age (left, t(307) = −3.364, p = 0.001; right, t(307) = −2.445, p = 0.015), consistent with previous studies of age-related decreases in differentiation in visual cortex. In the OFA, there was a nonsignificant tendency for decreased face-selective activity with age (left, t(307) = −0.891, p = 0.374; right, t(307) = −1.626, p = 0.105). In the STS, face-selective activity did not vary with age (left, t(307) = −0.209, p = 0.834; right, t(307) = −0.015, p = 0.988).
In the extended face network, we found significant age-related decreases in face-selective activity in the left IFG (t(307) = −5.235, p < 0.001), right IFG (t(307) = −4.245, p < 0.001), and right precentral sulcus (t(307) = −4.239, p < 0.001). The bilateral dmPFC also exhibited a significant age-related decrease in face-selective activity (left, t(307) = −2.349, p = 0.020; right, t(307) = −3.406, p = 0.001). Finally, the bilateral AMG showed a tendency for a decrease in face-selective activity with age, but only the right AMG reached statistical significance (left, t(307) = −1.426, p = 0.145; right, t(307) = −2.123, p = 0.035).
The bilateral posterior cingulate cortex also showed significant face-selective activation (peaks at −9.5, −54.1, 33.4 and 6.5, −54.3, 32.1). However, face-selectivity did not vary with age (left, t(307) = 0.582, p = 0.561; right, t(307) = 0.502, p = 0.616).
To assess age differences in condition-independent BOLD variability, we repeated this regression analysis using MSE (mean squared error) of the GLM as a dependent variable. In the core face network, there were no age-related changes in MSE (ps > 0.220 with mean p = 0.510 across six ROIs). In the extended network, there was a significant age-related decrease in MSE in the left IFG (t(307) = −5.578, p < 0.001), right IFG (t(307) = −4.773, p < 0.001), right precentral sulcus (t(307) = −3.689, p < 0.001), left dmPFC (t(307) = −2.829, p = 0.005), and right dmPFC (t(307) = −3.622, p < 0.001), which is generally consistent with a recent report of decreased BOLD variability with age (Garrett et al., 2010). However, MSE increased significantly in the AMG (left, t(307) = 2.034, p = 0.043; right, t(307) = 3.408, p = 0.001), suggesting that age-related changes in BOLD variability may vary across regions.
Broadening versus attenuation
In regions that showed neural dedifferentiation, we examined face- and house-related activity, relative to phase-scrambled control stimuli (Fig. 3), to investigate broadening and attenuation. Consistent with the broadening hypothesis, dedifferentiation in the FFA was driven by increased house-related activity in older subjects (left, t(307) = 3.278, p = 0.001; right, t(307) = 2.387, p = 0.018), rather than decreased face-related activity (left, t(307) = −0.632, p = 0.528; right, t(307) = −0.382, p = 0.703; Fig. 3A).
In contrast, in the extended face network, dedifferentiation stemmed from decreased face-related activity rather than increased house-related activity, consistent with the attenuation hypothesis (Fig. 3B). This pattern was evident in the left IFG (face-related activity: t(307) = −4.635, p < 0.001; house-related activity: t(307) = −0.039, p = 0.969), right IFG (face-related activity: t(307) = −3.357, p = 0.001; house-related activity: t(307) = 0.215, p = 0.830), right precentral sulcus (face-related activity: t(307) = −2.322, p = 0.021; house-related activity: t(307) = 1.760, p = 0.079), left dmPFC (face-related activity: t(307) = −3.309, p = 0.010; house-related activity: t(307) = −1.124, p = 0.262), right dmPFC (face-related activity: t(307) = −4.764, p < 0.001; house-related activity: t(307) = −1.836, p = 0.067), left AMG (face-related activity: t(307) = −1.970, p = 0.050; house-related activity: t(307) = −0.774, p = 0.439), and right AMG (face-related activity: t(307) = −1.891, p = 0.060; house-related activity (right, t(307) = 0.026, p = 0.979).
Discussion
Previous studies have shown age-related dedifferentiation in the neural response to different visual categories. Brain regions that respond relatively selectively in young adults become less selective in old age (Park et al., 2004; Payer et al., 2006), and patterns of brain activation evoked by different visual categories are less distinctive in older than younger adults (Carp et al., 2010, 2011a,b; Park et al., 2010). In this study, we first replicated such findings of age-related dedifferentiation, showing reduced face-selectivity in the FFA and other regions in the extended face network. Furthermore, using a large sample of subjects ranging in age from 20 to 89 years, we investigated neural dedifferentiation across the lifespan. In all regions, we observed linear, but not quadratic, age-related decreases in face-selectivity. These patterns suggest that neural dedifferentiation progresses steadily across the adult lifespan.
We then tested the qualitative nature of dedifferentiation in different regions. We found that age-related dedifferentiation reflected increased responses to nonpreferred stimuli in the FFA, consistent with the broadening hypothesis. In the extended face network, however, age-related dedifferentiation was driven by decreased responses to preferred stimuli, consistent with the attenuation hypothesis.
Broadening of the tuning curves of feature-selective neurons has been identified as a potential mechanism for age-related dedifferentiation in animal studies (Schmolesky et al., 2000; Leventhal et al., 2003). For example, Schmolesky and colleagues (2000) found that while early visual neurons in young macaques responded strongly only to the preferred orientation and direction, neurons in old macaques responded strongly to all orientations and directions. Our results in FFA showing increased neural response to nonpreferred categories with age are consistent with this line of animal studies, and suggest a broadening of the tuning curves of face-selective FFA neurons. A recent human study also reports that older adults, unlike younger adults, show neural adaptation in the FFA when a pair of different faces is presented (Goh et al., 2010). This study suggests that in old age, the pool of neurons that maximally responds to one face also responds to a different face, lending further support to the broadening hypothesis. These results collectively indicate that face-selective neurons in the ventral visual stream may become less selective with age. Based on animal work, one potential mechanism is a decrease in local inhibitory function.
Age-related broadening of tuning curves in the FFA is also compatible with a recent finding in the developmental literature. Cantlon et al. (2011) showed that the development of category-selective responses in ventral visual cortex in young children depends on decreases in cortical responses to nonpreferred visual categories as a function of development. Our results in the FFA show the reverse pattern: age-related dedifferentiation is driven by increased neural responses to nonpreferred stimuli.
In contrast, dedifferentiation in the extended face network is driven by attenuation of category-selective responses. These results are consistent with past findings of reduced BOLD activity (both in magnitude and spatial extent) in older adults (D'Esposito et al., 1999; Buckner et al., 2000; Rypma and D'Esposito, 2000). Also consistent with this result, a recent meta-analysis of the aging literature documented widespread age-related underactivation during perceptual tasks in prefrontal and perceptual brain regions (Spreng et al., 2010). Thus, reduced face-selective responses may represent an overall loss of neuronal responsiveness in frontal brain regions. Attenuated face-selective neural responses in the extended network may also reflect reduced feedforward signals from the FFA (Fairhall and Ishai, 2007).
In sum, although we found evidence for age-related dedifferentiation across a range of face-selective regions, the pattern of dedifferentiation diverged between the core and extended face networks. Specifically, age-related dedifferentiation in the core face network was driven by increased responses to houses, supporting the broadening hypothesis of dedifferentiation; in contrast, dedifferentiation in the extended face network was driven by decreased responses to faces, consistent with the attenuation hypothesis. These results suggest that dedifferentiation may not be a unitary phenomenon: age-related losses of neural selectivity reflect different processes in different regions.
Footnotes
This study was supported by NIH Grant 5R37AG-006265-25 (to D.C.P.).
The authors declare no financial conflicts of interest.
References
- Amodio DM, Frith CD. Meeting of minds: the medial frontal cortex and social cognition. Nat Rev Neurosci. 2006;7:268–277. doi: 10.1038/nrn1884. [DOI] [PubMed] [Google Scholar]
- Baltes PB, Lindenberger U. Emergence of a powerful connection between sensory and cognitive functions across the adult life span: A new window to the study of cognitive aging? Psychol Aging. 1997;12:12–21. doi: 10.1037//0882-7974.12.1.12. [DOI] [PubMed] [Google Scholar]
- Buckner RL, Snyder AZ, Sanders AL, Raichle ME, Morris JC. Functional brain imaging of young, nondemented, and demented older adults. J Cogn Neurosci. 2000;12:24–34. doi: 10.1162/089892900564046. [DOI] [PubMed] [Google Scholar]
- Cantlon JF, Pinel P, Dehaene S, Pelphrey KA. Cortical representations of symbols, objects, and faces are pruned back during early childhood. Cereb Cortex. 2011;21:191–199. doi: 10.1093/cercor/bhq078. [DOI] [PMC free article] [PubMed] [Google Scholar]
- Carp J, Gmeindl L, Reuter-Lorenz PA. Age differences in the neural representation of working memory revealed by multi-voxel pattern analysis. Front Hum Neurosci. 2010;4:217. doi: 10.3389/fnhum.2010.00217. [DOI] [PMC free article] [PubMed] [Google Scholar]
- Carp J, Park J, Polk TA, Park DC. Age differences in neural distinctiveness revealed by multi-voxel pattern analysis. Neuroimage. 2011a;56:736–743. doi: 10.1016/j.neuroimage.2010.04.267. [DOI] [PMC free article] [PubMed] [Google Scholar]
- Carp J, Park J, Hebrank A, Park DC, Polk TA. Age-related neural dedifferentiation in the motor system. PLoS One. 2011b;6:e29411. doi: 10.1371/journal.pone.0029411. [DOI] [PMC free article] [PubMed] [Google Scholar]
- Chee MW, Goh JO, Venkatraman V, Tan JC, Gutchess A, Sutton B, Hebrank A, Leshikar E, Park D. Age-related changes in object processing and contextual binding revealed using fMR adaptation. J Cogn Neurosci. 2006;18:495–507. doi: 10.1162/jocn.2006.18.4.495. [DOI] [PubMed] [Google Scholar]
- D'Esposito M, Zarahn E, Aguirre GK, Rypma B. The effect of normal aging on the coupling of neural activity to the bold hemodynamic response. Neuroimage. 1999;10:6–14. doi: 10.1006/nimg.1999.0444. [DOI] [PubMed] [Google Scholar]
- Ekstrom RB, French JW, Harman HH, Dermen D. Manual for kit of factor-referenced cognitive tests. Princeton, NJ: Education Testing Service; 1976. [Google Scholar]
- Fairhall SL, Ishai A. Effective connectivity within the distributed cortical network for face perception. Cereb Cortex. 2007;17:2400–2406. doi: 10.1093/cercor/bhl148. [DOI] [PubMed] [Google Scholar]
- Fischl B, Sereno MI, Tootell RB, Dale AM. High-resolution intersubject averaging and a coordinate system for the cortical surface. Hum Brain Mapp. 1999;8:272–284. doi: 10.1002/(SICI)1097-0193(1999)8:4<272::AID-HBM10>3.0.CO;2-4. [DOI] [PMC free article] [PubMed] [Google Scholar]
- Frith U, Frith CD. Development and neurophysiology of mentalizing. Philos Trans R Soc Lond B Biol Sci. 2003;358:459–473. doi: 10.1098/rstb.2002.1218. [DOI] [PMC free article] [PubMed] [Google Scholar]
- Garrett DD, Kovacevic N, McIntosh AR, Grady CL. Blood oxygen level-dependent signal variability is more than just noise. J Neurosci. 2010;30:4914–4921. doi: 10.1523/JNEUROSCI.5166-09.2010. [DOI] [PMC free article] [PubMed] [Google Scholar]
- Goh JO, Suzuki A, Park DC. Reduced neural selectivity increases fMRI adaptation with age during face discrimination. Neuroimage. 2010;51:336–344. doi: 10.1016/j.neuroimage.2010.01.107. [DOI] [PMC free article] [PubMed] [Google Scholar]
- Ishai A. Let's face it: it's a cortical network. Neuroimage. 2008;40:415–419. doi: 10.1016/j.neuroimage.2007.10.040. [DOI] [PubMed] [Google Scholar]
- Leventhal AG, Wang Y, Pu M, Zhou Y, Ma Y. GABA and its agonists improved visual cortical function in senescent monkeys. Science. 2003;300:812–815. doi: 10.1126/science.1082874. [DOI] [PubMed] [Google Scholar]
- Li SC, Lindenberger U, Hommel B, Aschersleben G, Prinz W, Baltes PB. Transformations in the couplings among intellectual abilities and constituent cognitive processes across the life span. Psychol Sci. 2004;15:155–163. doi: 10.1111/j.0956-7976.2004.01503003.x. [DOI] [PubMed] [Google Scholar]
- Park DC, Reuter-Lorenz P. The adaptive brain: aging and neurocognitive scaffolding. Annu Rev Psychol. 2009;60:173–196. doi: 10.1146/annurev.psych.59.103006.093656. [DOI] [PMC free article] [PubMed] [Google Scholar]
- Park DC, Polk TA, Park R, Minear M, Savage A, Smith MR. Aging reduces neural specialization in ventral visual cortex. Proc Natl Acad Sci U S A. 2004;101:13091–13095. doi: 10.1073/pnas.0405148101. [DOI] [PMC free article] [PubMed] [Google Scholar]
- Park J, Carp J, Hebrank A, Park DC, Polk TA. Neural specificity predicts fluid processing ability in older adults. J Neurosci. 2010;30:9253–9259. doi: 10.1523/JNEUROSCI.0853-10.2010. [DOI] [PMC free article] [PubMed] [Google Scholar]
- Payer D, Marshuetz C, Sutton B, Hebrank A, Welsh RC, Park DC. Decreased neural specialization in old adults on a working memory task. Neuroreport. 2006;17:487–491. doi: 10.1097/01.wnr.0000209005.40481.31. [DOI] [PubMed] [Google Scholar]
- Rypma B, D'Esposito M. Isolating the neural mechanisms of age-related changes in human working memory. Nat Neurosci. 2000;3:509–515. doi: 10.1038/74889. [DOI] [PubMed] [Google Scholar]
- Schmolesky MT, Wang Y, Pu M, Leventhal AG. Degradation of stimulus selectivity of visual cortical cells in senescent rhesus monkeys. Nat Neurosci. 2000;3:384–390. doi: 10.1038/73957. [DOI] [PubMed] [Google Scholar]
- Spreng RN, Wojtowicz M, Grady CL. Reliable differences in brain activity between young and old adults: A quantitative meta-analysis across multiple cognitive domains. Neurosci Biobehav Rev. 2010;34:1178–1194. doi: 10.1016/j.neubiorev.2010.01.009. [DOI] [PubMed] [Google Scholar]