

Abstract
The main objective of this study is to find out the genetic variation and predisposition of overweight/obese, smoking/alcoholism and thyroid disease traits among tasters and non-tasters in Mysore population, South India. Bitter-taste perception for phenylthiocarbamide (PTC) is a classically variable trait both within and between human populations. Many studies have reported that in world population, approximately 30% of them are PTC non-tasters and 70% are tasters. This investigation was conducted during the year 2009-2010 involving a total 1352 study subjects and divided into three different groups, considering the age ranging from 13 to 50 years. Phenylthiocarbamide taste sensitivity was measured by administering a freshly prepared 0.025% of phenylthiocarbamide solution using the Harris and Kalmus method with a slight modification and the results were recorded. In the first group of 100 obese/overweight children, 28% are taster and 72% are non-taster and among 100 control group 67% are tasters and 43% are non-tasters. In second group, out of 1152 individuals 710 (61.63%) are tasters and 442 (38.37%) are non-tasters including both males and females. In the third group, out of each 100 thyroid patients and the control group, tasters are significantly more frequent (61.41%) than the non-tasters (38.58%) in the control group, but a higher proportion of non-tasters are recorded among individuals with thyroid problems (68%) compared to tasters (32%). There is a significant higher incidence of PTC tasters than non-tasters among general population in this study. As phenotypic variation in PTC sensitivity is genetic in origin, this may represent a surrogate risk factor for the development of multifactorial disease and disorders.
Keywords: Non-taster, obese/overweight, phenylthiocarbamide, smokers, taster, thyroid
INTRODUCTION
Bitter-taste perception for phenylthiocarbamide (PTC) is a classically variable trait both within and between human populations. The sensitivity to this compound has been believed to be a simple Mendelian recessive trait, with tasters defined as having at least one dominant allele TT or Tt and non-tasters displaying a double recessive genotype tt. The strong genetic basis for sensitivity to PTC has been used as a tool to trace family lineages and population migration patterns.[1,2] Many studies have reported that in world population, approximately 30% of them are PTC non-tasters and 70% are tasters.[1,3] The prevalence of taste blindness or an inability to taste bitter chemicals ranges from 3% in West Africa to 6–23% in China, 40% in India, and 30% in US population.[1,4]
A large body of subsequent work tested various hypotheses about the relationship between taste sensitivity and specific phenotypes, such as cancer, smoking behavior, and body mass index (BMI; in kg/m2).[5] A preference for sweet and high-fat food was observed to decrease with increasing perception of bitter taste and further research highlighted relationship between bitter compound tasting ability, BMI, adiposity levels, and risk factors for cardiovascular disease.[6] There are many diseases associated with variations in taste perception. A high incidence of non-tasters has been reported in patients with nodular goiter,[7] congenital arthritic cretinism,[8] and dental caries.[9] Sharma[10] has reported a higher frequency of non-tasters in epileptic twins. Some studies suggested that lipid pathways involved in the etiology of congenital heart disease CHD may be affected by tasting ability, but it was not consistently reported.[11]
Bartels and co-workers[12] on the basis of their own work concluded that sporadic thyroid effects such as simple goitre, hypothyroid, and hyperthyroid states are probably genetically determined. Richter and Clisby[13] noticed marked thyroid hyperplasia in rats which were fed with PTC and subsequent work has established that the thiocarbamides in general are active goitrogenic substances.
Given such evidence, the availability of genetic markers for tasting ability may offer insight into individual's predisposition of childhood obesity, smoking/alcoholism, and thyroid problems. Therefore, PTC can be used as a novel approach to explore the environment interactions with the disease conditions. This study was designed to investigate the association of PTC taster with expression of genetic traits with early-onset of multifactorial diseases.
MATERIALS AND METHODS
The study was carried out in and around Mysore city among different schools and different departments in University of Mysore during July 2009 to February 2010. A total of 1352 study subjects were recruited considering the age group ranging from 13 to 50 years and further categorized into three groups. The questionnaire was designed to collect information about family, personal, and reproductive history if married, health status, food habits, and other necessary information. Subjects having a history of recent respiratory tract infection, drug abuse, and history of head trauma, loss of consciousness, or any other disorders were excluded from the study. The consent was taken from University ethical clearance committee before their inclusion in the study. A method of Harris and Kalmus[14] with slight modification by freshly prepared 0.025% PTC solution was used to assess the PTC tasters and non-tasters. At first with the consent of the subjects, they were requested to rinse their mouth twice with water and asked to taste two drops of PTC solution. If the subject perceives bitter taste, the individual is considered as a taster and if the subject perceives the PTC solution as tasteless or similar to plain water then they are considered as non-tasters. The results were recorded and statistical analysis was carried out.
To generate a case control dataset, tasters and non-tasters were selected randomly from controls and affected population one at a time. Care was taken to maintain similarity in age, ethnicity, socioeconomic backgrounds, etc., between the case–control groups. Statistical analysis was performed using SPSS statistical software version 18.0. The study was carried out in three different groups, and the details are mentioned below.
Group 1
A cross-sectional randomized epidemiological study was done among school children during the year 2009–2010. A total of 2189 children age ranged from 13 to 17 years from rural and urban areas from seven different schools of Mysore city were included. This group was further classified into overweight/obese and control group based on the body mass index (BMI). The body weight was measured without shoes using a weighing machine. The subjects were made to stand straight with heels touching together without any foot wear, and height was measured with an anthropometer rod considering the nearest centimeter (cm) by study volunteers. The BMI was calculated as weight (in kilograms) divided by height (in meter squared). The children whose weight was more than 85th percentile (weight or BMI) for the age and sex were considered as overweight/obese (N = 100).[15] The physical activity was recorded with the help of school curriculum and questionnaire specially designed for this study. Further, they were subjected for PTC taster/non-taster trait analysis to study the correlation between the food preference, obese/overweight, and PTC taste sensitivity.
Group 2
The study was carried out in different departments of University of Mysore during July 2009 to February 2010. Among 3200 postgraduate students, only 1152 students consented to participate voluntarily in this study where 618 were males and 534 were females. The age of the study population ranged between 20 and 24 years. Food preferences such as vegetarian, non-vegetarian, and consumption of beverages, smoking, and alcoholism were recorded with the help of questionnaire specially designed.
Group 3
The study was carried out on 100 subjects with confirmed cases of thyroid problems such as hypothyroidism and hyperthyroidism including 59 males and 41 females. A control group of 100 individuals were included with 58 males and 42 females from Mysore. This study was carried out during July 2009 to February 2010, and the age of study population ranged between 20 and 50 years. PTC taste sensitivity was measured to study the correlation with thyroid-related problems.
RESULTS
Group 1
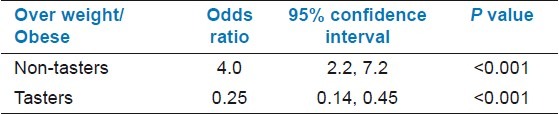
In this study, a significant variation was observed where in the overweight/obese group 28% were tasters and 72% were non-tasters and among the control group 67% were tasters and 43% were non-tasters [Figure 1]. The odds of being overweight in the non-taster group are four times in the taster group. A person being overweight/obese is approximately four times the odds of being non-taster. As odds ratio is reflective, we can also be interlinked that a person being a non-taster is approximately four times the odds of being overweight/obese [Table 1].
Figure 1.
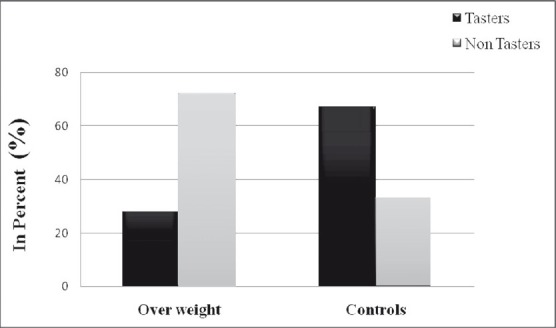
Comparison of tasters and non-tasters in overweight and control groups
Table 1.
Univariate logistic regression analysis of tasters and non-tasters among overweight/obese group
Group 2
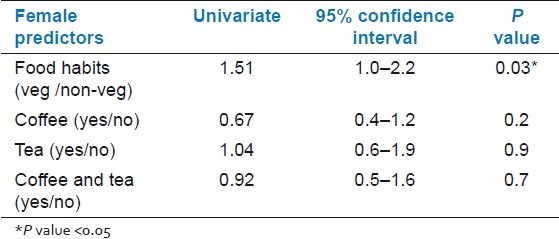
Out of a total number 1152 individuals 710 (61.63%) were tasters and 442 (38.37%) were non-tasters. The consumption of non-vegetarians was recorded more among males than in females. In Table 2, univariate logistic regression analysis in all the male subjects shows that consumption of alcohol and smoking is significant perceivers of non-tasters and food preference showed border significant, however, in females significant perceivers of tasters were observed which can be linked to the preference of vegetarian diet. Vegetarians were 1.44 times more likely to be tasters than non-vegetarians in males and in females 1.51 times more likely to be tasters [Table 3]. Tea consumers were more likely to be tasters in females. Smokers, alcoholics, coffee, and tea consumers were recorded as non-tasters in males. In this study, female smokers and alcoholics were not observed.
Table 2.
Univariate logistic regression analysis of males with respect to food and other habits
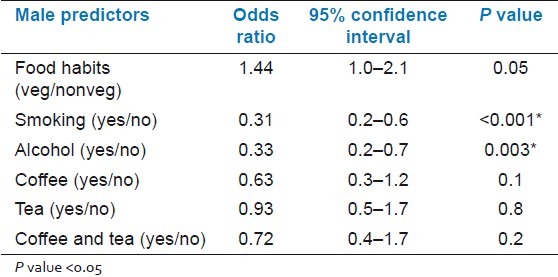
Table 3.
Univariate logistic regression analysis of females with respect to food and other habits
Group 3
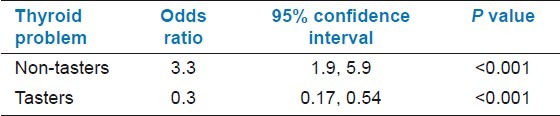
The frequency of tasters is significant, i.e., 61.41% than the non-tasters 38.58% in the control group but, a higher proportion of non-tasters were found in people with thyroid problems (68%) compared to tasters (32%). The 95% confidence interval for the effect of PTC non-tasters on thyroid was significant and shows the comparison of tasters and non-tasters trait for food habits in control taster is approximately 3.3 times the odds of being thyroidic. As odds ratio is reflective, we can also interpret as a person being a taster is approximately 0.3 t imes the odds of being thyroidic [Table 4].
Table 4.
Univariate logistic regression analysis of taster and non-taster individuals with respect to thyroid problems
DISCUSSION
There is a significant higher incidence of PTC tasters than non-tasters among general population in this study which supports other studies.[1,3] This genetic trait is of epidemiologic and evolutionary interest and has been shown to correlate with a number of dietary preferences and thus have important implications on human health.[16,17,18] A strong correlation exists between non-tasters and overweight/obesity condition in this study. Additionally, the fast/junk foods tend to be low in fiber, micronutrients, and antioxidants which are responsible for weight gain.[19] People who can taste PTC are more sensitive to salt, sweet, sharp tasting, and spicy food.[20] Anatomical studies show that tasters have more taste buds than non-tasters. Tasting ability is also likely to be influenced by many other sensory and proprioreceptive pathways, and the probable result is that no single genetic marker has a greater effect. In particular, other pathways are likely to include olfactory contributions to food preference, although digestive and cognitive factors may also complicate the overall system and modify the ability to perceive bitter taste. Hence, non-tasters are more prone for overweight/obesity problems. In our study, the non-tasters, who are less taste sensitive to the bitterness of cigarettes, are more at risk for heavy smoking and therefore vulnerable to nicotine addiction which correlates with past studies.[21] Although PTC is not available naturally, the ability to taste PTC strongly correlates with the ability to taste other naturally occurring bitter substances many of which are toxic and may have adverse health effects.[9,22]
As for the relationship between PTC and thyroid diseases reported,[23,12] our results in relation with thyroidism supports significant association with non-taster trait. Kitchin and co-workers[24] suggested that the inability to taste PTC is associated with a greater susceptibility of the thyroid tissue to the action of goitrogens of a similar chemical type leading to cycles of involution or hyperplasia and eventually to multinodular goiter. In contrast, the less sensitive tasters and non-tasters of PTC may intake greater quantities of goitrogens present in edible plants which may increase the stress on the thyroid glands, thus increasing the chance of intermittent hypothyroidism.[25] Mourant in 1983[26] suggested a balanced polymorphism to the two allelic ‘T’ and ‘t’ genes, based on the levels of iodine and thyroid inhibitors in the diet so that, if iodine is less or if inhibitors are in excess, tasters will be selectively favored, whereas, if there is an excess of iodine or lack of inhibitors, non-tasters will be favored due to the production of less active peroxidase by non-tasters when compared to tasters. The prevalence of PTC tasters is high in control population compared to non-tasters in our study in accordance with other studies. The overall taster and non-taster traits in relation to different parameters with respect to male and females are summarized in Figures 2 and 3.
Figure 2.
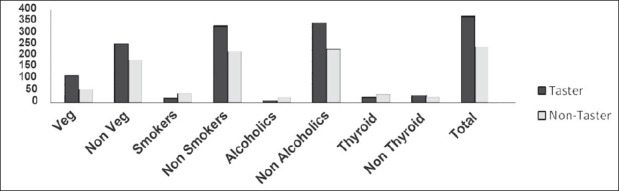
Sensitivity to PTC in males observed in different categories
Figure 3.
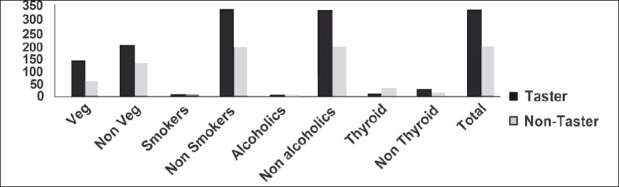
Sensitivity to PTC in females observed in different categories
CONCLUSION
There was a high significant incidence of tasters found in general population which is in accordance with the Fisher hypothesis of natural selection and favors selection of a taster trait where inheritance pattern flows in an autosomal dominant type. The inability to taste PTC is associated with a greater susceptibility of overweight/obesity due to indiscrimination of fat diet, spicy, and oily food. In contrast, the tasters were not susceptible for smoking, alcoholic addiction due to unpleasant taste sensation of alcoholic beverages and bitterness taste in cigarettes. There is high prevalence of thyroidism among the non-tasters those who consume more of goiterogenous substances which occur naturally are toxic in nature and may be one of the possible risk factor in causing hyperthyroidism. From this study, we support that the natural selection is playing a key role in limiting the selection of disease susceptible traits.
ACKNOWLEDGMENTS
The authors are thankful to the volunteers and study subjects for their kind participation and cooperation during this study. We would also like to thank the lab members and Mr. Rajesh, Epidemiology Research Unit, Holds-worth Memorial Hospital, Mysore, for help during the preparation of manuscript.
Footnotes
Source of Support: Nil.
Conflict of Interest: None declared.
REFERENCES
- 1.Guo SW, Reed DR. The genetics of phenylthiocarbamide perception. Ann Hum Biol. 2001;28:111–42. doi: 10.1080/03014460151056310. [DOI] [PMC free article] [PubMed] [Google Scholar]
- 2.Mattes RD. 6-n-propylthiouracil taster status: Dietary modifier, marker, or misleader? In: Prescott J, Tepper BJ, editors. Genetic variation in taste sensitivity. New York: Marcel Dekker, Inc; 2004. pp. 229–50. [Google Scholar]
- 3.Drayna D. Human taste genetics. Annu Rev Genomics Hum Genet. 2005;6:217–35. doi: 10.1146/annurev.genom.6.080604.162340. [DOI] [PubMed] [Google Scholar]
- 4.Tepper BJ. 6-n-Propylthiouracil: A genetic marker for taste, with implications for food preference and dietary habits. Am J Hum Genet. 1998;63:1271–76. doi: 10.1086/302124. [DOI] [PMC free article] [PubMed] [Google Scholar]
- 5.Enoch MA, Harris CR, Goldman D. Does a reduced sensitivity to bitter taste increase the risk of becoming nicotine addicted? Addict Behav. 2001;26:399–404. doi: 10.1016/s0306-4603(00)00117-9. [DOI] [PubMed] [Google Scholar]
- 6.Duffy VB, Bartoshuk LM. Food acceptance and genetic variation in taste. J Am Diet Assoc. 2000;100:647–55. doi: 10.1016/S0002-8223(00)00191-7. [DOI] [PubMed] [Google Scholar]
- 7.Facchini F, Abbati A, Campagnoni S. Possible relations between sensitivity to phenylthiocarbamide and goiter. Hum Biol. 1990;62:545–52. [PubMed] [Google Scholar]
- 8.Fraser GR. Cretinism and taste sensitivity to phenylthiocarbamide. Lancet. 1961;280:964–65. doi: 10.1016/s0140-6736(61)91881-5. [DOI] [PubMed] [Google Scholar]
- 9.Rupesh S, Nayak UA. Genetic sensitivity to the bitter taste of 6-n propylthiouracil: A new risk determinant for dental caries in children. J Indian Soc Pedod Prev Dent. 2006;6:63–8. doi: 10.4103/0970-4388.26018. [DOI] [PubMed] [Google Scholar]
- 10.Sharma K. Genetic epidemiology of epilepsy: A twin study. Neurol India. 2005;53:93–8. doi: 10.4103/0028-3886.15070. [DOI] [PubMed] [Google Scholar]
- 11.Drewnowski A. 6-n–Propylthiouracil sensitivity, food choices, and food consumption. In: Tepper B, Prescott J, editors. Genetic variation in taste sensitivity. New York: Marcel Dekker Inc; 2004. pp. 179–195. [Google Scholar]
- 12.Bartels EC. Post-thyroidectomy myxedema after preoperative use of antithyroid drugs. J Clin Endocrinol Metab. 1953;13:95–106. doi: 10.1210/jcem-13-1-95. [DOI] [PubMed] [Google Scholar]
- 13.Ricther CP, Clisby KH. Toxic effects of bitter-tasting phenylthiocarbamide. Arch Pathol. 1942;33:46–57. [Google Scholar]
- 14.Harris H, Kalmus H. Genetical differences in taste sensitivity to phenylthiourea and to anti-thyroid substances. Nature. 1949;163:878–9. doi: 10.1038/163878b0. [DOI] [PubMed] [Google Scholar]
- 15.National Center for Health Statistics, Atlanta, CDC growth charts: United States Advance data from vital and health statistics. No.314. 2000 [Google Scholar]
- 16.Bartoshuk LM, Duffy VB, Miller IJ. PTC/PROP tasting: Anatomy, psychophysics, and sex effects. Physiol Behav. 1994;56:1165–71. doi: 10.1016/0031-9384(94)90361-1. [DOI] [PubMed] [Google Scholar]
- 17.Bufe B, Breslin PA, Kuhn C, Reed DR, Tharp CD, Slack JP, et al. The molecular basis of individual differences in phenylthiocarbamide and propylthiouracil bitterness perception. Curr Biol. 2005;15:322–27. doi: 10.1016/j.cub.2005.01.047. [DOI] [PMC free article] [PubMed] [Google Scholar]
- 18.Hu FB, Van Dam RM, Liu S. Diet and risk of type II diabetes: The role of types of fat and carbohydrate. Diabetologia. 2001;44:805–17. doi: 10.1007/s001250100547. [DOI] [PubMed] [Google Scholar]
- 19.Bevely J, Tepper BJ. 6-n-Propylthiouracil: A Genetic marker for Taste, with Implication for Food Preference and dietary Habits. Am J Hum Genet. 1998;63:1271–76. doi: 10.1086/302124. [DOI] [PMC free article] [PubMed] [Google Scholar]
- 20.Enoch MA, Harris CR, Goldman D. Does a reduced sensitivity to bitter taste increase the risk of becoming nicotine addicted? Addict Behav. 2001;26(3):399–404. doi: 10.1016/s0306-4603(00)00117-9. [DOI] [PubMed] [Google Scholar]
- 21.Barnicot NA, Harris H, Kalmus H. Taste thresholds of further eighteen compounds and their correlation with PTC thresholds. Ann Eugen. 1951;16:119–28. doi: 10.1111/j.1469-1809.1951.tb02464.x. [DOI] [PubMed] [Google Scholar]
- 22.Tepper BJ. 6-n-Propylthiouracil: A genetic marker for taste, with implications for food preference and dietary habits. Am J Hum Genet. 1998;63:1271–76. doi: 10.1086/302124. [DOI] [PMC free article] [PubMed] [Google Scholar]
- 23.Sheppard TH, Gartler SM. Increased incidence of non-tasters of phenylthiocarbamide among congenital athyreotic cretins. Science. 1960:131–929. doi: 10.1126/science.131.3404.929. [DOI] [PubMed] [Google Scholar]
- 24.Kitchin FD, Howel-Enva W, Clarke CA, Connell RR, Sheppard PM. PTC taste response and thyroid disease. Brit Med J. 1959;1:1069–74. doi: 10.1136/bmj.1.5129.1069. [DOI] [PMC free article] [PubMed] [Google Scholar]
- 25.Wooding S. Phenylthiocarbamide - A 75-Year Adventure in Genetics and Natural Selection. Genetics. 2006;172:2015–23. doi: 10.1093/genetics/172.4.2015. [DOI] [PMC free article] [PubMed] [Google Scholar]
- 26.Mourant AE. Oxford, UK: Oxford University Press; 1983. Blood Relations, Blood Groups and Anthropology. [Google Scholar]