Abstract
Cellular cholesterol homeostasis is increasingly being recognized as an important determinant of the inflammatory status of macrophages, and a decrease in cellular cholesterol levels polarizes macrophages toward an anti-inflammatory or M2 phenotype. Cholesteryl ester hydrolase (CEH) catalyzes the hydrolysis of stored intracellular cholesteryl esters (CE) and thereby enhances free cholesterol efflux and reduces cellular CE content. We have reported earlier reduced atherosclerosis as well as lesion necrosis and improved insulin sensitivity (due to decreased adipose tissue inflammation) in macrophage-specific CEH transgenic (CEHTg) mice in the LDLR−/− background. In the present study, we examined the effects of reduced intracellular accumulation of CE in CEHTg macrophages in an established diabetic mouse model, namely the leptin-deficient ob/ob mouse. Macrophage-specific transgenic expression of CEH improved glucose tolerance in ob/ob-CEHTg mice significantly compared with ob/ob nontransgenic littermates, but with no apparent change in macrophage infiltration into the adipose tissue. However, there was a significant decrease in hepatic lipid accumulation in ob/ob-CEHTg mice. Consistently, decreased [14C]acetate incorporation into total lipids and triglycerides was noted in precision-cut liver slices from ob/ob-CEHTg mice. In the primary hepatocyte-macrophage coculture system, macrophages from CEHTg mice significantly reduced the incorporation of [14C]acetate into triglycerides in hepatocytes, indicating a direct effect of macrophages on hepatocyte triglyceride biosynthesis. Kupffer cells isolated from ob/ob-CEHTg mice were polarized toward an anti-inflammatory M2 (Ly6Clo) phenotype. Taken together, these studies demonstrate that transgenic overexpression of CEH in macrophages polarizes hepatic macrophages (Kupffer cells) to an anti-inflammatory M2 phenotype that attenuates hepatic lipid synthesis and accumulation.
Keywords: macrophage phenotype and inflammatory status, cell-to-cell interaction, coculture
macrophage cholesterol homeostasis is central to foam cell formation and development of atherosclerotic plaques. Although contribution of macrophage foam cells to the growing lipid core of the plaque is well established, the role of these foam cells in regulating plaque-associated inflammation is increasingly being recognized. The increase in intracellular cholesteryl esters (CE) within macrophages is an important determinant of the inflammatory status of macrophages, and Fazio and Linton (14) proposed a feedback loop where defects in cellular cholesterol balance induced changes in production of inflammatory mediators. Consistently, an increase in cellular cholesterol content by deficiency of cholesterol transporter ATP-binding cassette transporter A1 leads to an increase in TNFα secretion from macrophages (22), and cholesterol acceptor apolipoprotein (apo)A1-mediated increase in removal of cellular cholesterol decreases proinflammatory insult by LPS (25). Changes in the inflammatory status of macrophages subsequently lead to systemic inflammation and contribute to other pathologies associated with chronic low-grade inflammation, such as type 2 diabetes mellitus (T2DM). Cholesterol-mediated changes also affect the infiltration of macrophages into other tissues, and Subramanian et al. (36) reported recently that the addition of a relatively small amount (0.15%) of dietary cholesterol resulted in a marked increase in accumulation of macrophages in adipose tissue. Since a majority of adipose tissue-derived cytokines (TNFα, IL-6, and IL-1β) actually originate in nonfat cells, and among them infiltrated macrophages play the most prominent role (7), increased activation and recruitment of macrophages into the expanding adipose tissue also lead to increased adipose tissue and systemic inflammation. Collectively, these studies underscore the importance of macrophage cholesterol homeostasis in regulating diseases associated with chronic inflammation.
Toward the goal of altering macrophage cholesterol homeostasis, we developed transgenic mice with macrophage-specific overexpression of CE hydrolase (CEH). Macrophages from these mice stored less CE as a result of CEH-mediated CE mobilization, and this led to a significant attenuation of diet-induced atherosclerosis in LDLR−/− background (39). Recently, we also demonstrated attenuated expression of proinflammatory mediators and decreased activation of proinflammatory transcription factors in macrophages with transgenic overexpression CEH. This led to decreased infiltration of macrophages into the adipose tissue and reduced systemic inflammation together contributing to improved insulin sensitivity (5). The present study was undertaken to test the hypothesis that CEH-mediated decrease in CE accumulation in macrophages will also improve glucose tolerance in an established model of obesity and diabetes, namely the leptin-deficient ob/ob mice. Macrophage-specific CEH transgenic (CEHTg) mice were crossed into ob/ob background, and effects on glucose tolerance were determined. The data presented here demonstrate that, consistent with the ob/ob mouse model where increased hepatic lipid accumulation is responsible for the insulin resistance phenotype (13), CEH-dependent changes in the macrophage/Kupffer cell phenotype significantly reduced hepatic lipid accumulation and also led to significantly improved glucose tolerance.
EXPERIMENTAL PROCEDURES
Animals and diets.
Development and characterization of macrophage-specific CEHTg mice has been described elsewhere (39), and in this model human CEH is expressed exclusively in macrophages (circulatory and resident) and leads to a twofold increase in total intracellular CE hydrolysis. CEHTg mice on the C57BL/6 background were crossed into the ob/ob background (obtained from Jackson Laboratories). Littermates with or without CEH transgene in ob/ob background (ob/ob-CEHTg and ob/ob) were used for all of the studies. Where indicated, mice were fed a 0.2% cholesterol-containing diet (TD99399; Harlan Teklad) for 4 wk.
Intraperitoneal glucose tolerance tests.
Four-week-old ob/ob and ob/ob-CEHTg littermates were fed a 0.2% cholesterol-containing diet for 4 wk. After an overnight fast, a single bolus of glucose (0.5 mg/g body wt) was given intraperitoneally. Blood glucose levels were determined by commercially available glucometer using tail vein blood at 0, 15, 30, 60, and 120 min. Data are expressed as means ± SD for six animals/genotype.
Primary hepatocyte and macrophage coculture.
Hepatocyte-macrophage cocultures were used to model hepatocyte-Kupffer cell interactions, as described by Odegaard et al. (30). Thioglycollate-elicited peritoneal macrophages were harvested, and 1 × 10⁶ cells were plated in 0.4-μm cell culture Transwells (Millipore). Nonadherent cells were removed after 2 h, and medium was replaced with fresh growth medium (39). Primary hepatocytes were isolated and plated in 12-well cell culture plates coated with collagen (32). After an overnight incubation, Transwells containing macrophages were placed in the wells containing hepatocytes, and these indirect cocultures were incubated for an additional 24 h. To monitor the incorporation of [14C]acetate into triglycerides (TG), medium was supplemented with 2 mM [14C]acetate (2). Total lipids were extracted at the end of 24 h, and neutral lipids were separated by TLC using hexane-diethyl ether-acetic acid (90:10:1, vol/vol). Spots corresponding to TG, monoglyceride plus diglyceride (MG + DG), and phospholipids (PL) were marked and silica gel scrapped, and associated radioactivity was determined by liquid scintillation counting. To determine the effect of macrophages on hepatocyte gene expression, indirect cocultures were set up as described above, and at the end of 24 h, total hepatocyte RNA was isolated (using RNeasy Kit from Qiagen) and expression of different genes monitored by quantitative RT-PCR.
Measurement of de novo TG synthesis in liver slices.
Livers were harvested from ob/ob and ob/ob-CEHTg mice, and precision-cut liver slices were incubated with [14C]acetate for 3 h (2). Following three washes in PBS, total lipids were extracted and neutral lipids separated by TLC using hexane-diethyl ether-acetic acid (90:10:1, vol/vol). Spots corresponding to TG were marked and silica gel scrapped, and associated radioactivity was determined by liquid scintillation counting.
Real-time PCR.
Total RNA was extracted using RNeasy kit (Qiagen). Complementary DNA was synthesized using High Capacity cDNA reverse transcription Kit (Applied Biosystems). Real-time PCR was performed on a Stratagene Mx3000P machine using TaqMan Universal PCR Master Mix and optimized probe and primer sets from Applied Biosystems. The following probes were used: CD36, Mm00432403_m1; G6PC, Mm00839363-m1; PCK1, Mm01247058-m1; microsomal triglyceride transfer protein (Mttp), Mm00435015_m1; fatty acid-binding protein (Fabp)5, Mm00783731_s1; Fabp1, Mm00444340_m1; fatty acid synthase (FAS), Mm00662319_m1; apob, Mm01545156_m1; CD68, Mm00839636_g1; and Msr1, Mm00446214_m1.
Histological and biochemical analyses of liver tissue.
A small piece of liver was fixed in buffered formalin and paraffin embedded, and three to four sections (5 μm thick) were transferred to numbered slides. Slides were then stained with hematoxylin and eosin (H & E). Images were acquired using a Zeiss Observer A1 inverted microscope and analyzed using AxioVision Software. About 100 mg of fresh liver tissue was homogenized in PBS, and total lipids were extracted by the method of Bligh and Dyer (6). The amounts of total cholesterol, CE, and TG were determined and normalized to wet weight.
Kupffer cell isolation and analysis.
Kupffer cells were isolated as described (27). Freshly isolated cells were resuspended in fluorescence-activated cell sorter (FACS) buffer containing Fc block and incubated with fluorescently labeled antibodies for 20 min at 4°C. After washing, specific immunofluorescent staining of individual cells was detected by flow cytometry (Canto II, BD Biosciences), and the data were analyzed using FlowJo (Tree Star) software. The following antibodies were used: anti-mouse CD45-PE (leukocytes), anti-mouse CD11b-PerCP-Cy5.5 (macrophages), anti-mouse Ly6C-APC, and the respective isotype controls (all antibodies were obtained from eBiosciences). Distribution of CD45+CD11b+Ly6C+ cells into Ly6CHi and Ly6Clo was determined as described before (4).
TG secretion rates.
Mice were fasted overnight, and a baseline blood sample was collected via the tail vein. Mice were subsequently injected with Tyloxapol (Sigma-Aldrich) at a concentration of 500 mg/kg body wt to inhibit lipoprotein lipase. Blood samples were subsequently collected at 1, 2, and 3 h postinjection and plasma TG levels determined (L-Type TG-M kit; Wako Diagnostics). TG production rates were calculated as described (11).
Plasma analyses.
Fasting plasma was collected and used to determine cytokine levels (BD Cytometric Bead Array kit), nonesterified fatty acids (NEFA; NEFA-HR kit; Wako Diagnostics), insulin levels (Mouse Ultrasensitive Mouse Insulin ELISA kit; Crystal Chem), and lipoprotein profiles, as described earlier (39).
RESULTS
Macrophage-specific transgenic expression of CEH does not significantly alter the basal metabolic profile.
Table 1 summarizes the basal metabolic profiles for ob/ob and ob/ob-CEHTg mice. Macrophage-specific transgenic expression of CEH in ob/ob-CEHTg mice did not affect the body weight, fasting plasma blood glucose, or insulin levels. Consistent with our earlier data on the LDLR−/− background, fasting plasma lipoprotein profiles were not significantly different, and cholesterol associated with the different plasma lipoprotein fractions was also not affected (39). However, in contrast to the LDLR−/− background where transgenic expression of CEH significantly attenuated plasma cytokine levels (5), in the ob/ob background there was no significant change in circulating cytokine levels, indicating no effect on systemic inflammation.
Table 1.
Comparison of metabolic parameters of ob/ob and ob/ob-CEHTg mice
| Parameters | ob/ob | ob/ob-CEHTg | P Value |
|---|---|---|---|
| Body weight, g | 49.21 ± 1.91 | 44.73 ± 1.83 | 0.10 |
| Fasting glucose, mg/dl | 197.15 ± 19.23 | 218.00 ± 25.03 | 0.51 |
| Plasma insulin, ng/ml | 4.16 ± 1.22 | 4.41 ± 1.26 | 0.71 |
| Plasma cytokines, pg/ml | |||
| IFNγ | 17.0 ± 2.9 | 16.18 ± 2.87 | 0.87 |
| IL-6 | 57.91 ± 1.77 | 32.98 ± 8.9 | 0.08 |
| MCP-1 | 669.29 ± 70.11 | 672.02 ± 135.69 | 0.99 |
| GM-CSF | 96.82 ± 18.63 | 131.37 ± 12.30 | 0.39 |
| TNF | 118.92 ± 16.63 | 134.90 ± 6.40 | 0.47 |
| Plasma cholesterol, mg/dl | |||
| TC | 233.58 ± 14.01 | 235.33 ± 15.86 | 0.82 |
| VLDL | 4.98 ± 1 | 5.82 ± 1.48 | 0.63 |
| LDL | 43.41 ± 8.93 | 50.57 ± 10.15 | 0.57 |
| HDL | 193.46 ± 7.14 | 178.76 ± 7.30 | 0.27 |
Data are means ± SE.
CEHTg, cholesterol ester hydrolase transgenic; MCP-1, monocyte chemoattractant protein-1; GM-CSF, granulocyte macrophage colony-stimulating factor; TC, total cholesterol.
Macrophage-specific transgenic expression of CEH improves glucose tolerance.
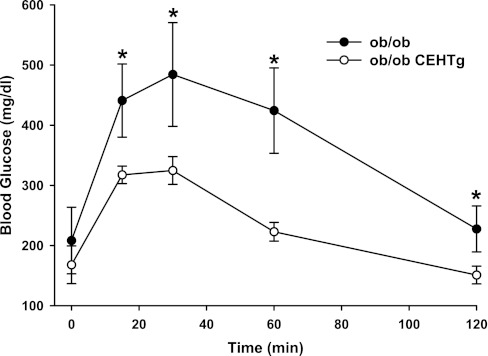
Earlier, we reported an increase in insulin sensitivity in LDLR−/−-CEHTg mice where decreased systemic and adipose tissue inflammation was found to be the underlying mechanism (5). To assess the effects of macrophage-specific transgenic expression of CEH on the ob/ob background, intraperitoneal glucose tolerance tests were performed in 0.2% cholesterol-containing diet-fed ob/ob and ob/ob-CEHTg mice. As shown in Fig. 1, significant improvement in glucose tolerance was noted in ob/ob-CEHTg mice. However, unlike LDLR−/−-CEHTg, where a significant reduction in infiltration of macrophages into the adipose tissue was observed and was established as the underlying mechanism for the improved insulin sensitivity in these mice, no change in macrophage infiltration was noted between ob/ob and ob/ob-CEHTg mice as assessed by macrophage-specific gene expression (CD-68 or SR-A) in adipose tissue (see Fig. 7D) or by direct histological examination (data not shown). Taken together with no change in plasma cytokine levels, these data suggest that macrophage-specific transgenic expression of CEH on the ob/ob background did not alter systemic or adipose tissue inflammation.
Fig. 1.
Intraperitoneal glucose tolerance test: 4-wk-old ob/ob and ob/ob-cholesterol ester hydrolase transgenic (CEHTg) mice (littermates) were fed chow diet supplemented with 0.2% cholesterol for an additional 4 wk. After an overnight fast, blood glucose levels at time 0 were determined using a commercial glucometer. Subsequently, mice were given an intraperitoneal bolus of glucose (0.5 mg/g body wt), and blood glucose levels were determined at indicated times. Data are expressed as means ± SD; n = 6. *P < 0.05.
Fig. 7.
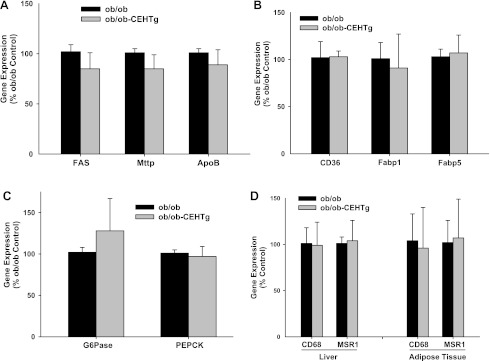
Changes in the expression of genes involved in TG synthesis and secretion, fatty acid uptake and transport, and gluconeogenesis in liver. A–C: total liver RNA was extracted and expression of indicated genes monitored by real-time qPCR using specific Taqman Assays. β-Actin was used as the housekeeping gene, and data are expressed as %ob/ob control (means ± SD; n = 5). D: expression of genes in adipose tissue is also shown.
CEH overexpression leads to attenuation of hepatic lipid accumulation.
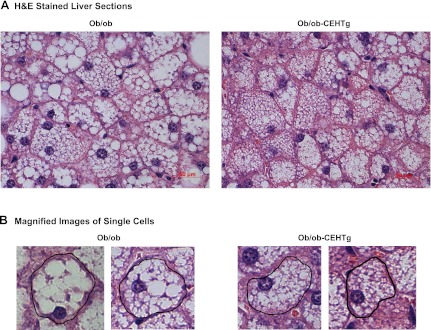
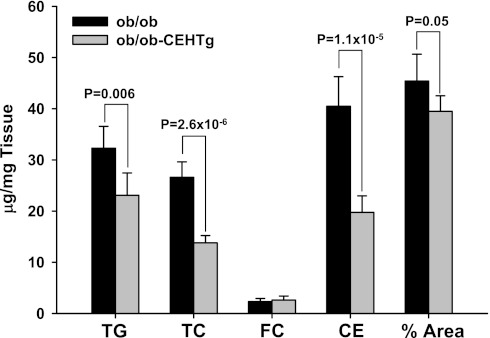
The most noticeable difference between ob/ob and ob/ob-CEHTg mice was the gross appearance of the liver, and therefore, histological and biochemical methods were used to determine changes in hepatic lipid accumulation. H & E-stained sections of livers were imaged; representative images are shown in Fig. 2. Lipid accumulation is attenuated dramatically in livers of ob/ob-CEHTg mice compared with those of ob/ob, and individual cells appear to be filled completely with lipid in liver from ob/ob mice (Fig. 2B). The images were analyzed by Axiovision software to determine the area occupied by lipid, and as shown in Fig. 3, the percent area occupied by lipids was reduced significantly in ob/ob-CEHTg mice. Consistently, there was a significant decrease in hepatic TG, total cholesterol, and CE content (Fig. 3) in these animals. These data suggest that transgenic expression of CEH in Kupffer cells (or hepatic macrophages) attenuates lipid accumulation in liver/hepatocytes.
Fig. 2.
Reduced lipid accumulation in ob/ob-CEHTg mice. Histological analyses: a portion of liver was fixed and paraffin embedded, and 5-mm-thick sections were stained with hematoxylin and eosin (H & E). A: representative images. White unstained regions within the cell represent the area occupied by the lipid. B: magnified images of single cells.
Fig. 3.
Reduced lipid accumulation in ob/ob-CEHTg mice. Biochemical analysis: total lipids were extracted from a known amount of liver tissue (∼100 mg). Triglyceride (TG) content was determined enzymatically, and total cholesterol (TC), free cholesterol (FC), and cholesterol ester (CE) content were determined by gas chromatography. Lipid content was normalized to the weight of liver used and expressed as μg/mg tissue weight. Magnified H & E-stained images (Fig. 2B) were analyzed to determine the %area of the cell occupied by lipid. Data are shown as means ± SD; n = 6, and individual P values for the differences between groups are indicated.
Attenuation of hepatic TG synthesis by CEHTg Kupffer cells/macrophages.
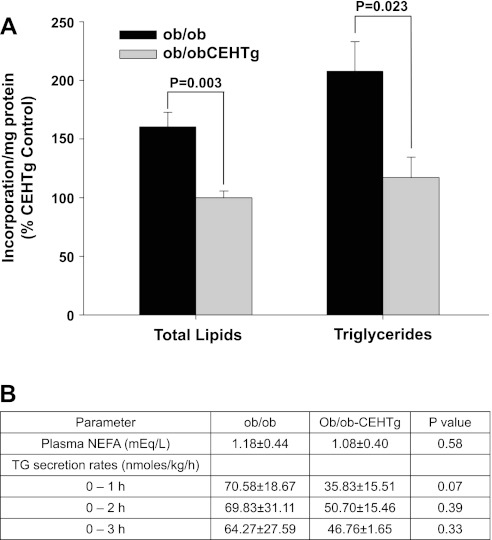
To evaluate the effects of macrophage-specific transgenic expression of CEH on hepatic TG synthesis, two different approaches were used. First, TG synthesis was examined in precision-cut liver slices by monitoring [14C]acetate incorporation. In liver slices from ob/ob-CEHTg mice, there was a significant attenuation of [14C]acetate incorporation in total lipids as well as TG (Fig. 4A), demonstrating reduced lipid synthesis. To examine whether increased secretion of TG may also contribute to the observed decrease in hepatic TG levels, TG secretion rates were monitored. There was no significant increase in TG secretion in ob/ob-CEHTg mice (Fig. 4B). Since hepatic TG synthesis is affected by circulating fatty acids predominantly released by lipolysis of TG in the adipose tissue, plasma levels of nonesterified fatty acids were also measured. No significant difference was noted between ob/ob and ob/ob-CEHTg mice (Fig. 4B).
Fig. 4.
Decreased de novo TG synthesis in liver slices from ob/ob-CEHTg mice. A: incorporation of [14C]acetate into total lipids and TG was determined as described in experimental procedures. Incorporation into each lipid fraction was normalized to total protein; data are expressed as %ob/ob-CEHTg control (means ± SD; n = 6), and individual P values for the differences between groups are indicated. B: nonesterified fatty acid (NEFA) levels in plasma and TG secretion rates were determined as described in experimental procedures. Data are presented as means ± SD; n = 6, and individual P values for the differences between groups are indicated.
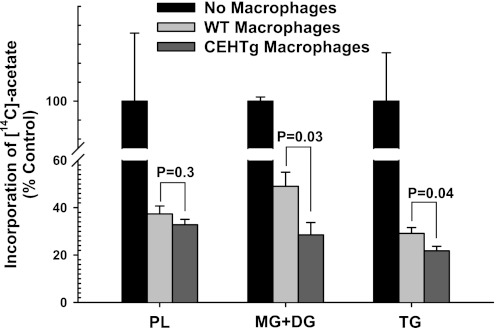
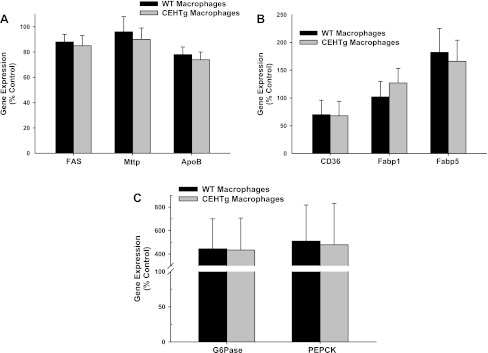
To evaluate the direct effects of CEHTg macrophages/Kupffer cells on hepatic TG synthesis, freshly isolated hepatocytes were cocultured with macrophages, and incorporation of [14C]acetate into neutral lipids was monitored. There was a significant decrease in [14C]acetate incorporation in PL, MG + DG, and TG when hepatocytes were cocultured with macrophages (Fig. 5). However, this decrease was accentuated significantly when hepatocytes were cocultured with CEHTg macrophages, indicating that CEH-dependent changes in macrophage metabolism and/or phenotype attenuate hepatic TG synthesis, leading to the observed decrease in hepatic lipid content. Changes in the expression of genes involved in TG synthesis and secretion, fatty acid uptake, and transport as well as gluconeogenesis were monitored in hepatocytes cocultured with macrophages in Transwells. There was no change in the expression of genes involved in TG synthesis and secretion, namely FAS, Mttp, and apoB (Fig. 6A), in hepatocytes cocultured with either wild-type nontransgenic or CEH transgenic macrophages. Similarly, no difference was noted between the genes involved in fatty acid uptake and transport, namely CD36, Fabp1, and Fabp5 (Fig. 6B). Although there was a significant increase in the expression of genes involved in gluconeogenesis (glucose-6-phosphatase and phosphoenolpyruvate carboxykinase) when hepatocytes were cocultured with macrophages, this increase was not affected by macrophage genotype (Fig. 6C). Similar results were obtained when primary hepatocytes were cultured in the presence of macrophage-conditioned medium (data not shown). Consistent with the data obtained with isolated hepatocytes, no significant differences in the expression of these genes were seen in livers from ob/ob or ob/ob-CEHTg mice (Fig. 7, A–C). In addition, Kupffer cell or macrophage number in liver or adipose tissue as assessed by measurement of CD68 and MSR1 mRNA levels (Fig. 7D) remained unchanged between the two genotypes.
Fig. 5.
Decreased [14C]acetate incorporation in hepatocytes cocultured with CEHTg macrophages. Primary hepatocytes were isolated from 8-wk-old ob/ob mice and plated in 12-well plates coated with collagen. Thioglycollate-elicited macrophages were harvested from wild-type (WT) or CEHTg mice, and 1 × 10⁶ cells were plated in Transwells. After an overnight incubation, Transwells were placed in wells containing hepatocytes, and these cocultures were incubated for additional 24 h. During this incubation time, the hepatocyte culture medium was supplemented with 2 mM [14C]acetate. Total lipids were extracted after 24 h and analyzed as described in experimental procedures. Data are expressed as %no. of macrophage control (means ± SD; n = 6), and individual P values for the differences between groups are indicated.
Fig. 6.
Changes in the expression of genes involved in TG synthesis and secretion (A), fatty acid uptake and transport (B), and gluconeogenesis in hepatocytes (C) cocultured with macrophages. Primary hepatocytes were isolated and cocultured with thioglycollate-elicited macrophages as described in experimental procedures. Total RNA was extracted from the hepatocytes after 24 h and expression of indicated genes monitored by real-time quantitative PCR (qPCR) using specific Taqman assays. β-Actin was used as the housekeeping gene, and data are expressed as %no. of macrophage control (means ± SD; n = 5). FAS, fatty acid synthase; Mttp, microsomal triglyceride transfer protein; apoB, apolipoprotein B; Fabp1 and -5, fatty acid-binding protein 1 and 5, respectively; G-6-Pase, glucose-6-phosphatase; PEPCK, phosphoenolpyruvate carboxykinase.
Higher numbers of CEHTg kupffer cells are of anti-inflammatory M2 phenotype.
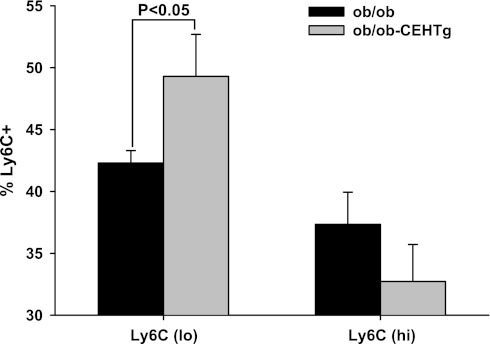
Macrophages exist in classically activated M1 or alternatively activated M2 phenotypes that are characterized by secretion of pro- and anti-inflammatory cytokines, respectively, and thus differentially alter the metabolism of surrounding cells. Surface expression of Ly6C antigen is one of the techniques used to determine the relative proportions of M1 and M2 macrophages; expression of Ly6C is low in M2 macrophages and high in M1 macrophages. Using peritoneal macrophages, earlier we established this staining pattern and confirmed the phenotype in the sorted Ly6Clo and Ly6Chi populations; Ly6Clo population expressed the characteristic markers YM1 and arginase 1, and Ly6Chi population expressed IL-1β and TNFα (4). To determine whether CEH overexpression-mediated changes in macrophage phenotype also occur in resident macrophages in liver or Kupffer cells, using the same staining protocols freshly isolated Kupffer cells were surface-stained for Ly6C, and distribution of Ly6Clo and Ly6Chi was determined. There was a significant increase in Ly6Clo population in Kupffer cells isolated from ob/ob-CEHTg mice (Fig. 8), suggesting that there is a shift toward a more anti-inflammatory phenotype. Although there was a trend toward a decrease in the Ly6Chi population, it did not reach statistical significance. These data are consistent with our earlier data demonstrating an M2 polarization of atherosclerotic plaque-associated macrophages in LDLR−/−-CEHTg mice (4).
Fig. 8.
Increased number of Kupffer cells in Ly6Clo or M2 phenotype in ob/ob-CEHTg mice. Isolated kupffer cells were stained for leukocytes (CD45), macrophages (CD11b), and Ly6C and analyzed by FACS. The distribution of Ly6Clo and Ly6CHi is plotted as the %total CD45+CD11b+Ly6C+ cells. Data are presented as means ± SD; n = 5.
DISCUSSION
Obesity is associated with the development of systemic metabolic derangements characterized by insulin resistance and dyslipidemia, and coexistence of this with hypertension is termed the metabolic syndrome. We demonstrated earlier that, despite comparable accumulation of adipose tissue, Western (high fat, high cholesterol) diet-fed LDLR−/− mice with macrophage-specific transgenic expression of CEH showed improved glucose tolerance and insulin sensitivity, and the underlying mechanism was the attenuated systemic and adipose tissue inflammation (5). Our present study demonstrates that, similar to LDLR−/− mice, where obesity was diet induced, macrophage-specific transgenic expression of CEH also improves glucose tolerance in an established mouse model of obesity, namely the leptin-deficient ob/ob mice. Increased hepatic lipogenesis is thought to be responsible for the insulin resistance phenotype of ob/ob mice (13), and the data presented here show that hepatic lipid accumulation and TG synthesis were reduced significantly in ob/ob-CEHTg mice. TG synthesis as measured by [14C]acetate incorporation was also reduced significantly in hepatocytes cocultured with CEHTg macrophages compared with nontransgenic macrophages. Furthermore, resident hepatic macrophages or Kupffer cells isolated from ob/ob-CEHTg liver were polarized toward an anti-inflammatory M2 phenotype. Collectively, these data suggest that in the leptin-deficient ob/ob background macrophage-specific transgenic expression of CEH polarizes Kupffer cells toward an anti-inflammatory M2 phenotype and decreases hepatic lipid accumulation or hepatic steatosis.
Lipid content of nonadipocytes is under tight regulation, and the burden of buffering excessive fatty acids in circulation falls on adipocytes. However, in obesity, although there is significant expansion of subcutaneous and visceral adipose tissue, lipid is also stored in ectopic depots (i.e., outside of these two recognized locations) such as liver, skeletal muscle, and heart, and determining the role of these depots in the development of insulin resistance and metabolic syndrome is being pursued extensively (24). The importance of storing fat in the correct depot, i.e., adipose tissue, is best exemplified by severe hepatosteatosis, diabetes, elevated glucose, insulin, TG, and NEFA in A-ZIP/F-1 fatless mice with no adipose tissue (subcutaneous or elsewhere) and the fact that transplantation of wild-type adipose tissue into these mice reverses this phenotype (15). Analogous human condition is represented by patients with highly active antiretroviral therapy-associated lipodystrophy characterized by loss of subcutaneous fat and accumulation of fat in the liver resulting in cardiovascular complications (26). Clinical studies evaluating the role of ectopic lipid storage have established a correlation between plasma indices of insulin resistance and ectopically stored lipid levels (33). For example, in the National Health and Nutrition Examination Survey III, adults with nonalcoholic fatty liver disease (NAFLD) with ectopic lipid accumulation in the liver were twice as likely to have T2DM compared with subjects without NAFLD (9). Furthermore, accumulation of lipid in the liver is well correlated with hepatic insulin resistance in both T2DM and nondiabetic individuals (34). Van Herpen and Schrauwen-Hinderling (37) showed that accumulation of TG and, more specifically, the intermediates in TG biosynthesis, namely DG, decrease insulin signaling. Therefore, significant reduction in ectopic lipid accumulation in the livers of ob/ob-CEHTg mice, as well as reduced synthesis of DG, likely represents one of the mechanisms underlying the observed improvement in glucose tolerance in these mice. It is noteworthy that, in addition to liver, ob/ob-CEHTg mice also have significantly reduced lipid accumulation in skeletal muscle (Bie J, Zhao B, and Ghosh S, unpublished observations). Studies are in progress to define the mechanisms by which macrophage-specific transgenic expression of CEH regulates ectopic lipid accumulation in skeletal muscle and how it affects muscle function (e.g., glucose utilization). Since an increase in local inflammation due to macrophage infiltration into the muscle is known to affect insulin sensitivity (31), contribution of changes in skeletal muscle to the observed improvement in glucose tolerance in ob/ob-CEHTg mice cannot be ruled out based on the data presented here.
The mechanism(s) responsible for increased intrahepatic TG accumulation is not completely understood. It has been suggested that dysfunctional adipose tissue, characterized by adipocyte hypertrophy, macrophage infiltration, impaired insulin signaling, and insulin resistance, releases a host of inflammatory adipokines and excessive amounts of NEFA that promote ectopic fat deposition in liver (12). Recent studies have established that upregulation of hepatic CD36 is associated with insulin resistance and hepatic steatosis in humans (29), and alterations in NEFA uptake regulated at the level of fatty acid transporter CD36 expression are thought to be involved in increased TG accumulation in patients with NAFLD (17). In addition, the role of intracellular fatty acid-binding proteins such as FABP5 in the metabolic syndrome and/or diabetes is also established by several studies (3, 8). However, in mouse models with disrupted leptin signaling, such ob/ob or db/db mice, fatty acid uptake does not play a causal role in hepatic steatosis (16). Consistently, no significant differences were noted in plasma nonesterified fatty acid levels, mRNA expression of CD36, or FABP5 in hepatocytes cocultured with wild-type or CEH transgenic macrophages and livers from ob/ob and ob/ob-CEHTg mice. Although direct measurement of NEFA uptake by hepatocytes was not performed in the present study, these data suggest that transgenic expression of CEH did not affect availability and/or uptake of NEFA by the liver.
Another factor that potentially regulates TG accumulation in hepatocytes is its microenvironment; namely, the effect of resident liver macrophages or Kupffer cells and the role of Kupffer cell-hepatocyte interaction are not completely defined. Depletion of Kupffer cells is used as a strategy to evaluate their role in modulating hepatic metabolism, and these studies, in contrast to our results, indicate that depletion of Kupffer cells leads to attenuation of hepatic steatosis (18, 29a). However, treatment with gadolinium or liposome-encapsulated clodronate not only depletes Kupffer cells but also depletes macrophages from other tissues, including spleen and adipose tissue (19), thereby confounding the inferences regarding the specific role of Kupffer cell-hepatocyte interactions. Lanthier et al. (23) demonstrated recently that treatment with gadolinium chloride after a period of high-fat diet feeding that leads to significant infiltration of macrophages into the adipose tissue had no effect on hepatic lipid accumulation or insulin sensitivity. However, preventive and prolonged treatment prevents adipose tissue inflammation and ameliorates insulin sensitivity, demonstrating that the observed effects of gadolinium treatment are not due solely to macrophage depletion in liver, but depletion of macrophages in adipose tissue is also a significant contributor.
Proinflammatory cytokines (namely, IL-1β, IL-6, and TNFα) secreted by Kupffer cells activate hepatocytes (35), affect gluconeogenesis (38), and increase the expression of acute-phase proteins (21) and enzymes involved in xenobiotic metabolism (28). On the other hand, anti-inflammatory cytokine IL-10 secreted by Kupffer cells is essential for hepatocyte homeostasis, and its loss under conditions of Kupffer cell depletion is associated with increased STAT3-dependent signaling and steatosis, leading to decreased insulin signaling (10). Consistently, induction of IL-10 expression in Kupffer cells decreases activation of hepatic stellate cells (1). Secretion of pro- or anti-inflammatory mediators by macrophages is determined by the polarization of macrophages toward either M1 or M2 phenotype, and M1 or M2 polarization itself is regulated by exposure to Th1 or Th2 cytokines. Kang et al. (20) recently established the role of adipocyte- as well as hepatocyte-derived Th2 cytokines in regulating macrophage polarization and thus regulating insulin sensitivity. Recently, we reported a significant shift in the polarization of CEHTg macrophages toward an M2 phenotype (4) and also demonstrated reduced activation of NF-κB in CEHTg macrophages resulting in a decrease in the secretion of proinflammatory mediators (5). Consistently, Kupffer cells isolated from ob/ob-CEHTg livers were polarized toward an M2 phenotype (Fig. 7), and significantly higher attenuation of TG synthesis was observed when primary hepatocytes were cocultured with CEHTg macrophages (Fig. 5). Huang et al. (18) recently reported an increase in hepatocyte TG synthesis when cocultured with M1-polarized (LPS stimulated) Kupffer cells. Although the effects of untreated or M2-polarized cells were not evaluated, these data provide support for the concept that increased M1 polarization enhances TG synthesis in hepatocytes, and conversely, CEH-mediated M2 polarization of macrophages phenotype beneficially alters hepatocyte metabolism, leading to reduced lipid accumulation.
In conclusion, CEH-mediated changes in macrophage cholesterol metabolism shift the polarization toward an anti-inflammatory M2 phenotype. This polarization of hepatic macrophage or Kupffer cells attenuates TG synthesis in hepatocytes, leading to the observed decrease in hepatic lipid accumulation in ob/ob-CEHTg mice. Consistent with the role of increased hepatic steatosis in the development of the insulin resistance phenotype in ob/ob mice (23), reduction in ectopic (hepatic) lipid accumulation improved glucose tolerance significantly in these animals. These studies establish the role of macrophage cholesterol homeostasis in regulating hepatic lipid metabolism. Additional studies will define the mechanisms underlying the effects of macrophage phenotype and/or cholesterol content-dependent changes in Kupffer cells (or hepatic macrophages) on hepatocyte metabolism.
GRANTS
This work was supported by a grant from the National Heart, Lung, and Blood Institute (HL-069946) and a Research Award from the American Diabetes Association to S. Ghosh.
DISCLOSURES
No conflicts of interest, financial or otherwise, are declared by the authors.
AUTHOR CONTRIBUTIONS
J.B., B.Z., K.E.M., J.W., B.S., and S.G. performed the experiments; J.B., B.Z., J.W., B.S., and S.G. analyzed the data; J.B., J.W., B.S., and S.G. edited and revised the manuscript; J.B., J.W., B.S., and S.G. approved the final version of the manuscript; S.G. did the conception and design of the research; S.G. interpreted the results of the experiments; S.G. prepared the figures; S.G. drafted the manuscript.
ACKNOWLEDGMENTS
We acknowledge the technical assistance of David Bolick in the isolation of Kupffer cells and FACS analyses.
REFERENCES
- 1. Aoyama T, Inokuchi S, Brenner DA, Seki E. CX3CL1-CX3CR1 interaction prevents carbon tetrachloride-induced liver inflammation and fibrosis in mice. Hepatology 52: 1390–1400, 2010 [DOI] [PMC free article] [PubMed] [Google Scholar]
- 3. Bagheri R, Qasim AN, Mehta NN, Terembula K, Kapoor S, Braunstein S, Schutta M, Iqbal N, Lehrke M, Reilly MP. Relation of plasma fatty acid binding proteins 4 and 5 with the metabolic syndrome, inflammation and coronary calcium in patients with type-2 diabetes mellitus. Am J Cardiol 106: 1118–1123, 2010 [DOI] [PMC free article] [PubMed] [Google Scholar]
- 4. Bie J, Zhao B, Ghosh S. Atherosclerotic lesion progression is attenuated by reconstitution with bone marrow from macrophage-specific cholesteryl ester hydrolase transgenic mice. Am J Physiol Regul Integr Comp Physiol 301: R967–R974, 2011 [DOI] [PMC free article] [PubMed] [Google Scholar]
- 5. Bie J, Zhao B, Song J, Ghosh S. Improved insulin sensitivity in high fat- and high cholesterol-fed Ldlr−/− mice with macrophage-specific transgenic expression of cholesteryl ester hydrolase: role of macrophage inflammation and infiltration into adipose tissue. J Biol Chem 285: 13630–13637, 2010 [DOI] [PMC free article] [PubMed] [Google Scholar]
- 6. Bligh EG, Dyer WJ. A rapid method of total lipid extraction and purification. Can J Biochem Physiol 37: 911–917, 1959 [DOI] [PubMed] [Google Scholar]
- 7. Bouloumié A, Curat CA, Sengenès C, Lolmède K, Miranville A, Busse R. Role of macrophage tissue infiltration in metabolic diseases. Curr Opin Clin Nutr Metab Care 8: 347–354, 2005 [DOI] [PubMed] [Google Scholar]
- 8. Bu L, Salto LM, De Leon KJ, De Leon M. Polymorphisms in fatty acid binding protein 5 show association with type 2 diabetes. Diabetes Res Clin Pract 92: 82–91, 2011 [DOI] [PMC free article] [PubMed] [Google Scholar]
- 9. Clark JM, Diehl AM, Brancati FL. Nonalcoholic fatty liver disease and the risk for type 2 diabetes in the United States (Abstract). Diabetes 50: A38, 2001 [Google Scholar]
- 10. Clementi AH, Gaudy AM, van Rooijen N, Pierce RH, Mooney RA. Loss of Kupffer cells in diet-induced obesity is associated with increased hepatic steatosis, STAT3 signaling, and further decreases in insulin signaling. Biochim Biophys Acta 1792: 1062–1072, 2009 [DOI] [PMC free article] [PubMed] [Google Scholar]
- 11. Coenen KR, Gruen ML, Hasty AH. Obesity causes very low density lipoprotein clearance defects in low-density lipoprotein receptor-deficient mice. J Nutr Biochem 18: 727–735, 2007 [DOI] [PubMed] [Google Scholar]
- 12. Cusi K. The role of adipose tissue and lipotoxicity in the pathogenesis of type 2 diabetes. Curr Diab Rep 10: 306–315, 2010 [DOI] [PubMed] [Google Scholar]
- 13. Dentin R, Benhamed F, Hainault I, Fauveau V, Foufelle F, Dyck JR, Girard J, Postic C. Liver-specific inhibition of ChREBP improves hepatic steatosis and insulin resistance in ob/ob mice. Diabetes 55: 2159–2170, 2006 [DOI] [PubMed] [Google Scholar]
- 14. Fazio S, Linton MF. The inflamed plaque: cytokine production and cellular cholesterol balance in the vessel wall. Am J Cardiol 88: 12E–15E, 2001 [DOI] [PubMed] [Google Scholar]
- 15. Gavrilova O, Marcus-Samuels B, Graham D, Kim JK, Shulman GI, Castle AL, Vinson C, Eckhaus M, Reitman ML. Surgical implantation of adipose tissue reverses diabetes in lipoatrophic mice. J Clin Invest 105: 271–278, 2000 [DOI] [PMC free article] [PubMed] [Google Scholar]
- 16. Ge F, Zhou S, Hu C, Lobdell H, 4th, Berk PD. Insulin- and leptin-regulated fatty acid uptake plays a key causal role in hepatic steatosis in mice with intact leptin signaling but not in ob/ob or db/db mice. Am J Physiol Gastrointest Liver Physiol 299: G855–G866, 2010 [DOI] [PMC free article] [PubMed] [Google Scholar]
- 17. Greco D, Kotronen A, Westerbacka J, Puig O, Arkkila P, Kiviluoto T, Laitinen S, Kolak M, Fisher RM, Hamsten A, Auvinen P, Yki-Järvinen H. Gene expression in human NAFLD. Am J Physiol Gastrointest Liver Physiol 294: G1281–G1287, 2008 [DOI] [PubMed] [Google Scholar]
- 18. Huang W, Metlakunta A, Dedousis N, Zhang P, Sipula I, Dube JJ, Scott DK, O'Doherty RM. Depletion of liver Kupffer cells prevents the development of diet-induced hepatic steatosis and insulin resistance. Diabetes 59: 347–357, 2010 [DOI] [PMC free article] [PubMed] [Google Scholar]
- 19. Jiang S, Gavrikova TA, Sharifov OF, Messina JL. Role of tissue macrophages in the development of critical illness diabetes. Shock 37: 70–76, 2012 [DOI] [PMC free article] [PubMed] [Google Scholar]
- 20. Kang K, Reilly SM, Karabacak V, Gangl MR, Fitzgerald K, Hatano B, Lee CH. Adipocyte-derived Th2 cytokines and myeloid PPARdelta regulate macrophage polarization and insulin sensitivity. Cell Metab 7: 485–495, 2008 [DOI] [PMC free article] [PubMed] [Google Scholar]
- 21. Knolle P, Löhr H, Treichel U, Dienes HP, Lohse A, Schlaack J, Gerken G. Parenchymal and nonparenchymal liver cells and their interaction in the local immune response. Z Gastroenterol 33: 613–620, 1995 [PubMed] [Google Scholar]
- 22. Koseki M, Hirano K, Masuda D, Ikegami C, Tanaka M, Ota A, Sandoval JC, Nakagawa-Toyama Y, Sato SB, Kobayashi T, Shimada Y, Ohno-Iwashita Y, Matsuura F, Shimomura I, Yamashita S. Increased lipid rafts and accelerated lipopolysaccharide-induced tumor necrosis factor-alpha secretion in Abca1-deficient macrophages. J Lipid Res 48: 299–306, 2007 [DOI] [PubMed] [Google Scholar]
- 23. Lanthier N, Molendi-Coste O, Cani PD, van Rooijen N, Horsmans Y, Leclercq IA. Kupffer cell depletion prevents but has no therapeutic effect on metabolic and inflammatory changes induced by a high-fat diet. FASEB J 25: 4301–4311, 2011 [DOI] [PubMed] [Google Scholar]
- 24. Lettner A, Roden M. Ectopic fat and insulin resistance. Curr Diab Rep 8: 185–191, 2008 [DOI] [PubMed] [Google Scholar]
- 25. Levine DM, Parker TS, Donnelly TM, Walsh A, Rubin AL. In vivo protection against endotoxin by plasma high density lipoprotein. Proc Natl Acad Sci USA 90: 12040–12044, 1993 [DOI] [PMC free article] [PubMed] [Google Scholar]
- 26. Mallon PW, Cooper DA, Carr A. HIV-associated lipodystrophy. HIV Med 2: 166–173, 2001 [DOI] [PubMed] [Google Scholar]
- 27. Marangoni A, Donati M, Cavrini F, Aldini R, Accardo S, Sambri V, Montagnani M, Cevenini R. Chlamydia pneumoniae replicates in Kupffer cells in mouse model of liver infection. World J Gastroenterol 12: 6453–6457, 2006 [DOI] [PMC free article] [PubMed] [Google Scholar]
- 28. Milosevic N, Schawalder H, Maier P. Kupffer cell-mediated differential down-regulation of cytochrome P450 metabolism in rat hepatocytes. Eur J Pharmacol 368: 75–87, 1999 [DOI] [PubMed] [Google Scholar]
- 29. Miquilena-Colina ME, Lima-Cabello E, Sánchez-Campos S, García-Mediavilla MV, Fernández-Bermejo M, Lozano-Rodríguez T, Vargas-Castrillón J, Buqué X, Ochoa B, Aspichueta P, González-Gallego J, García-Monzón C. Hepatic fatty acid translocase CD36 upregulation is associated with insulin resistance, hyperinsulinaemia and increased steatosis in non-alcoholic steatohepatitis and chronic hepatitis C. Gut 60: 1394–1402, 2011 [DOI] [PubMed] [Google Scholar]
- 29a. Neyrinck AM, Taper HS, Gevers V, Declerck B, Delzenne NM. Inhibition of Kupffer cell activity induces hepatic triglyceride synthesis in fasted rats, independent of lipopolysaccharide challenge. J Hepatol 36: 466–473, 2002 [DOI] [PubMed] [Google Scholar]
- 30. Odegaard JI, Ricardo-Gonzalez RR, Red Eagle A, Vats D, Morel CR, Goforth MH, Subramanian V, Mukundan L, Ferrante AW, Chawla A. Alternative M2 activation of Kupffer cells by PPARdelta ameliorates obesity-induced insulin resistance. Cell Metab 7: 496–507, 2008 [DOI] [PMC free article] [PubMed] [Google Scholar]
- 31. Olefsky JM, Glass CK. Macrophages, inflammation, and insulin resistance. Annu Rev Physiol 72: 219–246, 2010 [DOI] [PubMed] [Google Scholar]
- 32. Park JS, Qiao L, Gilfor D, Yang MY, Hylemon PB, Benz C, Darlington G, Firestone G, Fisher PB, Dent P. A role for both Ets and C/EBP transcription factors and mRNA stabilization in the MAPK-dependent increase in p21 (Cip-1/WAF1/mda6) protein levels in primary hepatocytes. Mol Biol Cell 11: 2915–2932, 2000 [DOI] [PMC free article] [PubMed] [Google Scholar]
- 33. Ruberg FL, Chen Z, Hua N, Bigornia S, Guo Z, Hallock K, Jara H, LaValley M, Phinikaridou A, Qiao Y, Viereck J, Apovian CM, Hamilton JA. The relationship of ectopic lipid accumulation to cardiac and vascular function in obesity and metabolic syndrome. Obesity (Silver Spring) 18: 1116–1121, 2010 [DOI] [PMC free article] [PubMed] [Google Scholar]
- 34. Seppälä-Lindroos A, Vehkavaara S, Häkkinen AM, Goto T, Westerbacka J, Sovijärvi A, Halavaara J, Yki-Järvinen H. Fat accumulation in the liver is associated with defects in insulin suppression of glucose production and serum free fatty acids independent of obesity in normal men. J Clin Endocrinol Metab 87: 3023–3028, 2002 [DOI] [PubMed] [Google Scholar]
- 35. Scott MJ, Liu S, Su GL, Vodovotz Y, Billiar TR. Hepatocytes enhance effects of lipopolysaccharide on liver nonparenchymal cells through close cell interactions. Shock 23: 453–458, 2005 [DOI] [PubMed] [Google Scholar]
- 36. Subramanian S, Han CY, Chiba T, McMillen TS, Wang SA, Haw A, 3rd, Kirk EA, O'Brien KD, Chait A. Dietary cholesterol worsens adipose tissue macrophage accumulation and atherosclerosis in obese LDL receptor-deficient mice. Arterioscler Thromb Vasc Biol 28: 685–691, 2008 [DOI] [PMC free article] [PubMed] [Google Scholar]
- 37. van Herpen NA, Schrauwen-Hinderling VB. Lipid accumulation in non-adipose tissue and lipotoxicity. Physiol Behav 94: 231–241, 2008 [DOI] [PubMed] [Google Scholar]
- 38. Yerkovich ST, Rigby PJ, Fournier PA, Olynyk JK, Yeoh GC. Kupffer cell cytokines interleukin-1beta and interleukin-10 combine to inhibit phosphoenolpyruvate carboxykinase and gluconeogenesis in cultured hepatocytes. Int J Biochem Cell Biol 36: 1462–1472, 2004 [DOI] [PubMed] [Google Scholar]
- 39. Zhao B, Song J, Chow WN, St, Clair RW, Rudel LL, Ghosh S. Macrophage-specific transgenic expression of cholesteryl ester hydrolase significantly reduces atherosclerosis and lesion necrosis in Ldlr mice. J Clin Invest 117: 2983–2992, 2007 [DOI] [PMC free article] [PubMed] [Google Scholar]


