Abstract
Enteric neural stem cells (ENSCs) are a population of neural crest-derived multipotent stem cells present in postnatal gut that may play an important role in regeneration of the enteric nervous system. In most studies, these cells have been isolated from the layer of the gut containing the myenteric plexus. However, a recent report demonstrated that neurosphere-like bodies (NLBs) containing ENSCs could be isolated from mucosal biopsy specimens from children, suggesting that ENSCs are present in multiple layers of the gut. The aim of our study was to assess whether NLBs isolated from layers of gut containing either myenteric or submucosal plexus are equivalent. We divided the mouse small intestine into two layers, one containing myenteric plexus and the other submucosal plexus, and assessed for NLB formation. Differences in NLB density, proliferation, apoptosis, neural crest origin, and phenotype were investigated. NLBs isolated from the myenteric plexus layer were present at a higher density and demonstrated greater proliferation, lower apoptosis, and higher expression of nestin, p75, Sox10, and Ret than those from submucosal plexus. Additionally, they contained a higher percentage of neural crest-derived cells (99.4 ± 1.5 vs. 0.7 ± 1.19% of Wnt1-cre:tdTomato cells; P < 0.0001) and produced more neurons and glial cells than those from submucosal plexus. NLBs from the submucosal plexus layer expressed higher CD34 and produced more smooth muscle-like cells. NLBs from the myenteric plexus layer contain more neural crest-derived ENSCs while those from submucosal plexus appear more heterogeneous, likely containing a population of mesenchymal stem cells.
Keywords: enteric neural stem cells, Wnt1, neural crest
the enteric nervous system (ENS) is a complex network of neurons and glia that span the gastrointestinal tract and control complex gut behaviors including peristalsis, secretion, and blood flow. Derived from migratory vagal and sacral neural crest cells, the ENS is organized into two concentric rings of ganglia called the submucosal and myenteric plexus (10). The ENS can be afflicted by a variety of diseases that can be congenital or acquired, localized or diffuse, and involve one or more cell types (8). The treatment for many of these disorders is far from satisfactory. Although this partially reflects our lack of understanding of the pathophysiology, there are also limitations to surgical, pharmacologic, or device-based approaches, particularly if the effector elements targeted by such therapies are missing or nonresponsive. A true cure for at least some ENS disorders may involve restoring or replacing missing or dysfunctional neurons with healthy neuronal precursors/stem cells. To this end, much work is underway to identify sources of stem or progenitor cell populations suitable for regenerating the ENS.
Enteric neural stem cells (ENSCs) have been isolated from gut in both rodents and humans and may serve as the preferred population for cell-based therapies for the ENS (17, 24). They represent a multipotent stem cell population that can differentiate into neurons, glial cells, and myofibroblasts and colonize aganglionic gut explants (1, 2, 4, 16, 20, 25–27, 30, 31). Initially isolated from embryonic gut tissue (2, 27, 31), they have subsequently been identified in adult guts of rodents and humans (1, 14, 16, 21, 25, 26, 30, 33). Recently, Laranjeira et al. (18) utilized genetic fate mapping of Sox10, a neural crest cell marker, to demonstrate that in the postnatal gut Sox10-derived cells can act as neuroprogenitor cells and regenerate neurons in response to injury. This suggests that ENSCs account for the regenerative capacity of the ENS seen in various injury models (6, 9, 23, 28).
The origin and distribution of ENSCs within the adult gut has not been entirely elucidated. Liu et al. (21) demonstrated 5-bromo-2-deoxyuridine-labeled cells (following pulse chase) in germinal niches adjacent to myenteric ganglia, suggesting that ENSCs reside in the myenteric plexus. Supporting this location, the majority of protocols for isolating ENSCs involve dissecting out the layer containing longitudinal muscle and adherent myenteric plexus (1, 3, 4, 11, 16, 21, 25, 30), or the myenteric plexus directly (32). A recent study by Metzger et al. (26), however, demonstrated that neurosphere-like bodies (NLBs) containing ENSCs could be isolated from human intestine via endoscopic biopsies (26). These biopsy specimens sampled mucosa and submucosa but not deeper layers of the gut. This is an important finding as it implies that ENSCs are present in multiple layers of the gut.
The aim of the present study was to systematically assess whether NLBs are present in multiple layers of the gut and determine whether they are equivalent. We did this by dividing the gut into two layers, one containing longitudinal muscle and myenteric plexus and the other circular muscle and submucosal plexus. Here we demonstrate that NLBs can be isolated from both layers but differ in density of colony forming units, proliferation, apoptosis, and phenotype.
MATERIALS AND METHODS
Animals.
A Wnt1-cre;tdTomato line was created by crossing B6.Cg-Tg(Wnt1-cre) (Jackson Laboratories) with loxP-stop-tdTomato (provided by B. Barres). Wild-type male C57/BL6 and Wnt1-cre;tdTomato between 2–3 mo of age were used in the experiments. Experimental protocols were approved by the Administrative Panel on Laboratory Animal Care at the Stanford University, California in accordance with the guidelines provided by the National Institutes of Health.
Isolation and in vitro culture of ENSCs.
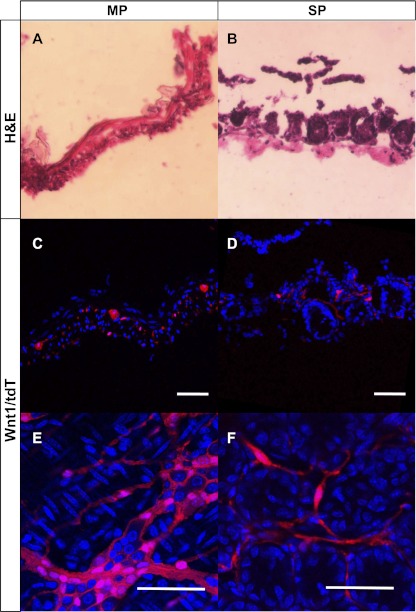
Mice were anesthetized with isofluorane and euthanized by cervical dislocation. A laparotomy was performed, and the small intestine was removed and lavaged with PBS containing penicillin-streptomycin (PS; Invitrogen, Carlsbad, CA). Guts from three mice were cut into segments of 2 cm in length and placed over a sterile plastic rod. A superficial longitudinal incision was made along the serosal surface, and the longitudinal muscle with the adherent myenteric plexus was peeled off from the underlying tissue (see Fig. 2A) using a wet sterile cotton swab and placed in Opti-MEM containing PS and 150 μM poloxamer-188 (P188, Sigma, St. Louis, MO). After removal of the layer containing the myenteric plexus, a longitudinal incision was made in the remaining gut tissue, which was then placed mucosal side up in a sterile Petri dish. With the use of two glass slides, the mucosal villus was scraped off and the underlying tissue including circular muscle, submucosal plexus and mucosal crypts (see Fig. 2B) was placed in Opti-MEM buffer. The tissue was finely diced and digested in digestion buffer consisting of M199 media (Invitrogen) containing 0.1% BSA, 1 mM CaCl2, 20 mM HEPES, 150 μM P188, 50 U/ml DNAse I (Worthington, Lakewood, NJ), 1.1 mg/ml collagenase (Sigma), and dispase 1 mg/ml (Sigma) for 40 min at 37°C and 5% CO2. Tissue was washed in PBS with 10%FBS, passed through a sterile 40-mm nylon mesh cell strainer, and resuspended in stem cell medium (SCM) consisting of neurobasal medium containing B27, 2 mM l-glutamine and 100 U/ml PS, plus 10 ng/ml fibroblast growth factor (bFGF), 10 ng/ml epidermal growth factor (EGF), and 10 ng/ml glial cell-derived neurotrophic factor (Invitrogen). Cells were cultured at 37°C and 5% CO2, and medium was replaced every other day. For colony forming assay, total viable cells were counted, plated at a density of 75,000–140,000 cells/ml, and cultured for 7 days in SCM before being transferred to gridded plates where NLBs were counted. For cell counts from Wnt1-cre;tdTomato mice, 2 days following their isolation cells were transferred to fibronectin-coated dish and grown as an adherent monolayer for two additional days in SCM. Cells were then dissociated with accutase and plated on fibronectin-coated coverslips for counting and immunofluorescence.
Fig. 2.
Wnt1-cre marked cells are detected in MP and SP. Hematoxylin-eosin (H&E) staining from Wnt1-cre;tdTomato mice reveals MP to consist of smooth muscle layers and myenteric plexus (A) and SP to contain mucosal crypt bases and submucosa (B). TdTomato (tdT) expression, indicative of neural crest cells, could be seen forming a network of ganglia representing the myenteric plexus in MP (C and E). TdT expression was also detected in “SP” representing the submucosal plexus (D and F). Scale bar = 50 μm.
5-Ethynyl-2-deoxyuridine proliferation assay.
Two days after isolation, NLBs were counted and equal numbers (∼40) were plated on 22-mm fibronectin-coated coverslips (BD Biosciences, San Jose, CA) and grown in SCM overnight. Cells were grown in presence of 10 mM 5-ethynyl-2-deoxyuridine (EdU) for an additional 10 h, and EdU uptake was determined using the Click-iT EdU assay (Invitrogen) per manufacturer's protocol.
Terminal deoxynucleotidyl transferase dUTP-mediated nick-end labeling assay.
NLBs were counted and grown on fibronectin-coated coverslips as described above. Apoptosis was determined using Click-iT terminal deoxynucleotidyl transferase dUTP-mediated nick-end labeling (TUNEL) Alexa Fluor imaging assay (Invitrogen) according to the manufacturer's instructions.
Differentiation experiments.
After culturing for 7 days in SCM, NLBs were counted and equal numbers (∼100 spheres/well or coverslip) were plated in fibronectin-coated 6 well dish (BD Biosciences) for RNA extraction or fibronectin-coated coverslips for immunofluorescence analysis. Cells were cultured for 10 days in differentiating medium (SCM minus EGF, FGF, and glial cell-derived neurotrophic factor) with media replaced every other day.
RNA isolation and quantitative RT-PCR.
RNA from cells cultured as NLBs (7 days in stem cell medium) or differentiated (grown as NLBs then cultured in differentiating medium for 10 days) was extracted using Qiagen RNeasy mini kit (Qiagen, Valencia CA), quantified using Nanodrop 2000c and converted to cDNA using High Capacity RNA-to-cDNA kit (ABI, Foster City CA). Quantification of expression of specific genes was carried out using TaqMan Gene expression Assays and ABI StepOne plus real time instrument with the following Taqman probes (ABI): PGP9.5 (Mm00495900_m1), glial fibrillary acidic protein (GFAP; Mm01253033_m1), enteric smooth muscle actin (Actg2; Mm00656102_m1), choline acetyltransferase (ChAT; Mm01221882_m1), neuronal nitric oxide synthase (nNOS; Mm01208059_m1), Nestin (Mm00450205_m1), Sox10 (Mm01300162_m1), p75 (Mm00446296_m1), CD34 (Mm00519283_m1), and GAPDH (Mm03302249_g1). All experiments were performed in biological triplicates. Expression of each gene was normalized to the housekeeping gene GAPDH. Fold change in gene expression between groups was calculated using the Pfaffl method.
Immunofluorescence analysis.
Coverslips containing cells were fixed in 4% paraformaldehyde in PBS (pH 7.4) for 30 min at room temperature, blocked, and permeabilized for 1 h at room temperature with PBS containing 0.3% Triton X-100 and 10% normal goat serum and incubated overnight at 4°C with primary antibodies diluted in PBS containing 1.5% normal goat serum. The following antibodies were used: βIII-tubulin (mouse 1:500; Abcam, Cambridge, MA), GFAP (rabbit 1:2,000; Dako, Carpinteria, CA), PGP9.5 (rabbit 1:1,000; Dako), α-smooth muscle actin (SMA; mouse 1:1,000, Sigma), Smooth Muscle Myosin (rabbit 1:300; Biomedical Technologies, Stoughton, MA), ChAT (goat 1:400; Milipore, Billerica MA), nNOS (rabbit 1:500; Zymed, San Francisco, CA), Nestin (mouse 1:100; Milipore), p75 (rabbit 1:1,500; a gift from M. Chao, New York University), and CD34 (rat 1:50; Abcam, Cambridge, MA). After being washed with PBS, cells were incubated for 1 h at room temperature with secondary antibodies. The following secondary antibodies were used: AlexaFluor 488 anti-rabbit and anti-mouse antibodies (1:1,000), Dylight 594 anti-rabbit, anti-goat and anti-mouse, and Dylight 647 anti-rabbit (all 1:1,000; Jackson ImmunoResearch, West Grove, PA). After being washed with PBS, coverslips were mounted onto glass slides using DAPI-mounting media (Vector, Burlingame, CA). Samples were examined with a Zeiss LSM510 Meta inverted confocal microscope (Neuroscience Microscopy Service Core, Stanford University).
Histology.
Tissue specimens were fixed in 4% paraformaldehyde in PBS for 1 h at room temperature then cryoprotected overnight in 30% sucrose/PBS at 4°C. Tissue was frozen in Tissue-Tek optimum cutting temperature medium on dry ice then cryosections were cut at 10 μm. Hematoxylin-eosin staining was performed using standard protocol.
Statistical analysis.
Statistical analysis was performed with StatView and Microsoft Excel using Student's paired two-tailed t-test or Fisher's exact test. Significance was deemed when P value was <0.05. Data are expressed as means ± SD. For cell counts, at least five random fields were analyzed for a minimal sampling of 300 cells.
RESULTS
ENSCs are localized in multiple layers of the gut.
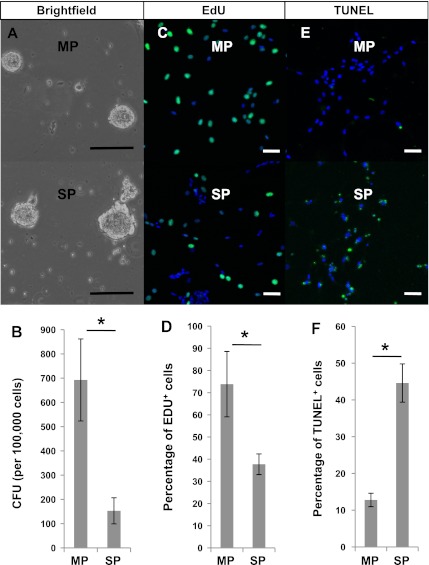
To evaluate the distribution of ENSCs in the gut, the small intestine was dissected and divided into two layers: one containing the longitudinal muscle and myenteric plexus termed “MP,” and the other containing the circular muscle, submucosal plexus, and mucosal crypts, termed “SP.” After isolation and culture in SCM (media containing growth factors) for 7 days, cells derived from both layers formed NLBs (Fig. 1A). However, the predilection for NLB formation was greater in MP compared with SP (Fig. 1B; MP: 692 ± 169.2 colony forming units/100,000 cells vs SP: 152 ± 53.9 colony forming units/100,000 cells; P < 0.01). While this difference suggests a higher frequency of proliferating ENSCs in the layer containing myenteric plexus, it may reflect the presence of intestinal epithelial cells in the SP layer (Fig. 2B). NLBs also formed from the mucosal villus layer (see Fig. 4A) but were infrequent. The inclusion of the villus layer with SP reduced overall viability, so it was removed during the preparation.
Fig. 1.
Differences in density, proliferation and apoptosis of neurosphere-like bodies (NLBs) from different gut layers. A and B: NLBs were grown from both the longitudinal muscle and myenteric plexus termed “MP” (A, top) and the circular muscle, submucosal plexus, and mucosal crypts termed “SP” (A, bottom) gut layers. MP had >4-fold higher colony forming units (CFUs) per 100,000 cells than SP (B). *P < 0.01 by Student's t-test. C and D: following a 10-h incubation, 5-ethynyl-2-deoxyuridine (EdU) uptake (green) was seen in cells from both MP (C, top) and SP (C, bottom), but the percentage was nearly 2-fold higher in MP than SP (D). *P < 0.0001 by Fisher's exact test. E and F: terminal deoxynucleotidyl transferase dUTP-mediated nick-end labeling (TUNEL)-positive cells (green), indicative of apoptosis, was seen in both MP (E, top) and SP cells (E, bottom), but the percentage was higher in SP than MP (F). *P < 0.0001 by Fisher's exact test. Scale bars = 100 μm in A and = 50 μm in C and E.
Fig. 4.
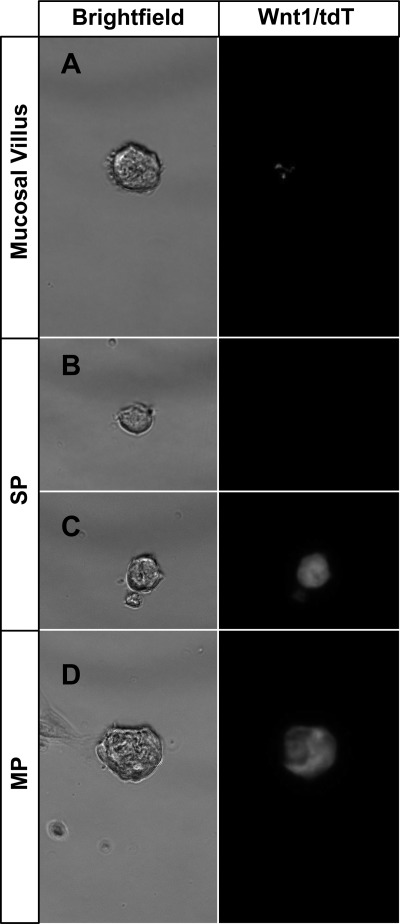
NLBs isolated from guts of Wnt1-cre;tdTomato mice. Rare NLBs could be grown from the stripped mucosal villus layer (A). These NLBs displayed only minimal tdT expression (right). Two populations of NLBs grew from the SP preparation (B and C), one that lacked tdT expression (B) and the other that expressed tdT (C). MP exclusively formed NLBs that expressed tdT (D).
Differences in proliferation and apoptosis.
To further assess whether cells derived from the two layers had different characteristics regarding proliferation and apoptosis, EdU incorporation and TUNEL assays were performed. Two days following their isolation, cells from MP and SP were transferred to fibronectin-coated coverslips for both assays. After incubation with EdU, there was a dramatic difference in EdU uptake between the cells from MP (Fig. 1C, top) compared with those from SP (Fig. 1C, bottom) cells. Cells from MP had a significantly higher proliferative index (73.8 ± 14.7% cells with EdU uptake) compared with SP (37.7 ± 4.7% EdU uptake; Fig. 1D). TUNEL assay showed that apoptotic cells were seen at a greater frequency in cells from SP (Fig. 1E, bottom) than those from MP (Fig. 1E, top) with 44.6% (±5.2%) of cells demonstrating TUNEL staining from SP compared with 12.8% (±1.8%) from MP (Fig. 1F).
Differences in neural crest-derived cells.
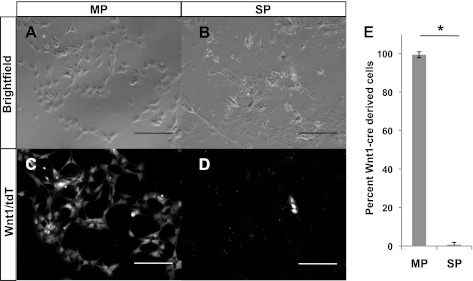
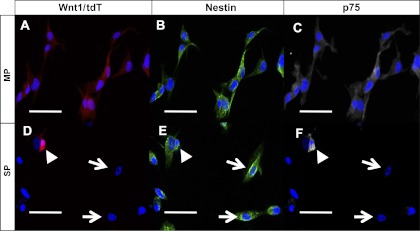
Wnt1-cre has been an effective way of marking neural crest lineage in multiple organs including embryonic gut (3, 5, 7, 11, 13). We generated a Wnt1-cre;tdTomato mouse in which all derivatives of Wnt1-expressing cells are labeled with tdTomato (tdT). In these mice, we detected cells of neural crest origin in the myenteric plexus (Fig. 2, C and E) and in the submucosal plexus (Fig. 2, D and F) of the small intestine. To assess their neural crest lineage, NLBs from MP and SP cells were prepared from Wnt1-cre;tdTomato mice and cultured on fibronectin-coated coverslips. While virtually all cells from the MP expressed tdT (Fig. 3, A and C), only a small subset from SP did (Fig. 3, B and D). On counting, 99.4% ( ± 1.5%) of MP cells expressed tdT compared with only 0.7% ( ± 1.19%) of SP (Fig. 3E). When grown as NLBs, all those that formed from MP expressed tdT (Fig. 4D), while NLBs from SP formed two populations, one that expressed tdT (Fig. 4C) and another that did not (Fig. 4B). Immunofluorescence analysis revealed that all cells that expressed tdT also expressed nestin and p75 regardless of their layer of origin (Fig. 5). However, in MP all nestin-expressing cells coexpressed tdT and p75 (Fig. 5, A–C), while in SP a sizeable number of nestin-expressing cells did not express the other markers (Fig. 5, D–F, arrows). This suggests that nestin expression is not confined to cells of neural crest origin in SP. Thus, while cells prepared from MP are primarily of neural crest origin, those from SP are more heterogeneous and primarily of nonneural crest origin.
Fig. 3.
Wnt1-cre-marked cells are present in higher frequency in MP than SP. When grown as an adherent monolayer, cells from MP uniformly expressed tdT (A and C), while only a fraction of those from SP expressed tdT (B and D). On counting, <1% of cells from SP expressed tdT compared with nearly 100% from MP (E). *P < 0.0001 by Student's t-test. Scale bar = 100 μm.
Fig. 5.
Expression of nestin and p75 in MP and SP. When cells from Wnt1-cre;tdTomato were immunostained for nestin and p75, the majority of cells from MP coexpressed tdT and both markers (A, tdT; B, nestin; C, p75). Only a few cells (arrowhead) from SP coexpressed all 3 markers (D, tdT; E, nestin; F, p75). A large number of cells expressed nestin but not tdT or p75 (arrow). Scale bars = 50 μm.
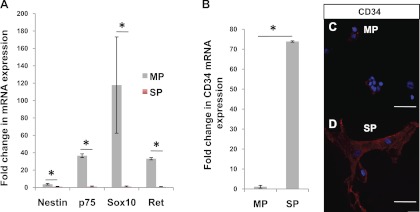
RT-PCR analysis of NLBs cultured for 7 days in stem cell media confirmed the immunostaining results. While nestin expression was only modestly higher (3.7-fold) in cells from MP compared with SP, p75 and two other ENSC markers (4, 27), Sox10 and Ret, were substantially higher (36-, 117-, and 33-fold, respectively; P < 0.03; Fig. 6A). Additionally, we found that the RNA expression of CD34, a hematopoietic stem cell marker, was 95-fold higher in NLBs from SP than MP (Fig. 6B; P < 0.001). This difference was also observed on immunofluorescence with more CD34+ cells seen in SP (Fig. 6D) than MP (Fig. 6E). These findings suggest a higher content of “true” ENSCs in NLBs from MP compared with SP and a significant population of possible mesenchymal stem cells in SP.
Fig. 6.
Differences in expression of stem cell markers. After 7 days of growth in stem cell media, NLBs from MP demonstrated significantly higher expression of enteric neural stem cells (ENSC) markers, Nestin, p75, Sox10, and Ret, than SP by quantitative (q)RT-PCR analysis (A). Expression of CD34 was found to be 95-fold higher in SP than MP by qRT-PCR (B). *P < 0.03 by Student's t-test. On immunostaining, only minimal CD34 expression was detected in a few cells from MP (C) but many intensely positive CD34-expressing cells were seen in SP (D). Scale bars = 50 μm.
Differentiation potentials of cells from different gut layers.
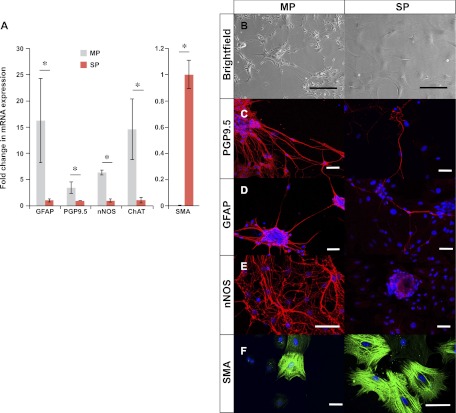
After 7 days of growth in SCM, equivalent numbers of NLBs were plated on either fibronectin-coated surfaces and allowed to differentiate for 10 days in media without growth factors. Dramatic differences in cell morphology were observed on differentiation with cells from MP forming long neuronal projections (Fig. 7B, left) and those from SP producing predominantly flat cells (Fig. 7B, right). RNA expression analysis confirmed different phenotypes with cells from MP expressing 3.4-fold higher PGP9.5, a neuron-specific marker (P = 0.01), and 16-fold higher GFAP, a glial cell marker (P = 0.03), while cells from SP expressing 164-fold higher SMA, a smooth muscle marker (P < 0.001; Fig. 6A). Cells from MP also demonstrated 6-fold higher expression of nNOS, a marker of nitrergic neurons (P < 0.001), and 14-fold higher expression of ChAT, a marker of cholinergic neurons (P = 0.01). Immunofluorescence analysis confirmed the quantitative RT-PCR results with cells from the MP layer differentiating into dense networks of neurons (Fig. 7C, left) and glial cells (Fig. 7D, left) that were immunoreactive for PGP9.5 and GFAP. Neurons (Fig. 7C, right) and glia (Fig. 7D, right) were also detected in cells from SP, but they were much fewer and tended to occur in small clusters rather than being evenly dispersed. Neurons immunoreactive for nNOS could be seen in MP (Fig. 7E, left) but not SP (Fig. 7E, right). SP cells produced many smooth muscle-like cells that immunostained for SMA (Fig. 7F, right) and smooth muscle myosin (data not shown). Similar smooth muscle-like cells were detected in MP (Fig. 7F, left) but much less frequent. These results suggest that NLBs from MP preferentially form neurons and glia while those from SP favor smooth muscle-like cells.
Fig. 7.
Differences in phenotypes upon differentiation. Cells from MP expressed significantly higher levels of mRNA for glial fibrillary acidic protein (GFAP), PGP9.5, neuronal nitric oxide synthase (nNOS), and choline acetyltransferase (ChAT) but lower smooth muscle actin (SMA) than SP as detected by qRT-PCR (A). *P < 0.05 by Student's t-test. On differentiation, cells from MP assumed neuronal morphology (B, left) while those from SP became predominantly flat cells (B, right). On immunostaining, cells from MP formed dense networks of neurons that stained for PGP9.5 (C, left) and glia that stained for GFAP (D, left). SP-derived cells also formed PGP9.5-expressing neurons (C, right) and GFAP-expressing glia (D, right) but they were sparse by comparison. Cells from MP formed nitrergic neurons that immunostained for nNOS (E, left), but they were not detected in SP (E, right). SP formed many smooth-muscle like cells that stained for SMA (F, right). These cells were also present in MP but less frequent (F, left). Scale bars = 100 μm in B and = 50 μm in C–F.
DISCUSSION
The recent discovery that ENSCs can be isolated from endoscopic mucosal biopsy specimens in children has several important implications (26). First, it demonstrates that ENSCs are a readily accessible population of neural stem cells that can be expanded in culture from a relatively small amount of tissue. Secondly, it suggests that ENSCs are present in multiple layers of the gut. In the current study, we have confirmed that ENSCs are indeed present in the submucosal layer of the gut. However, NLBs derived from the submucosal layer differs dramatically from those isolated from the layer containing myenteric plexus.
NLBs from MP contain a rather homogenous population of neural crest-derived cells that demonstrate higher proliferation, lower apoptosis, and higher expression of nestin, p75, Ret, and Sox10 than their SP counterparts. We found relatively few cells of neural crest origin in SP and given their low yield of neurons and glia, this suggests that SP contains fewer “true” ENSCs than MP. Our findings are similar to what has been demonstrated in human ENSCs. When comparing the human NLBs isolated from mucosal biopsy specimens (26) with those isolated from the myenteric plexus layer (25), NLBs from the biopsy specimen contain a lower percentage of cells that immunostain for p75, Sox10, and nestin. The heterogeneity seen in NLBs from the SP layer emphasizes the inherent weakness of growth selection in serum-free media as a method for isolation of ENSCs. Although there has been some success using markers such as p75, CD49b, Sox2, and Sox10 to isolate ENSCs from rodents (2, 11, 14, 16, 18), there is clearly a need to evaluate these markers for isolating ENSCs from the SP layer.
We have found that cells from SP have higher expression of CD34 and contain a large proportion of cells that are nonneural crest origin yet nestin positive (Fig. 5, D–F, arrows). Hematopoietic and mesenchymal markers including CD34, CD45RO, CD20, and c-KIT have been noted in ENSC preparations previously (33). It is notable that unlike most methods that selectively isolate ENSCs from the gut layer containing myenteric plexus, Suarez-Rodriguez et al. (33) used the entire gut for their preparations therefore it also contained the SP layer. While CD34 has traditionally been used as a marker of hematopoietic stem cells (29), there is emerging evidence that it also marks other mesenchymal stem cell populations including ICC progenitors, pericyte progenitors, vascular progenitors, and adipose tissue-derived stem cells (12, 15, 19, 22, 34). Certainly further characterization of these nonneural crest derived cells is warranted.
In conclusion, we have demonstrated that while progenitors capable of forming neurosphere-like bodies exist in both the submucosal and myenteric layers, the former appear to be predominantly of mesenchymal rather than neural crest origin and differentiate into cells of primarily a myofibroblast-like phenotype. By contrast, progenitors in the myenteric layer are more likely to represent true enteric neural stem cells. These findings have both biological and clinical significance. First, while fewer in number, ENSCs do appear to exist in both layers suggesting the ability to repopulate the submucosal and myenteric plexus from two different stem cell niches. Second, any attempt to procure ENSCs for therapeutic use from endoscopic biopsies will have to overcome the considerable challenge of isolation from a predominantly nonneural population and then scaling up the numbers. At the present time, therefore, the myenteric plexus appears to be the most promising source for obtaining ENSCs, a fact that will necessitate more invasive means of access. Finally, ENSCs derived from different layers may preferentially form different subtypes of neurons. Although abundant in MP, we could not detect nitrergic neurons in differentiated cells from SP (Fig. 7E). Clearly, future studies to address whether the true ENSCs in these two layers have intrinsic differences or are nudged into assuming a different phenotypes by other cells or factors in their local environment are necessary.
GRANTS
This work was supported by National Institute of Diabetes and Digestive and Kidney Diseases Grant R01-DK-080920-03 (to P. J. Pasricha).
DISCLOSURES
No conflicts of interest, financial or otherwise, are declared by the author(s).
AUTHOR CONTRIBUTIONS
Author contributions: L.B. and P.J.P. conception and design of research; L.B. performed experiments; L.B., S.K., G.T., M.-A.M., and P.J.P. analyzed data; L.B., S.K., G.T., M.-A.M., and P.J.P. interpreted results of experiments; L.B. prepared Figs.; L.B. drafted manuscript; L.B., S.K., G.T., M.-A.M., and P.J.P. edited and revised manuscript; P.J.P. approved final version of manuscript.
REFERENCES
- 1. Almond S, Lindley RM, Kenny SE, Connell MG, Edgar DH. Characterisation and transplantation of enteric nervous system progenitor cells. Gut 56: 489–496, 2007 [DOI] [PMC free article] [PubMed] [Google Scholar]
- 2. Bixby S, Kruger GM, Mosher JT, Joseph NM, Morrison SJ. Cell-intrinsic differences between stem cells from different regions of the peripheral nervous system regulate the generation of neural diversity. Neuron 35: 643–656, 2002 [DOI] [PubMed] [Google Scholar]
- 3. Bondurand N, Natarajan D, Barlow A, Thapar N, Pachnis V. Maintenance of mammalian enteric nervous system progenitors by SOX10 and endothelin 3 signalling. Development 133: 2075–2086, 2006 [DOI] [PubMed] [Google Scholar]
- 4. Bondurand N, Natarajan D, Thapar N, Atkins C, Pachnis V. Neuron and glia generating progenitors of the mammalian enteric nervous system isolated from foetal and postnatal gut cultures. Development 130: 6387–6400, 2003 [DOI] [PubMed] [Google Scholar]
- 5. Chai Y, Jiang X, Ito Y, Bringas P, Jr, Han J, Rowitch DH, Soriano P, McMahon AP, Sucov HM. Fate of the mammalian cranial neural crest during tooth and mandibular morphogenesis. Development 127: 1671–1679, 2000 [DOI] [PubMed] [Google Scholar]
- 6. Cracco C, Filogamo G. Neuronal and nonneuronal plasticity in the rat following myenteric denervation. Adv Exp Med Biol 429: 159–169, 1997 [DOI] [PubMed] [Google Scholar]
- 7. Danielian PS, Muccino D, Rowitch DH, Michael SK, McMahon AP. Modification of gene activity in mouse embryos in utero by a tamoxifen-inducible form of Cre recombinase. Curr Biol 8: 1323–1326, 1998 [DOI] [PubMed] [Google Scholar]
- 8. DeGiorgio R, Camilleri M. Human enteric neuropathies: morphology and molecular pathology. Neurogastroenterol Motil 16: 515–531, 2004 [DOI] [PubMed] [Google Scholar]
- 9. Hanani M, Ledder O, Yutkin V, Abu-Dalu R, Huang TY, Hartig W, Vannucchi MG, Faussone-Pellegrini MS. Regeneration of myenteric plexus in the mouse colon after experimental denervation with benzalkonium chloride. J Comp Neurol 462: 315–327, 2003 [DOI] [PubMed] [Google Scholar]
- 10. Heanue TA, Pachnis V. Enteric nervous system development and Hirschsprung's disease: advances in genetic and stem cell studies. Nat Rev Neurosci 8: 466–479, 2007 [DOI] [PubMed] [Google Scholar]
- 11. Heanue TA, Pachnis V. Prospective identification and isolation of enteric nervous system progenitors using SOX2. Stem Cells 29: 128–140, 2011 [DOI] [PMC free article] [PubMed] [Google Scholar]
- 12. Howson KM, Aplin AC, Gelati M, Alessandri G, Parati EA, Nicosia RF. The postnatal rat aorta contains pericyte progenitor cells that form spheroidal colonies in suspension culture. Am J Physiol Cell Physiol 289: C1396–C1407, 2005 [DOI] [PubMed] [Google Scholar]
- 13. Jiang X, Rowitch DH, Soriano P, McMahon AP, Sucov HM. Fate of the mammalian cardiac neural crest. Development 127: 1607–1616, 2000 [DOI] [PubMed] [Google Scholar]
- 14. Joseph NM, He S, Quintana E, Kim YG, Nunez G, Morrison SJ. Enteric glia are multipotent in culture but primarily form glia in the adult rodent gut. J Clin Invest 121: 3398–3411, 2011 [DOI] [PMC free article] [PubMed] [Google Scholar]
- 15. Kovacic JC, Boehm M. Resident vascular progenitor cells: an emerging role for nonterminally differentiated vessel-resident cells in vascular biology. Stem Cell Res 2: 2–15, 2009 [DOI] [PMC free article] [PubMed] [Google Scholar]
- 16. Kruger GM, Mosher JT, Bixby S, Joseph N, Iwashita T, Morrison SJ. Neural crest stem cells persist in the adult gut but undergo changes in self-renewal, neuronal subtype potential, and factor responsiveness. Neuron 35: 657–669, 2002 [DOI] [PMC free article] [PubMed] [Google Scholar]
- 17. Kulkarni S, Becker L, Pasricha PJ. Stem cell transplantation in neurodegenerative disorders of the gastrointestinal tract: future or fiction? Gut 61: 613–621 2011 [DOI] [PMC free article] [PubMed] [Google Scholar]
- 18. Laranjeira C, Sandgren K, Kessaris N, Richardson W, Potocnik A, Vanden Berghe P, Pachnis V. Glial cells in the mouse enteric nervous system can undergo neurogenesis in response to injury. J Clin Invest, 2011 [DOI] [PMC free article] [PubMed] [Google Scholar]
- 19. Lin CS, Xin ZC, Deng CH, Ning H, Lin G, Lue TF. Defining adipose tissue-derived stem cells in tissue and in culture. Histol Histopathol 25: 807–815, 2010 [DOI] [PubMed] [Google Scholar]
- 20. Lindley RM, Hawcutt DB, Connell MG, Almond SN, Vannucchi MG, Faussone-Pellegrini MS, Edgar DH, Kenny SE. Human and mouse enteric nervous system neurosphere transplants regulate the function of aganglionic embryonic distal colon. Gastroenterology 135: 205–216.e6, 2008 [DOI] [PubMed] [Google Scholar]
- 21. Liu MT, Kuan YH, Wang J, Hen R, Gershon MD. 5-HT4 receptor-mediated neuroprotection and neurogenesis in the enteric nervous system of adult mice. J Neurosci 29: 9683–9699, 2009 [DOI] [PMC free article] [PubMed] [Google Scholar]
- 22. Lorincz A, Redelman D, Horvath VJ, Bardsley MR, Chen H, Ordog T. Progenitors of interstitial cells of cajal in the postnatal murine stomach. Gastroenterology 134: 1083–1093, 2008 [DOI] [PMC free article] [PubMed] [Google Scholar]
- 23. Matsuyoshi H, Kuniyasu H, Okumura M, Misawa H, Katsui R, Zhang GX, Obata K, Takaki M. A 5-HT(4)-receptor activation-induced neural plasticity enhances in vivo reconstructs of enteric nerve circuit insult. Neurogastroenterol Motil 22: 806–813, e226, 2010 [DOI] [PubMed] [Google Scholar]
- 24. Metzger M. Neurogenesis in the enteric nervous system. Arch Ital Biol 148: 73–83, 2010 [PubMed] [Google Scholar]
- 25. Metzger M, Bareiss PM, Danker T, Wagner S, Hennenlotter J, Guenther E, Obermayr F, Stenzl A, Koenigsrainer A, Skutella T, Just L. Expansion and differentiation of neural progenitors derived from the human adult enteric nervous system. Gastroenterology 137: 2063–2073.e4, 2009 [DOI] [PubMed] [Google Scholar]
- 26. Metzger M, Caldwell C, Barlow AJ, Burns AJ, Thapar N. Enteric nervous system stem cells derived from human gut mucosa for the treatment of aganglionic gut disorders. Gastroenterology 136: 2214–2225.e221–3, 2009 [DOI] [PubMed] [Google Scholar]
- 27. Natarajan D, Grigoriou M, Marcos-Gutierrez CV, Atkins C, Pachnis V. Multipotential progenitors of the mammalian enteric nervous system capable of colonising aganglionic bowel in organ culture. Development 126: 157–168, 1999 [DOI] [PubMed] [Google Scholar]
- 28. Poli E, Lazzaretti M, Grandi D, Pozzoli C, Coruzzi G. Morphological and functional alterations of the myenteric plexus in rats with TNBS-induced colitis. Neurochem Res 26: 1085–1093, 2001 [DOI] [PubMed] [Google Scholar]
- 29. Rafii S, Shapiro F, Rimarachin J, Nachman RL, Ferris B, Weksler B, Moore MA, Asch AS. Isolation and characterization of human bone marrow microvascular endothelial cells: hematopoietic progenitor cell adhesion. Blood 84: 10–19, 1994 [PubMed] [Google Scholar]
- 30. Rauch U, Hansgen A, Hagl C, Holland-Cunz S, Schafer KH. Isolation and cultivation of neuronal precursor cells from the developing human enteric nervous system as a tool for cell therapy in dysganglionosis. Int J Colorectal Dis 21: 554–559, 2006 [DOI] [PubMed] [Google Scholar]
- 31. Schafer KH, Hagl CI, Rauch U. Differentiation of neurospheres from the enteric nervous system. Pediatr Surg Int 19: 340–344, 2003 [DOI] [PubMed] [Google Scholar]
- 32. Silva AT, Wardhaugh T, Dolatshad NF, Jones S, Saffrey MJ. Neural progenitors from isolated postnatal rat myenteric ganglia: expansion as neurospheres and differentiation in vitro. Brain Res 1218: 47–53, 2008 [DOI] [PubMed] [Google Scholar]
- 33. Suarez-Rodriguez R, Belkind-Gerson J. Cultured nestin-positive cells from postnatal mouse small bowel differentiate ex vivo into neurons, glia, and smooth muscle. Stem Cells 22: 1373–1385, 2004 [DOI] [PubMed] [Google Scholar]
- 34. Traktuev DO, Merfeld-Clauss S, Li J, Kolonin M, Arap W, Pasqualini R, Johnstone BH, March KL. A population of multipotent CD34-positive adipose stromal cells share pericyte and mesenchymal surface markers, reside in a periendothelial location, and stabilize endothelial networks. Circ Res 102: 77–85, 2008 [DOI] [PubMed] [Google Scholar]


