Abstract
Several studies indicate the importance of colonic microbiota in metabolic and inflammatory disorders and importance of diet on microbiota composition. The effects of alcohol, one of the prominent components of diet, on colonic bacterial composition is largely unknown. Mounting evidence suggests that gut-derived bacterial endotoxins are cofactors for alcohol-induced tissue injury and organ failure like alcoholic liver disease (ALD) that only occur in a subset of alcoholics. We hypothesized that chronic alcohol consumption results in alterations of the gut microbiome in a subgroup of alcoholics, and this may be responsible for the observed inflammatory state and endotoxemia in alcoholics. Thus we interrogated the mucosa-associated colonic microbiome in 48 alcoholics with and without ALD as well as 18 healthy subjects. Colonic biopsy samples from subjects were analyzed for microbiota composition using length heterogeneity PCR fingerprinting and multitag pyrosequencing. A subgroup of alcoholics have an altered colonic microbiome (dysbiosis). The alcoholics with dysbiosis had lower median abundances of Bacteroidetes and higher ones of Proteobacteria. The observed alterations appear to correlate with high levels of serum endotoxin in a subset of the samples. Network topology analysis indicated that alcohol use is correlated with decreased connectivity of the microbial network, and this alteration is seen even after an extended period of sobriety. We show that the colonic mucosa-associated bacterial microbiome is altered in a subset of alcoholics. The altered microbiota composition is persistent and correlates with endotoxemia in a subgroup of alcoholics.
Keywords: alcohol, alcoholic liver disease, pyrosequencing, length heterogeneity polymerase chain reaction, colon, colonic microbiota
alcoholism is associated with tissue injury and organ dysfunction in a subgroup of alcoholics, and such injury may lead to multiple complications including alcoholic liver disease (ALD) and neurological complications in 20–30% of them (14). The observation that only some, but not all, alcoholics develop tissue injury indicates that chronic alcohol abuse is necessary but not sufficient to cause organ dysfunction. Thus other cofactors besides direct toxicity of alcohol may be involved in the development of complications from alcoholism. Several animal experiments and human observational studies suggest that proinflammatory gut-derived bacterial products like endotoxin may be cofactors for the development of tissue injury associated with alcohol abuse: First, serum endotoxin levels are elevated in both humans and rats with ALD, and these levels correlate with ALD severity (3, 27). Second, monocytes from alcoholics with ALD appear to be primed for producing cytokines and oxidants after exposure to endotoxin (18). Finally, lowering serum endotoxin levels by oral administration of nonabsorbable antibiotics (1) or probiotics such as lactobacillus (26) and prebiotic oats (19) attenuates EtOH-induced liver damage in rats.
One possible cause for increased levels of gut bacterial-derived proinflammatory products in alcoholics could be alterations in the gut microbiome composition or function. In fact, diet (of which alcohol is a major component in many societies) has been shown to have a significant effect on the gut microbiome. The effect of chronic alcohol consumption on gut microbiome composition has not been well studied in humans, despite the new advances in molecular biology that have made it possible to extensively interrogate microbiota in complex biological environments like the gut (8). Thus the primary aim of this study was to characterize the gut microbiome composition in alcoholics using nonculture, next generation sequencing technologies to interrogate the 16S ribosomal RNA (16S rRNA) and validated computational techniques to taxonomically classify and compare gut bacteria.
MATERIALS AND METHODS
Subjects
Sixty-six subjects were recruited at a tertiary medical center after Institutional Review Board approval of the studies by the Rush University Institutional Review Board and verbal and written informed consent of each subject was obtained. The following groups of subjects were recruited.
ALD (n = 19): inclusion criteria.
Criteria for the ALD group were as follows: 1) fulfill the National Institute on Alcohol Abuse and Alcoholism (NIAAA) (29) and DSM-IV criteria (2) for alcoholism; 2) have a regular drinking history of at least 10 years (the minimum time thought to be required for development of liver disease); 3) presence of clinically significant liver disease as defined by at least one of the following: elevated alanine aminotransferase (ALT) or aspartate aminotransferase (AST) that is >1.5× normal, and either low platelets, low albumin, or elevated bilirubin; clinical evidence of liver disease on the physical exam; when available, radiological [computerized tomography (CT) or ultrasound] or histological evidence of liver disease. To avoid confounding effects of advanced cirrhosis on bacterial composition, we chose to study only patients with mild liver disease. In fact, the majority of our subjects with ALD had a Child-Pugh class of A (see Table 1). Exclusion criteria were as follows: 1) positive for Hepatitis C antibody, hepatitis C RNA, or hepatitis B surface antigen; 2) evidence of liver disease of another etiology such as autoimmune disease.
Table 1.
Subject characteristics
| ALD | ALC | HC | P Value | |
|---|---|---|---|---|
| n | 19 | 28 | 18 | |
| Age | 50 (31, 71) | 41 (23, 71) | 49 (30, 62) | 0.216 |
| Sex, male, % | 12 (63) | 23 (79) | 12 (67) | 0.425 |
| Race, Caucasian, % | 14 (82) | 20 (71) | 13 (72) | 0.757 |
| Amount of drinking* | 57,060 (4,320, 587,520) | 35,280 (5,760, 287,280) | 1,224 (0, 8,640) | < 0.001 |
| Duration of drinking, years | 28 (7, 51) | 19 (5, 41) | 24 (0, 43) | 0.120 |
| Child-Pugh, A,B,C, % | 74, 16, 10 | — | — | — |
| AST | 47 (21, 163) | 26 (17, 67) | 20 (15, 30) | < 0.001 |
| ALT | 31 (18, 133) | 30 (10, 95) | 20 (10, 49) | 0.082 |
| Total bilirubin | 0.9 (0.1, 13.1) | 0.5 (0.1, 2.0) | 0.4 (0.3, 1.1) | 0.005 |
| Endotoxin | 2.516 (0.860, 3.530) | 2.461 (1.000, 6.125) | 0.675 (0.389, 1.458) | 0.001 |
| At least college education, % | 5 (28) | 12 (43) | 9 (50) | 0.378 |
| Binge drinking, % | 5 (45) | 9 (53) | 0 (0) | 0.006 |
| Need for increasing drinks, % | 9 (53) | 19 (66) | 1 (6) | < 0.001 |
| Usual drinks, % | ||||
| Beer | 8 (44) | 17 (59) | 9 (53) | 0.639 |
| Wine | 6 (33) | 11 (38) | 11 (65) | 0.121 |
| Hard liquor | 12 (67) | 23 (79) | 3 (18) | < 0.001 |
| History, % | ||||
| Ulcers | 4 (22) | 3 (10) | 0 (0) | 0.095 |
| IBS | 1 (6) | 0 (0) | 1 (6) | 0.303 |
| Transfusion | 9 (50) | 2 (7) | 1 (6) | < 0.001 |
| Jaundice | 8 (44) | 4 (14) | 0 (0) | 0.002 |
| Gastrointestinal bleed | 12 (67) | 3 (10) | 1 (6) | < 0.001 |
| Family history of ALD, % | 2 (11) | 8 (28) | 3 (17) | 0.383 |
| Family history of drinking, % | 7 (41) | 19 (79) | 8 (47) | 0.027 |
| Sodium | 140 (126, 145) | 140 (135, 145) | 140 (138, 143) | 0.771 |
| Potassium | 4.0 (3.5, 5.9) | 4.1 (3.4, 5.0) | 4.0 (3.5, 5.0) | 0.350 |
| Chloride | 104 (95, 109) | 104 (99, 108) | 105 (101, 108) | 0.416 |
| Bicarbonate | 25 (21, 28) | 26 (22, 33) | 25 (21, 30) | 0.044 |
| Blood urea nitrogen | 13 (2, 49) | 14 (8, 26) | 13 (7, 19) | 0.349 |
| Creatinine | 0.8 (0.6, 1.6) | 0.9 (0.6, 1.6) | 1.0 (0.7, 1.2) | 0.032 |
| Glucose | 99 (57, 176) | 81 (51, 115) | 88 (71, 159) | 0.026 |
| Total protein | 6.9 (4.7, 8.6) | 7.3 (6.0, 9.3) | 7.5 (6.9, 8.2) | 0.034 |
| Albumin | 3.7 (1.9, 4.6) | 4.1 (3.6, 4.5) | 4.2 (3.6, 4.7) | 0.017 |
| Calcium | 9.1 (7.6, 9.7) | 9.1 (8.0, 10.4) | 9.4 (8.6, 10.2) | 0.043 |
| Alkaline phosphatase | 112 (60, 720) | 72 (45, 123) | 67 (43, 107) | 0.008 |
| Hemoglobin A1c | 5.6 (4.7, 6.1) | 5.6 (5.3, 7.3) | 5.6 (5.0, 7.9) | 0.613 |
| Ferritin | 169 (33, 336) | 74 (19, 735) | 80 (6, 170) | 0.069 |
| Hemoglobin | 14.0 (6.4, 18.4) | 14.7 (12.5, 16.8) | 14.8 (11.3, 16.4) | 0.548 |
| MCV | 91.8 (79.4, 105.0) | 91.7 (75.6, 105.0) | 86.7 (66.2, 93.1) | 0.004 |
| Platelet | 130 (54, 427) | 218 (124, 603) | 235 (177, 342) | <0.001 |
| WBC | 6.2 (2.4, 9.9) | 6.2 (3.5, 15.8) | 6.3 (3.3, 11.4) | 0.573 |
| CRP | 5.8 (1.0, 50.9) | 5.0 (1.0, 57.0) | 5.0 (5.0, 98.4) | 0.171 |
| ASMA, % | 1 (11) | 2 (17) | 1 (9) | < 0.999 |
| ANA, % | 3 (27) | 1 (8) | 1 (8) | 0.405 |
| PT | 13.7 (11.2, 22.6) | 12.2 (10.9, 14.0) | 12.2 (11.0, 13.2) | 0.020 |
| INR | 1.14 (0.91, 1.80) | 1.03 (0.91, 1.24) | 1.02 (0.92, 1.13) | 0.036 |
| Fiber, adjusted, g/day | 11.2 (8.7, 30.9) | 17.7 (10.7, 21.7) | 14.0 (8.6, 50.6) | 0.524 |
| %Fruits/vegetables, adjusted | 3.6 (1.5, 11.6) | 4.7 (2.9, 8.9) | 3.9 (1.4, 7.0) | 0.473 |
| %Fat, adjusted | 34.5 (28.5, 45.9) | 33.4 (26.2, 39.6) | 32.2 (27.6, 59.6) | 0.728 |
| Smoking, % | ||||
| Never | 5 (26) | 4 (14) | 11 (61) | 0.007 |
| Current | 7 (37) | 16 (55) | 2 (11) | 0.007 |
| Quit | 7(37) | 9 (31) | 5 (28) | 0.007 |
| Illegal drug use, % | 8 (44) | 18 (64) | 2 (11) | 0.002 |
For subject characteristics, n (%) or median (minimum, maximum) by group. *Estimated total drinks = (average drinks/day) × (days/month reported drinking) × 12 × (years drinking); **Kruskal-Wallis used for nonparametric continuous or ordinal data; χ2 test or Fisher exact test used for categorical data. ALD, alcoholics with liver disease; ALC, alcoholics without liver disease; HC, healthy controls; ALT, alanine aminotransferase; AST, aspartate aminotransferase; IBS, irritable bowel syndrome; MCV, mean corpuscular volume; WBC, white blood count; CRP, C-reactive protein; ASMA, anti-smooth muscle antibody; ANA, antinuclear antibody; PT, prothrombin time; INR, international normalized ratio.
There are two subgroups within the ALD group. For active alcoholics with liver disease (AA ± ALD, n = 8), criteria were all criteria for ALD plus actively drinking up to 7 days before sample collection per subject report or other evidence such as clinical records or exam. However, none were drinking 3 days before giving consent and signing the consent form to assure that they fully understood the study. For sober alcoholics with liver disease (SA ± ALD; n = 11), criteria were all criteria for ALD plus no alcohol consumption for at least 1 mo before sample collection per subject report or other evidence such as clinical records or exam.
Alcoholics without liver disease (n = 29).
Inclusion criteria for alcoholism and minimum duration of alcohol consumption were identical to the ALD group. Alcoholics were excluded for this group if they had any evidence of liver disease; specifically, they were excluded if they had ALD as defined in the inclusion criteria for the ALD group. Alcoholics were also excluded if they had any viral or autoimmune liver disease as defined in the exclusion criteria for the ALD group.
There are two subgroups within the alcoholics without liver disease (ALC) group: active alcoholics without liver disease (AA; n = 14) and sober alcoholics without liver disease (SA; n = 15). Criteria to define actively drinking and sobriety were identical to the ALD group.
Healthy control group (n = 18): inclusion criteria.
Criteria for the healthy control group (HC) were as follows: 1) normal physical exam, no digestive complaints, no known liver disease, normal liver function tests (ALT, AST, bilirubin, alkaline phosphatase, serum albumin) and 2) consumption of no more than a moderate amount of alcohol [NIAAA definition (29)]. Exclusion criteria were as follows: 1) daily drinkers (>3× per wk) and 2) drinking (≥3 drinks per occasion).
Additional exclusion criteria for all groups.
Additional exclusion criteria for all groups were as follows: 1) use of antibiotics for at least 4 wk before sample collection; 2) unreliable drinking history (to rule out closet drinkers or pretenders); 3) significant renal impairment (creatinine >1.2 mg/dL); 4) diseases that affect gastrointestinal motility such as scleroderma, insulin-dependent diabetes, and/or uncontrolled diabetes (Hgb-A1c >8%); 5) clinically significant dehydration, clinically detectable ascites, or significant peripheral edema, sepsis; 6) clinically significant cardiac failure; 7) regular daily use of medications that may affect intestinal permeability such as NSAIDs or intestinal motility (e.g., metoclopramide); 8) subjects positive for other markers of liver disease such as smooth muscle antibody, hepatitis B surface antigen, hepatitis C antibody, or hemochromatosis markers; 9) subjects with very low platelet count (<80 k), uncorrectable prolonged PT (>15 s), or history of bleeding that preclude biopsies; 10) Asian descent due to the possible confounding effect of a different polymorphism of enzymes involved in alcohol metabolism. Demographic characteristics of the study subjects enrolled in each of the groups are given in Table 1. Severity of liver disease was graded by the Child-Pugh score (33).
From these subjects, the microbiota from the biofilm associated with the gut mucosa (mucosa-associated microbiome) was chosen to be analyzed because we have shown previously that the mucosa-associated microbiome can be very different from the luminal microbiome (12, 20).
Tissue Procurement
A limited and unprepped sigmoidoscopy was performed using Olympus video scopes (Olympus America, Center Valley, PA) for research purposes. During biopsy procurement, we inflated the rectum with air. All subjects had solid stool; therefore, there was little covering of the mucosa with mucoid stool itself, and solid chunks of stool were seen in the rectum. Care was taken not to use any suction during advancement of the scope to 20–25 cm from the anal verge. The sterile biopsy forceps were not taken out of the channel of the scope until an area that is completely clear of stool was seen with clear pink mucosa. Biopsies were taken from the pink mucosa that is not covered with any stool, at the sigmoid colon at about 20–25 cm from the anal verge using a 2.2 mm sterile standard biopsy forceps. All samples were immediately snap frozen at the time of collection in liquid nitrogen and were stored in a −80°C freezer until analysis.
Interrogation of Intestinal Bacteria
We used molecular methods to interrogate and characterize gut microbiome composition in alcoholics. First, we used Length Heterogeneity PCR (LH-PCR) fingerprinting to rapidly survey our samples and standardize the community amplification. We then interrogated the microbial taxa associated with the gut mucosal microbiome using multitag pyrosequencing (MTPS) on a subset of the samples (51 of 66 samples) (13). We used MTPS to interrogate gut mucosal microbiome of all patients with ALD (n = 19), 22 of 28 subjects with ALC, and 10 of 18 healthy subjects. We elected to interrogate all subjects with ALD because, according to our original hypothesis, the alcoholics with liver disease group was our experimental group, whereas the alcoholics without liver disease group was our control group for alcoholism. We randomly selected samples from HC and ALC groups with ∼2:1 favoring ALC group over the healthy subject group. The MTPS latter technique allows the rapid sequencing of multiple samples at one time yielding thousands of sequence reads per sample. We chose to interrogate the mucosa-associated microbiome rather than stool because of potentially higher relevance of this to mucosal epithelial function in contrast with the luminal fecal microbiome, which has been postulated to be transient and could be related to dietary factors (30).
LH-PCR fingerprint analysis.
LH-PCR fingerprinting was done as published previously (20). Fingerprints were obtained in duplicate or triplicate for each sample. Briefly, total genomic DNA was extracted from tissue using Bio101 kit from MP Biomedicals, Montreal, Quebec, as per the manufacturer's instructions. About 10 ng of extracted DNA was amplified by PCR using a fluorescently labeled forward primer 27F [5′-(6FAM) AGAGTTTGATCCTGGCTCA G-3′] and unlabeled reverse primer 355R′ (5′-GCTGCCTCCCGTAGGAGT-3′) that are universal primers for bacteria (21). The LH-PCR products were diluted according to their intensity on agarose gel electrophoresis and mixed with ILS-600 size standards (Promega) and HiDi Formamide (Applied Biosystems, Foster City, CA). The diluted samples were then separated on the SCE9610 fluorescent capillary sequencer (Spectrumedix, State College, PA) and processed using the GenoSpectrum software package (Spectrumedix LLC, State College, PA). The GenoSpectrum software package deconvolves the fluorescence data and converts it into electropherograms where the peaks of the electropherograms represent PCR amplicons representing different species or Operational Taxonomic Units (OTU). The LH-PCR fingerprinting data were then analyzed using a custom PERL script that combines data from several runs, interleaves the various profiles, and normalizes the data. The normalized peak areas were calculated by dividing an individual peak area by the total peak area in that profile. Hence each normalized peak area corresponded to the relative abundance of a specific OTU within the sample. Duplicate or triplicate LH-PCRs were run on each sample, and the most consistent profile was selected for further analysis. Peaks constituting less than 1% of the total community from each sample were eliminated from the analysis to remove the variable low abundance components within the communities. We chose threshold of 1% because this value corresponds to the detection limit of the LH-PCR technology, and any peaks less than 1% may not be reproducible. Additionally, an underlying a priori assumption for this filtering is that the low abundance components of the community vary between individual subjects and will not contribute significantly to the functionality of the gut mucosal microbiome (11). We have also used the LH-PCR fingerprinting methodology as a quality control measure to assure that we are linearly amplifying the community so that the resulting sequence analysis accurately represents the community composition as described below.
MTPS.
We employed a MTPS process (13) to characterize the microbiome from a subset of the mucosal samples that were used in the LH-PCR analysis. Specifically, we have generated a set of 48 emulsion PCR fusion primers that contain the 454 emulsion PCR linkers and different 7 base barcode on either of the 27F or 355R universal 16S rRNA primers. Thus each mucosal sample was amplified with a uniquely barcoded set of forward and reverse 16S rRNA primers, and then up to 48 samples were pooled and subjected to emulsion PCR and pyrosequenced using a GS-FLX pyrosequencer (Roche). Data from each pooled sample were deconvoluted by sorting the sequences into bins based on the barcodes using custom PERL scripts. Thus we were able to normalize each sample by the total number of reads from each barcode. We have noted that ligating tagged primers to PCR amplicons distort the abundances of the communities, and thus it is critical to incorporate the tags during the original amplification step. We therefore used fusion primers during the pyrosequencing reaction and eliminated the ligation step that has been used by others (4). Several groups have employed various barcoding strategies to analyze multiple samples, and this strategy is now well accepted (34).
Analysis of MTPS Data
Quantitative Insights Into Microbial Ecology (QIIME) software pipeline (VirtualBox Version 1.1.0) was used to analyze the MTPS data (6). Low quality sequences and sequences less than 100 bp were eliminated from the analysis by filtering using custom PERL scripts (28). OTUs were picked using uclust (22, 23) at a 97% similarity. Sequences were aligned with PyNAST (5) and identified using the RDP database and a naïve Bayesian classifier (36) using a 75% bootstrap value threshold.
We tabulated results for each taxa in each sample. We visually examined the ordination of cases (i.e., clustering of the cases) by principal coordinates (PCO) analysis for the presence of dysbiosis. The PCO and canonical correspondence analysis (CCA) were performed using the Multivariate Statistical Package (Kovach, Wales, UK). A Bray Curtis distance metric was used for the PCO analysis. Environmental variables were normalized for the CCA.
With Qiime, weighted and unweighted Unifrac distances (15) were also used to generate β-diversity graphs. The FastUnifrac was used to generate the overall Unifrac p-test (16), which is generated by analyzing the clustering of the taxa for each sample in a phylogram and then comparing the topology of the phylograms for the samples for each class. α-Diversity was assessed using the Chao estimator.
Measurement of Endotoxin
Gram negative bacterial endotoxin in human serum specimens was quantitated using the QCL-1000 kit manufactured by BioWhittaker/Cambrex in compliance with the U.S. FDA Guideline Validation of the LAL test as an end-product endotoxin test for human and animal parenteral drugs, biological products, and medical devices. Serum blanks were used in addition to the kit standards.
Diet Analysis
National Institutes for Health, Eating at America's Table All day Fruit and Vegetable Screener (riskfactor.cancer.gov/diet/screeners/fruitveg/instrument.html), and Percent Energy from Fat Screener (http://riskfactor.cancer.gov/diet/screeners/fat/) were employed to estimate fruit, vegetable, fiber, and fat intake.
Statistics
SAS (Version 9.1; Cary, NC) statistical package was used to analyze clinical metadata and differences in clinical variables between the dysbiotic and nondysbiotic groups. SPSS (Version 17.0.0; Chicago, IL) was used to perform nonparametric Kruskal-Wallis or Mann-Whitney tests in the clinical study groups and to perform median tests, as appropriate. χ2-Test or t-tests were used to detect differences in proportions between groups as appropriate in SAS or SPSS. Metastats was used to compare bacterial groups in the dysbiotic and nondysbiotic analysis, with a nonparametric t-test as described previously (37). R-project packages rgl and car were used to generate scatterplots (R-project.org).
RESULTS
Study Subjects
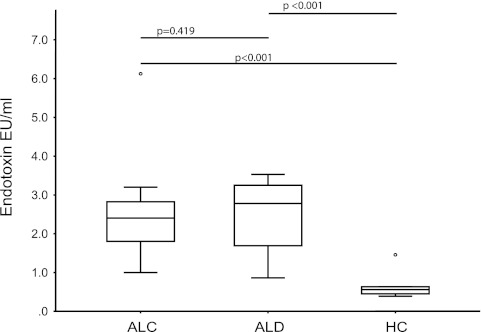
There were no statistically significant differences in terms of age, sex, and race among the three study groups, namely ALC, ALD, and HC (Table 1). As expected, the estimated cumulative lifetime amount of alcohol intake was significantly higher in both alcoholic subject groups (i.e., ALC and ALD) compared with HC (P < 0.001). The duration of drinking was similar among the two groups of alcoholics (P = 0.12). Binge drinking, need for increasing amounts of drinking, and hard liquor drinking were more frequent in the alcoholic subject groups compared with HC (Table 1). Most of the subjects with ALD had a Child-Pugh class of A, compatible with mild cirrhosis. The total bilirubin, AST, PT, and INR were significantly higher in the ALD group compared with the ALC and HC groups as expected (Table 1). Albumin, calcium, RBC, and platelet counts were lower in the ALD group (Table 1). The ALT was not significantly different between the groups despite a higher numeric value in the ALD group (P = 0.082). As expected, history of GI bleed and blood transfusion and jaundice were more frequent in the ALD group compared with the ALC and HC groups (Table 1). Smoking and history of past drug use was reported more often in both of the alcoholic groups, compared with HCs (Table 1). Also as expected, alcoholic groups had more diabetic cases, who had mild increases in serum glucose without a significantly elevated hemoglobin A1c (Table 1). Additionally, serum endotoxin levels were significantly higher in both alcoholic groups compared with HC (P < 0.001) (Fig. 1). The endotoxin values for all HC subjects were in the first 25% quartile of all the endotoxin values. There was no difference between serum endotoxin levels among the alcoholics with and without liver disease (P = 0.419).
Fig. 1.
Endotoxin values by study group. Endotoxin values are in endotoxin units per milliliter. When the 3 study groups [healthy controls (HC) vs. alcoholics without liver disease (ALC) vs. alcoholics with liver disease (ALD)] are compared, endotoxin values were statistically significantly different (P = 0.001; Kruskal-Wallis). Results of post hoc comparisons are given as bars at top part of graph.
Analysis of LH-PCR Fingerprint Data
Total DNA was extracted from each of the 66 biopsy samples. The V1 to V2 hypervariable regions of the 16S rRNA were amplified with PCR using universal bacterial primers. This generated PCR products (i.e., amplicons) from all of the bacterial taxa in each sample, which vary in length based on the size of the hypervariable region within the bacteria in a given sample. Each PCR product from each of the samples was then separated using fluorescent capillary electrophoresis, to produce an electropherogram consisting of peaks of variable lengths, representing OTUs or taxa in the sample. The height of each peak on the electropherogram corresponds to the abundance of a particular OTU within the sample. Thus each electropherogram is a fingerprint of the bacterial community within a given sample. Each electropherogram was used to do an initial analysis of the quality of the amplification process and to estimate the community diversity.
Fingerprints were analyzed to visualize clustering of the 66 samples using PCO with a Bray Curtis distance measure. PCO is an ordination method similar to principal components analysis (PCA) except it uses a distance metric instead of covariances. The method performs a matrix analysis (i.e., an Eigen analysis) to plot the variance of the data along orthogonal axes or principle components. The first principle component represents the largest amount of variation in the dataset, whereas the second principle component represents the next largest measure of the variance.
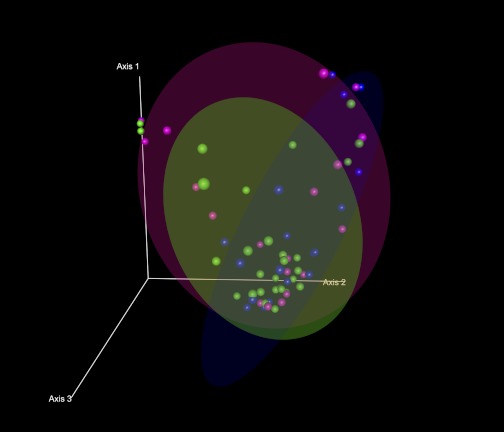
Figure 2 shows the distribution of each case along the first three axes of the PCO in a three-dimensional scatterplot. The locations for each of the ellipsoids that contain 70% of the cases in the ALC group, the ALD group, and the HC group along the first three PCO axes appeared markedly different among the groups. Specifically, a proportion of alcoholics from both the ALC and ALD groups was located far away from the HC cluster. This finding suggests that a subgroup of subjects with alcoholism (both with and without liver disease) may have altered colonic microbiota composition in comparison with HC.
Fig. 2.
Principal coordinate analysis (PCO) plots of the length heterogeneity (LH)-PCR fingerprint abundance data in 3 dimensions. The axes represent the first highest discriminating axes using a Bray Curtis distance measure. HC are depicted as blue. ALC are depicted as green. ALD are depicted as magenta. Each dot corresponds to 1 case. Circles denote the 70% ellipsoid for each group.
Analysis of MTPS Data
To identify the specific bacterial taxa that were implicated in the dysbiotic bacterial communities in alcoholics, we performed MTPS on 51 of the 66 sigmoid mucosa samples from HC (n = 10), ALC (n = 22), and ALD (n = 19). We obtained 111,174 raw reads from two GS FLX pyrosequencing runs and identified the appropriate tags in 105,207 of these reads. Low-quality sequences below read lengths of 100 bp were filtered out, leaving 80,121 total reads that were analyzed. The filtered reads had an average read of 1,571 per sample and an average read length of 243 bps. Negative controls did not demonstrate contamination during the pyrosequencing process.
β-Diversity analyses.
β-Diversity is the measure of change in diversity between samples across environmental gradients (38). In our case, it reflects the changes in bacterial composition between different levels of alcohol exposure and disease in the clinical study groups, i.e., it reflects shifts in the microbial community composition with exposure to alcohol. Various metrics can be used to determine differences in bacterial composition between the clinical study groups. These metrics can be based on mathematical distances such as a Euclidian distance or a Bray Curtis distance. Alternatively, these metrics could measure the topology of a phylogenetic tree (Unifrac distance) constructed using the samples. We have used both methods to analyze our data.
TAXA ABUNDANCE ANALYSIS.
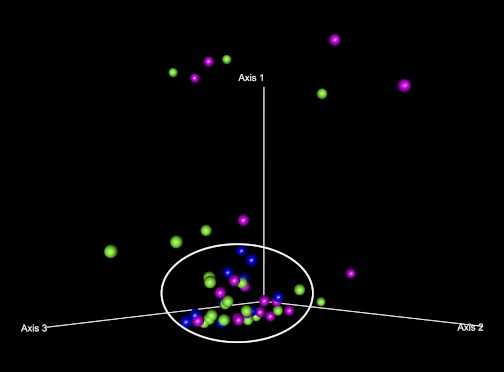
Taxa present in each sample were tabulated according to the RDP10 bacterial sequence database using a naive Bayesian classifier. The samples were then ordinated using PCO for clustering, i.e., for the presence of dysbiosis. Figure 3 depicts the PCO analysis of the relative abundance of each bacterial taxa in a sample at the class level. A cluster of subjects with a similar microbiome composition has been denoted by a circle in Fig. 3 and is referred to as the nondysbiotic group. The rest of the samples located outside of this circle represent the cases that have a dysbiotic microbiome composition and have been denoted as the dysbiotic group. As shown in the PCO graph, using this definition, not all subjects with alcoholism or liver disease were dysbiotic, but there were 13 cases identified as dysbiotic. Furthermore, most of the HCs were clustered closer to each other compared with the alcoholics. It also appears that the microbiome composition (i.e., taxa and their abundance) was primarily altered in alcoholics when they were compared with HC: None of the healthy subjects (blue dots) (0 of 10) were outside the core cluster (i.e., are not dysbiotic), whereas 8 of 22 (36.7%) ALD subjects (magenta dots) and 5 of 19 (26.3%) of ALC subjects (green dots) were dysbiotic. However, PCO analysis did not show a visual differential clustering between subjects with liver disease compared with those without liver disease, even though more of the dysbiotic cases were from the ALD group. Similarly, the sober and active alcoholics did not differentially cluster in the graph.
Fig. 3.
Ordination by PCO plots of the taxa abundance at the class level in 3 dimensions. The axes represent the first 3 highest discriminating axes using a Bray Curtis distance measure. HC are depicted as blue. ALC are depicted as green. ALD are depicted as magenta. The core microbiome cluster is denoted by a manually inserted circle. Cases outside of the circle are classified as dysbiotic.
UNIFRAC BASED ANALYSIS.
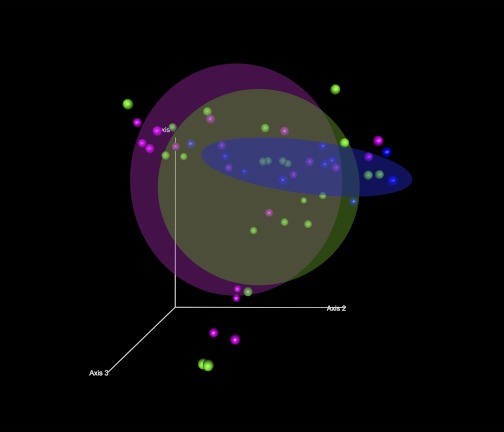
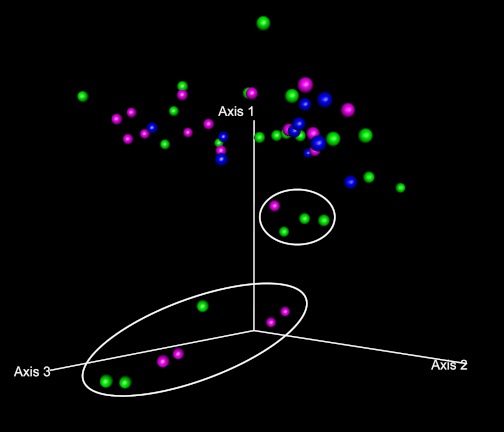
Second, differences between the study groups in the sequence data were analyzed using weighted Unifrac analysis. Unifrac analysis examines the relationships within the studied cases based on their distances from each other in a phylogenetic tree. The sequences were first clustered into OTUs and then assigned taxonomic ID and a neighbor joining tree was generated as described in the materials and methods. Overall Unifrac p-test for the entire sample set was performed on FastUnifrac (16), indicating significant clustering of the sample class within the phylogenetic tree (P = 0.001). A PCO analysis using weighted Unifrac distances between cases (Fig. 4) demonstrates that the 70% ellipsoid for the HC group appears different than the corresponding ellipsoids for both the ALC and ALD groups, although there is some overlap. When individual cases are examined in Fig. 5 (shown at a different 3-dimensional angle for further clarity), about 25% of the alcoholic cases (11 of 41) (that are denoted by 2 separate circles) lie away from the main cluster of cases.
Fig. 4.
Ordination by weighted Unifrac distances by subject group. PCO plots of the subjects by subject group using weighted Unifrac distances are shown. The axes represent the first 3 highest discriminating axes. HC are depicted as blue. ALC are depicted as green. ALD are depicted as magenta. Circles represent 70% ellipsoids for each group.
Fig. 5.
Ordination by weighted Unifrac distances identifying dysbiotic cases. PCO plot by study group at a different angle denoting the dysbiotic cases is shown. HC are depicted as blue. ALC are depicted as green. ALD are depicted as magenta. Cases that lie away from the core HC group ellipsoid are given in 2 circles and denote the dysbiotic cases identified by weighted Unifrac analysis. Dysbiotic cases belong to both the ALC and ALD groups.
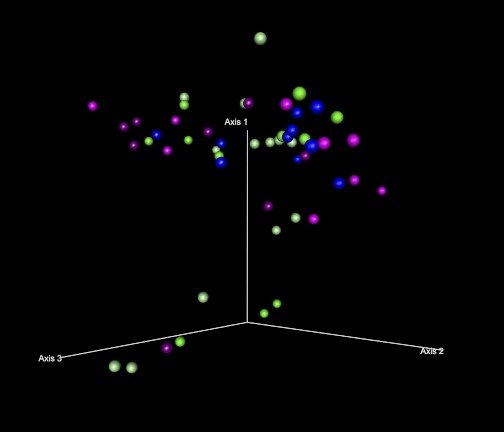
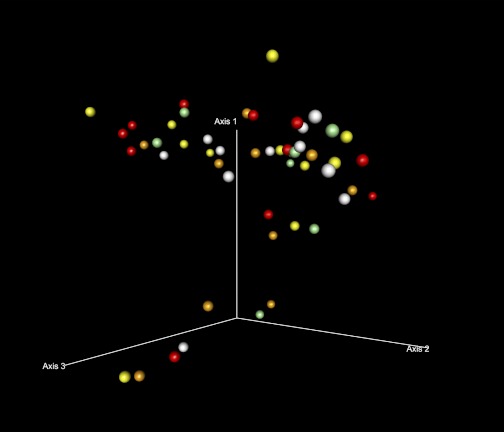
Whether these eleven cases show a continuum of change away from HC needs to be further evaluated. The dysbiotic cases were almost equally distributed among the ALC and ALD groups, indicating no apparent difference by liver disease status. In secondary comparisons, sobriety status did not clearly differentiate the dysbiotic cases from the rest (Fig. 6), neither did serum endotoxin value quartiles (Fig. 7).
Fig. 6.
Ordination by weighted Unifrac distances by sobriety status. PCO plot of the subjects by sobriety status using weighted Unifrac distances is shown. HC are depicted as blue. ALC are depicted as green: sober alcoholics with ALC are depicted as light green and active alcoholics with ALC are depicted as dark green. ALD are depicted as magenta: sober alcoholics with ALD are depicted as light magenta and active alcoholics with ALD are depicted as dark magenta. The dysbiotic cases were not discriminated by sobriety status.
Fig. 7.
Ordination by weighted Unifrac distances by endotoxin quartile. PCO plot of the subjects by endotoxin quartile using weighted Unifrac distances is shown. Endotoxin quartile increases as colors get darker: white, light yellow, orange, and red represent 1st (lowest), 2nd, 3rd, and 4th (highest) endotoxin quartiles, respectively. The dysbiotic cases were not discriminated by endotoxin quartile. Cases in which endotoxin levels were not available were depicted in green.
In summary, both the taxa abundance and Unifrac-based β-diversity analyses show that a subset of alcoholics is dysbiotic. Below, we study the differences in individual bacterial taxa in the clinically defined groups, as well as groups defined by the above analyses.
Differences between individual bacterial taxa.
DIFFERENCES BETWEEN TAXA IN THE CLINICALLY DEFINED STUDY GROUPS.
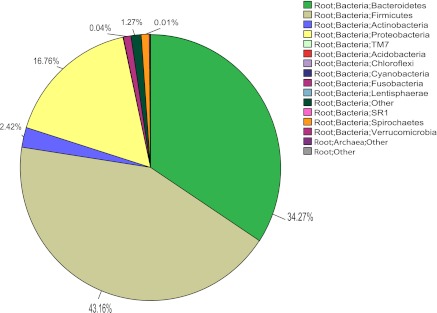
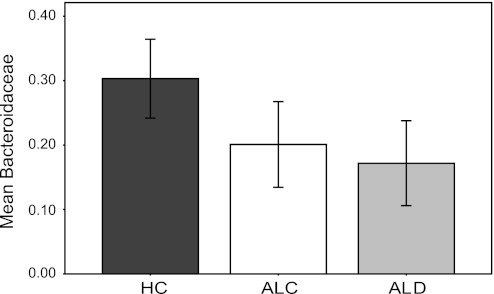
The majority (99.9%) of the sequences found in the dataset were classified as bacteria, with <0.01% of the sequences classified as archaea or other. The minor differences among the study groups (HC vs. ALC vs. ALD) in archaea or unclassified sequences were not statistically significant. At the phylum level, the sequences seen were typical of gut microbiota (Fig. 8) and there were no differences between the clinically defined study groups at this taxonomic level. At the family level, as shown in Fig. 9, the mean abundance of Bacteroidaceae from Bacteroidetes was decreased in the alcoholic groups compared with the HC and the groups were statistically significantly different (P = 0.035; Kruskal-Wallis). When taxa that had an abundance >1% were examined only, there were no other major differences between the study groups.
Fig. 8.
Pie chart of multitag pyrosequencing data analyzed at the phylum level. Uncommon phyla that are a very small fraction of the total may not be visible in the chart even though they are present in the legend.
Fig. 9.
Bar graph of mean percent abundance of Bacteroidaceae at family level in the study groups ± 2 SE. Mean abundance of Bacteroidaceae was decreased in the alcoholic groups (P = 0.035; Kruskal-Wallis).
DIFFERENCES BETWEEN THE BACTERIAL TAXA OBSERVED IN DYSBIOTIC AND NONDYSBIOTIC CASES.
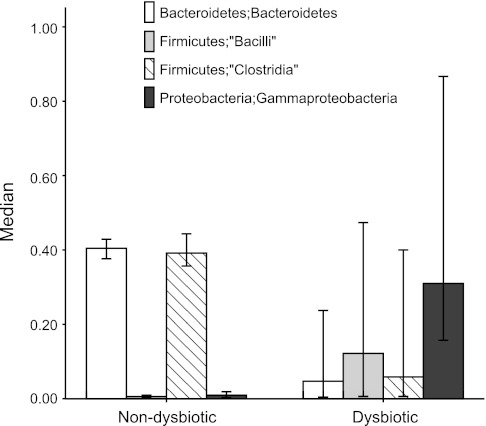
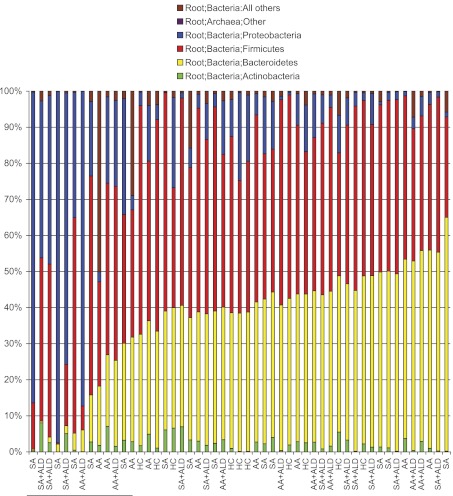
The community composition of the dysbiotic and nondysbiotic groups appeared different regardless of the methodology used to identify dysbiotic cases. In fact, eleven cases were identified as dysbiotic in both of the β-diversity analysis methods (namely, visual examination of the ordination by PCO using Bray-Curtis or weighted Unifrac distances). The eleven cases denoted as dysbiotic by both of these ordination methods were then used to identify the differences between bacterial taxa in the dysbiotic and nondysbiotic groups. We compared the 11 dysbiotic cases to the nondysbiotic ones at the class level using the Metastats statistical analysis (37). Results are shown in Table 2. At the class level, there was a uniform reduction of Bacteroidetes in the dysbiotic cases. Other major differences included decreases in Clostridia and increases in Bacilli and Gammaprotoebacteria in the dysbiotic group compared with the nondysbiotic group (Fig. 10). In fact, when the cases were ordered at the phyla level in terms of their Bacteroidetes abundance, all of the eleven dysbiotic cases were seen to cluster at the lower Bacteroidetes-abundance-end of the graph (Fig. 11). Therefore, the community composition of the dysbiotic cases is very different from those within the nondysbiotic cases, suggesting an overall disarray of the gut bacterial microbiome in the dysbiotic cases.
Table 2.
Differing taxa between dysbiotic and nondysbiotic subject groups
| Percent Abundance of Bacterial Taxa |
||||||
|---|---|---|---|---|---|---|
| Dysbiotic |
Nondysbiotic |
|||||
| Name of Bacterial Taxa at Class Level | Mean | Variance | Mean | Variance | P Value | Q Value |
| Archaea; Other | 0.0000 | 0.0000 | 0.0000 | 0.0000 | 1.000 | 1.000 |
| Acidobacteria; Acidobacteria | 0.0000 | 0.0000 | 0.0000 | 0.0000 | 1.000 | 1.000 |
| Actinobacteria; Actinobacteria | 0.0283 | 0.0008 | 0.0242 | 0.0003 | 0.634 | 1.000 |
| Bacteroidetes; Bacteroidetes | 0.0911 | 0.0100 | 0.4007 | 0.0061 | 0.001 | 0.016 |
| Bacteroidetes; Flavobacteria | 0.0002 | 0.0000 | 0.0001 | 0.0000 | 0.359 | 1.000 |
| Bacteroidetes; Other | 0.0001 | 0.0000 | 0.0025 | 0.0000 | 0.009 | 0.123 |
| Bacteroidetes; Sphingobacteria | 0.0005 | 0.0000 | 0.0001 | 0.0000 | 0.022 | 0.256 |
| Chloroflexi; Anaerolineae | 0.0000 | 0.0000 | 0.0001 | 0.0000 | 1.000 | 1.000 |
| Cyanobacteria; Cyanobacteria | 0.0011 | 0.0000 | 0.0003 | 0.0000 | 0.148 | 1.000 |
| Firmicutes; “Bacilli” | 0.1651 | 0.0356 | 0.0074 | 0.0001 | 0.001 | 0.016 |
| Firmicutes; “Clostridia” | 0.1626 | 0.0330 | 0.4105 | 0.0068 | 0.001 | 0.016 |
| Firmicutes; “Erysipelotrichi” | 0.0195 | 0.0018 | 0.0386 | 0.0024 | 0.256 | 1.000 |
| Firmicutes; Other | 0.0002 | 0.0000 | 0.0022 | 0.0000 | 0.001 | 0.016 |
| Fusobacteria; Fusobacteria | 0.0017 | 0.0000 | 0.0120 | 0.0023 | 0.337 | 1.000 |
| Lentisphaerae; Lentisphaerae | 0.0000 | 0.0000 | 0.0000 | 0.0000 | 1.000 | 1.000 |
| Root; Bacteria; Other | 0.0092 | 0.0001 | 0.0144 | 0.0003 | 0.244 | 1.000 |
| Proteobacteria; Alphaproteobacteria | 0.0104 | 0.0007 | 0.0033 | 0.0000 | 0.513 | 1.000 |
| Proteobacteria; Betaproteobacteria | 0.0563 | 0.0062 | 0.0287 | 0.0009 | 0.354 | 1.000 |
| Proteobacteria; Deltaproteobacteria | 0.0022 | 0.0000 | 0.0034 | 0.0001 | 0.643 | 1.000 |
| Proteobacteria; Epsilonproteobacteria | 0.0019 | 0.0000 | 0.0020 | 0.0000 | 0.984 | 1.000 |
| Proteobacteria; Gammaproteobacteria | 0.4480 | 0.1116 | 0.0358 | 0.0029 | 0.001 | 0.016 |
| Proteobacteria; Other | 0.0008 | 0.0000 | 0.0004 | 0.0000 | 0.612 | 1.000 |
| SR1; SR1_genera_incertae_sedis | 0.0000 | 0.0000 | 0.0000 | 0.0000 | 1.000 | 1.000 |
| Spirochaetes; Spirochaetes | 0.0008 | 0.0000 | 0.0129 | 0.0063 | 0.837 | 1.000 |
| TM7; TM7_genera_incertae_sedis | 0.0000 | 0.0000 | 0.0000 | 0.0000 | 1.000 | 1.000 |
| Verrucomicrobia; Verrucomicrobiae | 0.0001 | 0.0000 | 0.0005 | 0.0000 | 0.032 | 0.330 |
| Root; Other | 0.0001 | 0.0000 | 0.0001 | 0.0000 | 1.000 | 1.000 |
The bacterial taxa associated with the nondysbiotic and dysbiotic groups were compared using Metastat at the class level. Mean is the mean percent abundance of the listed taxa.
Fig. 10.
Bar graphs of the differences in major taxa at the class level in dysbiotic vs. nondysbiotic cases by all analysis methods. Eleven cases were found to be dysbiotic by all ordination methods employed in the study. Dysbiotic cases had lower percent mean abundances of Bacteroidetes (P = 0.016; Metastats) and Bacilli and Clostridia (P = 0.016 both; Metastats) and higher percent mean abundances of Gammaproteobacteria (P = 0.016; Metastats).
Fig. 11.
Rank order by abundance of the Bacteroidetes phylum. In the stacked histogram, the y axis shows the percent abundance of the 4 most abundant phyla for each study subject and the x axis labels show the group for the study subject. SA denotes a subject who was a sober alcoholic without liver disease; SA + ALD denotes a subject who was a sober alcoholic with liver disease; AA denotes a subject who was an active alcoholic without liver disease; AA + ALD denotes a subject who was an active alcoholic with liver disease. The abundance of the Bacteroidetes phylum in each subject was rank ordered and graphed in order of rising percent abundance. Bacteroidetes is denoted by the yellow portion of the bars for each subject. In this stacked histogram, the other most abundant taxa in each subject are color coded as follow: Actinobacteria phylum (green); Firmicutes phylum (red); Proteobacteria phylum (blue); Archea (pink); and all other sequences (brown). A rise in the Bacteroidetes phylum abundance is seen at about the 30% level. The 13 samples that had the lowest abundance in the Bacteroidetes phylum have been marked at the left lower corner of the graph.
Network analysis.
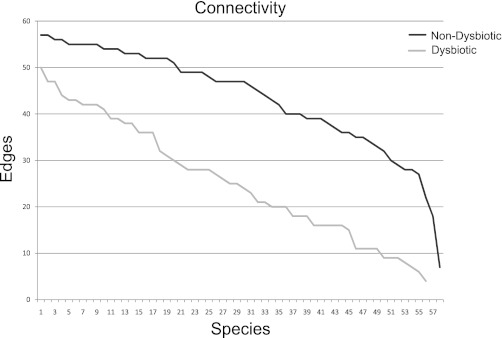
Network analysis analyzes the asymmetric relationships between discrete entities in complex models. This form of analysis has recently been used to investigate the ecological relationships between bacterial components in the vaginal microbiome (10). We have modeled previously undirected unweighted networks for each of the five patient classes to represent the potential correlations between the different phylotypes within patient groups (28). In this network model, the identified bacterial phylotypes are represented by a set of vertices V or nodes. An edge Ei,j exists between two given vertices Vi and Vj if both phylotypes are found together in the sample above the mean for that phylotype in all samples of a class. These network models are visualized in the Cytoscape (5) software package. The number of edges, i.e., the number of connections for each node, is considered the degree of a node. The degree of the node is then rank ordered and plotted as either a connectivity plot (Fig. 12) or a cumulative distribution function (CDF). In Fig. 15, we observed different connectivity between the dysbiotic and the nondysbiotic groups, both of which were defined in Fig. 5. The dysbiotic group (gray line) had lower connectivity compared with the nondysbiotic (black line).
Fig. 12.
Connectivity plot of dysbiotic and nondysbiotic groups from network analysis. Each taxa is represented as a node in complex graph, and an edge is made between 2 nodes if they are present in the same class and above a defined threshold. We then compared network topologies. We present the connectivity plot by node (taxa) for the 2 defined categories.
Fig. 15.
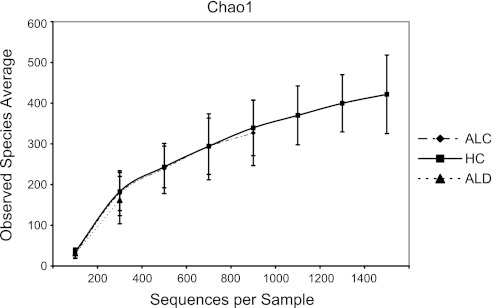
Rarefaction curve using chao1 index by study group. Curves suggest no differences in α-diversity.
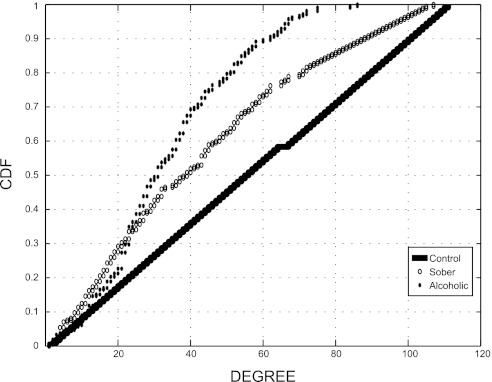
There was also a different connectivity between the healthy, sober alcoholic, and active alcoholic classes (Fig. 13). Cumulative distribution function plots of the subclasses indicate that HC (black dot) have the highest connectivity, whereas the actively drinking alcoholics (stars) have the lowest (Fig. 14). The sober alcoholics (open circle) have intermediate connectivity. Interestingly, the presence of ALD is not correlated with connectivity in this dataset as described in detail previously (28). Therefore, the effects of alcohol alone (in shaping the types of organisms that are associated with the colonic mucosa) appear to be more predominant than the effects seen with liver disease.
Fig. 13.
Cumulative distribution function (CDF) plot of subject classes from network analysis. Each taxa is represented as a node in complex graph, and a connection is made between 2 nodes if they are present in the same class and above a defined threshold. We then compared network topologies. We present the CDF of the degree distributions per node (taxa) for the 3 defined categories.
Fig. 14.
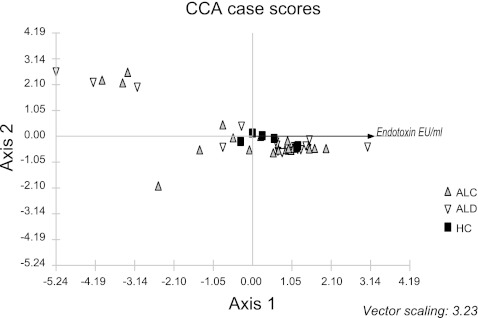
Canonical correspondence analysis (CCA) using endotoxin as the environmental variable and bacterial taxa at the class level. HC are depicted as black squares. ALC are depicted as gray upward triangles. ALD are depicted as open downward triangles.
Correlation of clinical features with dysbiosis.
Because there was a significant difference between the composition of the microbiome in our dysbiotic cases, we then investigated whether this difference could be correlated with clinical features. Specifically, we looked for clinical differences that could possibly explain the dysbiotic subset of cases; when the dysbiotic cases were compared with the nondysbiotic cases, there was no difference in age, sex, ethnicity, BMI, or recruitment site. The dysbiotic cases had a higher frequency of diabetes (45% vs. 3% in the dysbiotic vs. nondysbiotics, respectively; P = 0.001). There was also a higher mean hemoglobin A1c value in the dysbiotics compatible with mild diabetes [HgbA1c = 6.0 (range = 5.3–6.7) in dysbiotics vs. HgbA1c = 5.5 (range = 4.7–6.0) in nondysbiotics (P = 0.009)]. This result also corresponds to the observation that there is a higher incidence of mild diabetes in subjects who are heavy drinkers in other studies. The bowel movement frequency in the dysbiotic and nondysbiotics was similar (P > 0.05). The symptom scales for diarrhea, gas, and bloating were not significantly different in the dysbiotic and nondysbiotic cases (P > 0.05), suggesting that it is unlikely that the cause of bacterial composition changes in colonic biopsies of these subjects could be exocrine pancreatic insufficiency or small intestinal bacterial overgrowth. However, reflux symptoms were more common among the dysbiotic subjects (36% vs. 8% in the dysbiotic vs. nondysbiotics, respectively; P = 0.034). There was a higher frequency of diuretic use among the dysbiotics versus the nondysbiotics (50% vs. 17% in the dysbiotic vs. nondysbiotics, respectively; P = 0.043; 50%). Dysbiotic cases also had a lower mean serum chloride level (102 mmol/L vs. 104 mmol/L in the dysbiotic vs. nondysbiotics respectively; P = 0.048) and a higher red cell distribution width (15% vs 13.8% in the dysbiotic vs. nondysbiotics respectively; P = 0.015). Otherwise, there were no differences in comorbitidies, medication use, gastrointestinal symptoms, smoking history, family history including the family history of alcoholism, use of illicit drugs, smoking, employment, education level, type of drinking behavior (binge drinking vs. weekend drinking vs. daily drinking), type of EtOH consumed (beer vs. wine vs. hard liquor), or parameters typically measured in a complete blood count and metabolic panel such as hemoglobin, platelet count, renal function tests, or liver AST, ALT, total bilirubin, and AP levels. In a limited group of subjects, dietary data were available (n = 19 for total group; n = 6 in HC; n = 6 for ALC; n = 7 for ALD groups). Adjusted percent energy from fiber and adjusted percent energy from fat in the diet and adjusted percent energy from fruits and vegetables were not different between the dysbiotic and nondysbiotic cases (all P > 0.05).
Correlation of serum endotoxin with dysbiosis.
CCA is a multivariate direct gradient analysis method used in ecology. In CCA, the bacterial data are directly related to one or more environmental variables. The CCA is similar to the PCO analysis in that it first clusters the data based on the taxa composition but performs a constrained ordination using environmental factors to determine how the microbiome data are distributed along the environmental gradients. In our case, we wanted to visualize whether the cases distributed along low to high endotoxin values (the environmental gradient). CCA was performed on a subset of the MTPS samples (41 subjects) that had endotoxin level measurements on the day of mucosal biopsy. The endotoxin gradient is given by a linear arrow on the x axis. Higher endotoxin values are seen in cases to the left of the graph and lower values are seen in cases to the right of the graph. Specifically, one can see that a portion of alcoholics shown in gray and open triangles cluster to the left of the controls (shown in black squares). The microbiome composition in the samples distributed along an endotoxin gradient from low endotoxin (in HC) to high endotoxin (in alcoholic groups) but did not correlate with state of alcoholism (sober or active alcoholic states).
α-Diversity.
α-Diversity as assessed by the Chao1 index was not significantly different within the study groups (Fig. 15) in this dataset. The rarefaction curves suggest that an increased amount of reads may further identify additional OTUs of interest.
DISCUSSION
Alcohol consumption could be a major factor influencing the gut microbiome composition and function, and, in turn, the gut microbiome can have a profound impact on alcohol metabolism as well as the metabolic and biological effects of alcohol in the body. However, the data on the effect of alcohol on the gut microbiome in humans are very limited. To the best of our knowledge, this study represents a first attempt at showing changes in the gut microbiome in human alcoholics using nonculture methodologies. Using a variety of state of the art analysis methods, we show that chronic alcohol consumption is associated with altered dysbiotic microbiota composition in a subset of alcoholics. We report that the alcoholics with dysbiosis had lower median abundances of Bacteroidetes and higher ones of Proteobacteria. When the study subjects are examined according to study group, the alcoholic groups had a reduction in abundance of Bacteroidaceae.
In this dataset, there was no correlation between the duration of sobriety and the presence of dysbiosis, suggesting that the effects of chronic alcohol consumption are not temporary but rather long-lasting; a subset of both actively drinking and sober alcoholics had dysbiotic mucosal-associated microbiota. There was a higher frequency of mild diabetes in our dysbiotic subjects. This could be due to the well-described higher frequency of mild diabetes in subjects with heavy alcohol use and may simply be reflective of the subject population (35). Alternatively, it is also possible that mild diabetes could alter the colonic microbiota composition directly. There were no clinical symptoms of pancreatic exocrine deficiency or small intestinal bacterial overgrowth in these subjects to suggest an indirect effect of diabetes on bacterial composition. We suggest that future cross-sectional studies in alcoholics should match for the presence of mild diabetes between cases and controls or make adjustments to the study design as appropriate. Between the dysbiotic and nondysbiotic subjects, there was higher frequency of diuretic use, suggesting more cirrhotic cases were among the dysbiotics, although none of our patients had decompensated cirrhosis with ascites. Reflux symptoms were more common among dysbiotics; this suggests larger amounts of alcohol consumption immediately before sample collection among the dysbiotics leading to upper gastrointestinal tract symptoms, even though cumulative lifetime alcohol intake and the type of alcohol consumed were not different. Red cell distribution width was also slightly higher in the dysbiotics, which perhaps may suggest acute alcohol intake among the dysbiotics. There were no significant differences in other clinical metadata such as BMI (which has been shown to correlate with microbiota composition in other studies) or dietary fat and fiber intake, suggesting the microbiota changes observed in the dysbiotic group are not simply due to the effects of a confounder. However, dietary assessments were performed in a very limited subset of our cases and should be performed in all subjects going forward.
Our inability to detect clearer differences between alcoholics with and without liver disease might be due to several reasons. First, the differences seen in mucosa-associated bacterial composition in our dataset appear to be most evident when healthy subjects are compared with those with alcoholism. This suggests that chronic alcohol consumption, rather than liver disease, is the most important event that appears to alter microbiota composition. Second, the number of subjects in the current study may have been sufficient to identify the gross microbiome disruptions that are related to alcoholism itself compared with the healthy state, but the microbiome changes in subjects with liver disease may be more subtle and require a larger sample size, more in depth reads, and/or alternative analytical methods. Third, there may have been a clear correlation between dysbiotic microbiota and the specific phase of liver disease (steatohepatitis, liver fibrosis, cirrhosis), which would have been missed by our current analysis, because of the lack of liver biopsies to identify different phases of liver disease and relatively small number of cases expected for each liver disease phase in this study. Finally, we acknowledge that our method of classifying ALD is based on clinical/biochemical and radiological criteria and not based on the histology. Therefore, despite all the measures that we have taken to ensure accurate classification of subjects using validated instruments and definitions, it is certainly possible that some subjects that are denoted as merely having alcoholism could have cryptic presence of histological fibrosis without any clinical or biochemical abnormalities. However, this confounding factor cannot be eliminated fully, because routine liver biopsy in alcoholics is not the standard of care and in most alcoholic cases liver biopsy is not clinically indicated and thus was not ethical to perform.
Other limitations of our study included the use mucosal biopsy samples; in this first study, we hypothesized that mucosal bacterial communities would be the most relevant to study due to their spatial proximity to the epithelial cells in the gut mucosa. However, future studies could also consider the use of fecal specimens, where a significant portion of alcohol metabolism may also be taking place. Furthermore, it is important to note that none of our subjects were actively drinking the day of sample procurement, because we needed to obtain valid informed consents. We did not measure alcohol levels before sample acquisition, and alcohol intake was based on self-report of drinking. However, there was no incentive for the subjects to intentionally alter their reporting of alcohol intake since we were recruiting both healthy subjects and alcoholics.
A recent study of the fecal microbiome of subjects with cirrhosis demonstrated similar findings to our study, showing a reduction in the Bacteroidetes and an increase in Proteobacteria (especially Gammaproteobacteria class) compared with healthy controls (7). Additionally in this study, Fusobacteria were also enriched in the cirrhotic group. The etiology of cirrhosis was mostly hepatitis B related, although a limited number of cirrhotics with alcohol-related cirrhosis were also included. In this study, alcoholic cirrhotics had more Prevotellaceae at the family level (7). However, alcohol consumption of all the subjects was not reported. Therefore, it is unclear whether the effects observed are due to cirrhosis or alcoholism. Furthermore, a subset of cirrhotic patients did overlap with controls similarly, suggesting not all cirrhotics are dysbiotic. These findings in conjunction with ours suggest that there are both phyla-level and family-level differences in subjects with alcoholism.
Dysbiosis of the gut microbiome that results in more proinflammatory/pathogenic bacteria could be clinically relevant in alcoholics in general and in patients with alcoholic liver disease because: 1) gut-derived bacteremia and sepsis are common in alcoholics and in particular among those with ALD, 2) gut leakiness and consequently increased translocation of the microbiota and bacterial products from the gut lumen to the circulation has been well described in alcoholics (31) and in an animal model of alcoholic steatohepatitis (25), and 3) manipulation of the gut microbiome in an effort to increase the intestinal content of lactic acid-type bacteria at the expense of other potentially more pathogenic species may ameliorate liver dysfunction in cirrhotics (9, 24). Because intestinal microbiota can affect intestinal epithelial cell function and intestinal barrier integrity (17), it is certainly plausible that mucosa-associated dysbiotic microbiota can contribute to gut leakiness in alcoholics and in particular in sober alcoholics where there are no longer direct toxic effects of alcohol on epithelial cells. Therefore, it is not surprising that many investigators have proposed that the gut microbiome, in addition to its role in the pathogenesis of overt infective episodes and sepsis, can also contribute to the proinflammatory state of cirrhosis even in the absence of infection (32).
Changes in microbial function, rather than abundance, may also lead to increased levels of gut-derived proinflammatory factors such as endotoxin. For example, there may be correlated sets of bacterial groups that differ taxonomically but are functionally equivalent, and such a set may differ from individual to individual. One can infer that the network analysis essentially reflects the biological relevance of such patterns in bacterial groups (or patterns of metabolic capacity) that coexist together in each particular ecological environment (i.e., disease class). Network analysis discriminates patterns of co-occurring bacterial groups, not just simple microbiome composition (diversity and relative abundance). In our study, the network analysis of the disease subclasses indicates that healthy subjects have the highest connectivity, suggesting that in the healthy state, the microbiome probably has the highest metabolic capacity to adapt to changing environmental conditions. In contrast, the active alcoholics had the lower connectivity, suggesting that the metabolic robustness of the microbiome in the alcoholic state has been reduced and focused on coping with the environmental perturbation of alcohol. Hence, our network analysis could be considered a surrogate for studying global metabolic pathways based on microbiome composition and indicates that alcoholism can lead to long-term changes in the connectivity of the mucosa-associated bacteria and that presence or absence of alcohol in the colonic environment may be an important factor affecting the stability and metabolic capacity of the colonic microbiome. Nevertheless, it should be noted that our study did not directly examine the functionality of the bacterial components, and there probably are functional changes not reflected in the bacterial taxa composition. In fact, our CCA shows a correlation between endotoxemia and gut microbiome composition and suggests that the dysbiotic microbiome could contribute to endotoxemia in alcoholics. Further studies using direct measurement of microbiota function such as metagenomic, transcriptomic, and metabolomic assays (i.e., the metabiome) are needed to determine whether changes in bacterial function rather than composition are better in differentiating alcoholics from healthy subjects and alcoholics with and without liver disease, including those with apparently normal microbiome composition. Finally, from an ecological point of view, this study examines the taxa, which make up the bulk of the microbiome with the assumption that the bulk should contribute to the most of the metabolic capacity, whereas the effects of those minor taxa may not contribute much to the overall metabolic activity of the microbiome. However, minor taxa may in fact have a significant impact on the immune system through classic amplification cascades. Thus it is not surprising that not all alcoholics have an altered microbiome composition.
Although associations found in our dataset may be important for alcoholism and its complications such as ALD, and are expected to open up new avenues for research, they are not necessarily causal. In fact, cross-sectional studies cannot establish causality but are essential to design more exhaustive longitudinal or interventional human studies to demonstrate such causality. Our study now provides a scientific rationale for investing in such studies. Furthermore, our study can open up the opportunity for animal studies that can directly evaluate causal relationships between alcohol-induced changes in microbiota and tissue injury. Indeed, we recently showed that alcohol-fed rats that developed gut leakiness, endotoxemia, and steatohepatitis after 8–10 wk of daily alcohol consumption also had dysbiotic colonic microbiomes (25). This animal model now provides an opportunity to determine any potential causal role for dysbiosis in alcohol-induced endotoxemia, gut leakiness, and steatohepatitis. Furthermore, use of germ-free animals with inoculation with single or groups of bacteria can further be utilized to determine the role of bacteria in alcohol-induced organ dysfunction.
In conclusion, chronic alcohol use is associated with changes in the mucosa-associated colonic bacterial composition in a subset of alcoholics and thus may contribute to the pathogenesis of complications of alcoholism. Future studies are required to confirm these findings and to determine the biological, functional, and clinical significance of shifts in the microbiome composition and connectivity in alcoholism.
GRANTS
The study was supported by National Institutes of Health Grants RO-1 AA-013745 (to A. Keshavarzian); R 21 DK-071838 (to E. Mutlu); R21 AT-001628 (to E. Mutlu); SBIR 1R43DK-074275 (to P. M. Gillevet), and NIAAA 1RC2AA-019405–01 (to A. Keshavarzian and P. M. Gillevet) and a gift from Mrs. and Mr. Larry Field.
DISCLOSURES
No conflicts of interest, financial or otherwise, are declared by the author(s).
AUTHOR CONTRIBUTIONS
Author contributions: E.A.M., P.M.G., M.S., P.A.E., C.K.L., and A.K. performed experiments; E.A.M., P.M.G., H.R., M.S., A.N., M.K., and C.K.L. analyzed data; E.A.M., P.M.G., and A.K. interpreted results of experiments; E.A.M., P.M.G., H.R., and A.N. prepared figures; E.A.M., P.M.G., and A.K. drafted manuscript; E.A.M., P.M.G., H.R., M.S., and A.K. edited and revised manuscript; E.A.M., P.M.G., H.R., M.S., and A.K. approved final version of manuscript; A.K. conception and design of research.
ACKNOWLEDGMENTS
We thank Megan Bakaitis, Nancy Licciardi, and Erica Morset and Drs. Anezi Bakken and Ashkan Farhadi for assistance with subject recruitment. We also thank the Unifrac and FastUnifrac team for assistance in working with the online system.
REFERENCES
- 1. Adachi Y, Moore LE, Bradford BU, Gao W, Thurman RG. Antibiotics prevent liver injury in rats following long-term exposure to ethanol. Gastroenterology 108: 218–224, 1995 [DOI] [PubMed] [Google Scholar]
- 2. Ball SA, Tennen H, Poling JC, Kranzler HR, Rounsaville BJ. Personality, temperament, and character dimensions and the DSM-IV personality disorders in substance abusers. J Abnorm Psychol 106: 545–553, 1997 [DOI] [PubMed] [Google Scholar]
- 3. Bigatello LM, Broitman SA, Fattori L, Di Paoli M, Pontello M, Bevilacqua G, Nespoli A. Endotoxemia, encephalopathy, and mortality in cirrhotic patients. Am J Gastroenterol 82: 11–15, 1987 [PubMed] [Google Scholar]
- 4. Binladen J, Gilbert MT, Bollback JP, Panitz F, Bendixen C, Nielsen R, Willerslev E. The use of coded PCR primers enables high-throughput sequencing of multiple homolog amplification products by 454 parallel sequencing. PloS One 2: e197, 2007 [DOI] [PMC free article] [PubMed] [Google Scholar]
- 5. Caporaso JG, Bittinger K, Bushman FD, DeSantis TZ, Andersen GL, Knight R. PyNAST: a flexible tool for aligning sequences to a template alignment. Bioinformatics (Oxford, England) 26: 266–267, 2010 [DOI] [PMC free article] [PubMed] [Google Scholar]
- 6. Caporaso JG, Kuczynski J, Stombaugh J, Bittinger K, Bushman FD, Costello EK, Fierer N, Pena AG, Goodrich JK, Gordon JI, Huttley GA, Kelley ST, Knights D, Koenig JE, Ley RE, Lozupone CA, McDonald D, Muegge BD, Pirrung M, Reeder J, Sevinsky JR, Turnbaugh PJ, Walters WA, Widmann J, Yatsunenko T, Zaneveld J, Knight R. QIIME allows analysis of high-throughput community sequencing data. Nature Methods 7: 335–336, 2010 [DOI] [PMC free article] [PubMed] [Google Scholar]
- 7. Chen Y, Yang F, Lu H, Wang B, Chen Y, Lei D, Wang Y, Zhu B, Li L. Characterization of fecal microbial communities in patients with liver cirrhosis. Hepatology 54: 562–572, 2011 [DOI] [PubMed] [Google Scholar]
- 8. Eckburg PB, Bik EM, Bernstein CN, Purdom E, Dethlefsen L, Sargent M, Gill SR, Nelson KE, Relman DA. Diversity of the human intestinal microbial flora. Science 308: 1635–1638, 2005 [DOI] [PMC free article] [PubMed] [Google Scholar]
- 9. Forsyth CB, Farhadi A, Jakate SM, Tang Y, Shaikh M, Keshavarzian A. Lactobacillus GG treatment ameliorates alcohol-induced intestinal oxidative stress, gut leakiness, and liver injury in a rat model of alcoholic steatohepatitis. Alcohol 43: 163–172, 2009 [DOI] [PMC free article] [PubMed] [Google Scholar]
- 10. Foster JA, Krone SM, Forney LJ. Application of ecological network theory to the human microbiome. Interdiscip Perspect Infect Dis 2008: 839501, 2008 [DOI] [PMC free article] [PubMed] [Google Scholar]
- 11. Gillevet P, Sikaroodi M, Keshavarzian A, Mutlu EA. Quantitative assessment of the human gut microbiome using multitag pyrosequencing. Chem Biodivers 7: 1065–1075, 2010 [DOI] [PMC free article] [PubMed] [Google Scholar]
- 12. Gillevet PM. Compositions and Methods for Diagnosing Colon Disorders, PCT/US05/39887. PCT/USPTO: George Mason University, 2005 [Google Scholar]
- 13. Gillevet PM. Multitag Sequencing and Ecogenomic Analysis, EPO 07871488.8, PCT/US2007/084840. WPO: BioSpherex, 2006 [Google Scholar]
- 14. Grant BF, Dufour MC, Harford TC. Epidemiology of alcoholic liver disease. Semin Liver Dis 8: 12–25, 1988 [DOI] [PubMed] [Google Scholar]
- 15. Hamady M, Knight R. Microbial community profiling for human microbiome projects: tools, techniques, and challenges. Genome research 19: 1141–1152, 2009 [DOI] [PMC free article] [PubMed] [Google Scholar]
- 16. Hamady M, Lozupone C, Knight R. Fast UniFrac: facilitating high-throughput phylogenetic analyses of microbial communities including analysis of pyrosequencing and PhyloChip data. ISME J 4: 17–27, 2010 [DOI] [PMC free article] [PubMed] [Google Scholar]
- 17. Hooper LV, Wong MH, Thelin A, Hansson L, Falk PG, Gordon JI. Molecular analysis of commensal host-microbial relationships in the intestine. Science 291: 881–884, 2001 [DOI] [PubMed] [Google Scholar]
- 18. Hunt NC, Goldin RD. Nitric oxide production by monocytes in alcoholic liver disease. J Hepatol 14: 146–150, 1992 [DOI] [PubMed] [Google Scholar]
- 19. Keshavarzian A, Choudhary S, Holmes EW, Yong S, Banan A, Jakate S, Fields JZ. Preventing gut leakiness by oats supplementation ameliorates alcohol-induced liver damage in rats. J Pharmacol Exp Ther 299: 442–448, 2001 [PubMed] [Google Scholar]
- 20. Komanduri S, Gillevet PM, Sikaroodi M, Mutlu E, Keshavarzian A. Dysbiosis in pouchitis: evidence of unique microfloral patterns in pouch inflammation. Clin Gastroenterol Hepatol 5: 352–360, 2007 [DOI] [PubMed] [Google Scholar]
- 21. Lane D. 16s/23s rRNA sequencing. In: Nucleic Acid Techniques in Bacterial Systematics, edited by Goodfellow M. West Sussex, England: John Wiley & Sons, 1991, p. 115–175 [Google Scholar]
- 22. Li W, Godzik A. Cd-hit: a fast program for clustering and comparing large sets of protein or nucleotide sequences. Bioinformatics (Oxford, England) 22: 1658–1659, 2006 [DOI] [PubMed] [Google Scholar]
- 23. Li W, Jaroszewski L, Godzik A. Clustering of highly homologous sequences to reduce the size of large protein databases. Bioinformatics (Oxford, England) 17: 282–283, 2001 [DOI] [PubMed] [Google Scholar]
- 24. Liu Q, Duan ZP, Ha DK, Bengmark S, Kurtovic J, Riordan SM. Synbiotic modulation of gut flora: effect on minimal hepatic encephalopathy in patients with cirrhosis. Hepatology 39: 1441–1449, 2004 [DOI] [PubMed] [Google Scholar]
- 25. Mutlu E, Keshavarzian A, Engen P, Forsyth CB, Sikaroodi M, Gillevet P. Intestinal dysbiosis: a possible mechanism of alcohol-induced endotoxemia and alcoholic steatohepatitis in rats. Alcohol Clin Exp Res 33: 1836–1846, 2009 [DOI] [PMC free article] [PubMed] [Google Scholar]
- 26. Nanji AA, Khettry U, Sadrzadeh SM. Lactobacillus feeding reduces endotoxemia and severity of experimental alcoholic liver (disease). Proc Soc Exp Biol Med 205: 243–247, 1994 [DOI] [PubMed] [Google Scholar]
- 27. Nanji AA, Khettry U, Sadrzadeh SM, Yamanaka T. Severity of liver injury in experimental alcoholic liver disease. Correlation with plasma endotoxin, prostaglandin E2, leukotriene B4, and thromboxane B2. Am J Pathol 142: 367–373, 1993 [PMC free article] [PubMed] [Google Scholar]
- 28. Naqvi A, Rangwala H, Keshavarzian A, Gillevet P. Network-based modeling of the human gut microbiome. Chem Biodivers 7: 1040–1050, 2010 [DOI] [PMC free article] [PubMed] [Google Scholar]
- 29. O'Connor PG, Schottenfeld RS. Patients with alcohol problems. N Engl J Med 338: 592–602, 1998 [DOI] [PubMed] [Google Scholar]
- 30. Probert HM, Gibson GR. Bacterial biofilms in the human gastrointestinal tract. Current issues in intestinal microbiology 3: 23–27, 2002 [PubMed] [Google Scholar]
- 31. Rimola A. Infections in liver disease. Oxford, England: Oxford University Press, 1991 [Google Scholar]
- 32. Riordan SM, Skinner N, Nagree A, McCallum H, McIver CJ, Kurtovic J, Hamilton JA, Bengmark S, Williams R, Visvanathan K. Peripheral blood mononuclear cell expression of toll-like receptors and relation to cytokine levels in cirrhosis. Hepatology 37: 1154–1164, 2003 [DOI] [PubMed] [Google Scholar]
- 33. Sharara AI, Rockey DC. Gastroesophageal variceal hemorrhage. The New England journal of medicine 345: 669–681, 2001 [DOI] [PubMed] [Google Scholar]
- 34. Turnbaugh PJ, Hamady M, Yatsunenko T, Cantarel BL, Duncan A, Ley RE, Sogin ML, Jones WJ, Roe BA, Affourtit JP, Egholm M, Henrissat B, Heath AC, Knight R, Gordon JI. A core gut microbiome in obese and lean twins. Nature 457: 480–484, 2009 [DOI] [PMC free article] [PubMed] [Google Scholar]
- 35. van de Wiel A. Diabetes mellitus and alcohol. Diabetes/metabolism research and reviews 20: 263–267, 2004 [DOI] [PubMed] [Google Scholar]
- 36. Wang Q, Garrity GM, Tiedje JM, Cole JR. Naive Bayesian classifier for rapid assignment of rRNA sequences into the new bacterial taxonomy. Applied and environmental microbiology 73: 5261–5267, 2007 [DOI] [PMC free article] [PubMed] [Google Scholar]
- 37. White JR, Nagarajan N, Pop M. Statistical methods for detecting differentially abundant features in clinical metagenomic samples. PLoS computational biology 5: e1000352, 2009 [DOI] [PMC free article] [PubMed] [Google Scholar]
- 38. Whittaker RH. Evolution and measurement of species diversity. Taxon 21: 213–251, 1972 [Google Scholar]


