

Abstract
Obesity is a serious health problem with an increased risk of several common diseases including diabetes, cardiovascular disease, and cancer. Metabolomics is an emerging analytical technique for systemic determination of metabolite profiles, which is useful for understanding the biochemical changes in obesity or related diseases both in individual organs and at the organism level. Increasingly, this technology has been applied to the study of obesity, complementing transcriptomics and/or proteomics analyses. Indeed, the alterations of metabolites in biofluids/tissues are direct indicators of variations in physiology or pathology. In this paper, we will examine the obesity-related alterations in significant metabolites that have been identified by metabolomics as well as their metabolic pathway associations. Issues concerning the screening of biologically significant metabolites related to obesity will also be discussed.
1. Introduction
Obesity is characterized by abnormal or excessive fat accumulation that is the result of a chronic imbalance between energy intake and energy expenditure [1, 2]. It poses a substantial health risk, as obesity is linked to several common diseases, such as type 2 diabetes, cardiovascular disease, stroke, arthritis, and several types of cancer [3]. Obesity can be highly heritable, and some specific genes related to obesity have been identified [4]. However, over the past decade, the prevalence of obesity in the world has dramatically increased across all age groups, especially in developed countries [5], so that genetic factors alone cannot explain the obesity epidemic. It is widely agreed that obesity is a complex multifactorial disease involving genetic, environmental, and lifestyle factors [6] and it is necessary to investigate the mode of action of each contributing factor in order to reduce the associated health risks.
Metabolomics is a newly emerging bioanalytical technique similar in scope to genomics and proteomics that uses analytical techniques such as nuclear magnetic resonance (NMR) spectroscopy or mass spectrometry (MS) to characterize and quantify all small molecules in biological samples to achieve comprehensive global monitoring of metabolites and their fluctuations in response to various stimuli [7, 8]. Therefore, metabolomic data can provide the information on what is actually happening in a biological system, serving as the crucial link between phenotype and genetics. To date, metabolomics has demonstrated enormous potential in furthering the understanding of disease processes [9], toxicological mechanisms [7, 10], biomarker discovery [11], and gut microbiome-host variations [12, 13]. Obesity is a disorder of the whole body and obviously involves metabolic changes, but the actual alterations in metabolism during obesity and any dysfunction associated with obesity at the level of individual organs or cellular organelles are not yet clearly understood [2]. As metabolomics can readily detect subtle changes in the metabolic network, it is uniquely poised to increase our understanding of obesity and obesity-related diseases.
Animal models have provided a fundamental contribution to the investigation of the onset and progression of complex multifactorial diseases such as obesity [14]. The greatest advantage of animal models is that they allow strict control of factors such as diet, environmental conditions, or genetic background. Thus, animal models have been widely used in metabolomics for exploring the metabolic changes and potential biochemical mechanisms of obesity development.
The general process of a metabolomics study includes appropriate design and sampling of experimental study cohorts, selection of analytical technique (NMR spectroscopy and/or MS), data preprocessing and statistical analysis, identification of candidate biomarkers, and elucidation of their biological relationship. How to obtain metabolic profiles from biological fluids and how to analyse metabolomic data will not be discussed in detail in this paper as these topics have been thoroughly reviewed elsewhere [7, 15–17]. We will focus here on individual significant metabolites and metabolic pathways related to obesity which have been identified by metabolomics.
2. Investigation of Obesity-Associated Metabolites by Metabolomics
Recently, many obesity-related metabolites have been identified by metabolomics and demonstrated to be disturbed significantly in both animal models and humans. Table 1 and Figure 1 show a summary of these metabolites and their relationships in metabolic pathways, respectively. We will discuss several of these metabolites in more detail below.
Table 1.
Metabolite changes in obesity.
| Pathway | Metabolitea | Model/sampleb | Analytical platform | Reference |
|---|---|---|---|---|
| Glucose metabolism and TCA cycle | Lactate (+) | HFD rat/urine | 1HNMR | [20] |
| HFD mouse/serum | 1HNMR | [19] | ||
| Zucker rat/liver, blood | 1HNMR | [18] | ||
| Zucker rat/urine, blood | 1HNMR | [21] | ||
| LDLr mouse/liver | 1HNMR | [22] | ||
| Lactate (−) | HFD mouse/serum | 1HNMR | [56] | |
| Zucker rat/urine | 1HNMR | [23] | ||
| Acetate (+) | Zucker rat/ blood | 1HNMR | [18] | |
| Zucker rat/urine | 1HNMR | [21] | ||
| Acetate (−) | HFD mouse/serum | 1HNMR | [28] | |
| HFD mouse/urine | 1HNMR | [55] | ||
| HFD mouse/serum | 1HNMR | [56] | ||
| Citrate (+) | HFD mouse/serum | 1HNMR | [28] | |
| HFD rat/urine | 1HNMR | [20] | ||
| HFD rat/serum | GC-MS | [32] | ||
| Citrate (−) | HFD rat/urine | GC-MS | [32] | |
| Zucker rat/urine | 1HNMR | [23] | ||
| M391 mouse/urine | 1HNMR | [34] | ||
| Pyruvate (+) | HFD rat/urine | 1HNMR | [20] | |
| HFD mouse/serum | 1HNMR | [19] | ||
| Succinate (+) | HFD mouse/serum | 1HNMR | [19] | |
| HFD rat/liver | GC-MS | [32] | ||
| 2-Oxoglutarate (−) | M391 mouse/urine | 1HNMR | [34] | |
|
| ||||
| Lipid metabolism | Fatty acid (+) | HFD rat/liver, serum | GC-MS | [32] |
| Zucker rat/liver | 1HNMR | [18] | ||
| HFD mouse/liver | LC (GC)-MS | [42] | ||
| Human/blood | UPLC-MS | [46] | ||
| Taurine (+) | HFD rat/urine | 1HNMR | [20] | |
| HFD mouse/liver | 1HNMR, LC-MS | [54] | ||
| HFD mouse/liver | 1HNMR | [55] | ||
| HFD mouse/serum | 1HNMR | [19] | ||
| HFD mouse/liver | 1HNMR | [34] | ||
| Zucker rat/urine | 1HNMR | [23] | ||
| Taurine (−) | HFD mouse/serum | 1HNMR | [56] | |
| Zucker rat/urine | UPLC-MS | [53] | ||
| M391 mouse/liver, urine | 1HNMR | [34] | ||
| Zucker rat/urine | 1HNMR | [21] | ||
| Carnitine (+) | HFD mouse/serum | LC (GC)-MS | [42] | |
| Carnitine (−) | HFD mouse/liver | LC (GC)-MS | [42] | |
| Human/blood | UPLC-MS | [46] | ||
| PCs (+); lysoPCs (−) | HFD mouse/serum, liver | LC (GC)-MS | [42] | |
|
| ||||
| Choline metabolism | Choline (+) | HFD mouse/liver | 1HNMR, LC-MS | [54] |
| Zucker rat/blood | 1HNMR | [21] | ||
| Zucker rat/urine | 1HNMR | [23] | ||
| Betaine (+) | HFD rat/urine | 1HNMR | [20] | |
| Betaine (−) | HFD mouse/liver | LC (GC)-MS | [42] | |
| Zucker rat/liver | 1HNMR | [18] | ||
| Zucker rat/urine | 1HNMR | [21] | ||
| TMAO (−) | HFD mouse/serum | 1HNMR | [28] | |
| HFD mouse/urine | 1HNMR | [55] | ||
| HFD mouse/serum | 1HNMR | [56] | ||
| Zucker rat/urine | 1HNMR | [21] | ||
| TMAO (+) | M391 mouse/urine | 1HNMR | [34] | |
| TMA (+) | M391 mouse/urine | 1HNMR | [34] | |
| TMA (−) | HFD mouse/urine | 1HNMR | [55] | |
| Sarcosine (+) | HFD mouse/liver | NMR, LC-MS | [54] | |
| Hippurate (−) | HFD mouse/serum | 1HNMR | [28] | |
| Human/urine | 1HNMR | [97] | ||
|
| ||||
| Amino acid metabolism | BCAA (+) | Human/blood | UPLC-MS | [46] |
| HFD rat/liver | GC-MS | [32] | ||
| BCAA (−) | HFD mouse/serum | 1HNMR | [28] | |
| HFD mouse/urine | 1HNMR | [55] | ||
| HFD mouse/liver | LC (GC)-MS | [42] | ||
| HFD mouse/serum | 1HNMR | [56] | ||
| HFD rat/urine | GC-MS | [32] | ||
| Methionine (+) | Zucker rat/liver | 1HNMR | [18] | |
| Methionine (−) | HFD mouse/liver | 1HNMR, LC-MS | [54] | |
| HFD mouse/serum | 1HNMR | [56] | ||
| Glycine (−) | HFD mouse/liver | 1HNMR, LC-MS | [54] | |
| Zucker rat/blood | 1HNMR | [21] | ||
| HFD rat/liver,serum | GC-MS | [32] | ||
| Serine (−) | HFD mouse/liver | 1HNMR, LC-MS | [54] | |
| Alanine (+) | HFD mouse/serum | LC (GC)-MS | [41] | |
| HFD rat/liver,serum | GC-MS | [32] | ||
| Tyrosine (+) | Human/blood | UPLC-MS | [45] | |
| HFD mouse/serum | LC (GC)-MS | [41] | ||
| HFD rat/urine | GC-MS | [32] | ||
| Tyrosine (−) | HFD rat/liver | GC-MS | [32] | |
| Lysine (−); Arginine (−) | HFD mouse/serum | 1HNMR | [28] | |
| Phenylalanine (−) | HFD mouse/urine | 1HNMR | [55] | |
| Glutamate (−) | Zucker rat/blood | 1HNMR | [21] | |
|
| ||||
| Creatine metabolism | Creatinine (+) | M391 mouse/urine | 1HNMR | [34] |
| HFD mouse/urine | 1HNMR | [55] | ||
| Creatine (+) | HFD mouse/serum | 1HNMR | [19] | |
| M391 mouse/urine | 1HNMR | [34] | ||
| Zucker rat/urine | 1HNMR | [23] | ||
| Uric acid (+) | HFD mouse/serum | LC (GC)-MS | [42] | |
a(+) and (–) indicate an increase or decrease in relative metabolite concentration, respectively, when comparing obesity with control.
b“Model” denotes the genetic or dietary cause of obesity, “sample” denotes the type of biological sample.
Figure 1.
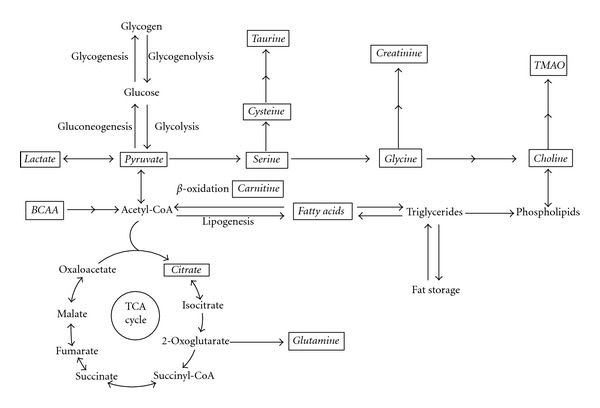
The relationship of obesity-related metabolites in the metabolic network. Metabolites explicitly mentioned in this paper are indicated in boxes and italics. BCAA, branched chain amino acids; TMAO, trimethylamine N-oxide.
2.1. Metabolites Related to Glucose Metabolism and Tricarboxylic Acid (TCA) Cycle
Glucose is a key source of energy for most organisms. It is catabolised via glycolysis to pyruvate, which under aerobic conditions is converted into acetyl coenzyme A (AcCoA), the entry point into the TCA cycle. Under anaerobic conditions, pyruvate is instead converted to lactate by the enzyme lactate dehydrogenase. It was found that the concentration of lactate in urine, blood, or liver tissue is elevated in obese mice induced by high-fat diet (HFD), or in obese Zucker rats lacking the leptin receptor, compared to their lean controls (Table 1) [18–22]. One study found lower lactate levels in the urine of obese Zucker rats, but this decrease was only small compared to other metabolite changes and could have been caused by small cohort sizes [23]. The findings of generally higher lactate levels in obese Zucker rats are consistent with higher blood lactate levels in obese humans measured by conventional methods [24]. It was presumed that the elevation of lactate in obese animals was the result of upregulated anaerobic glycolysis when compared to lean controls [18, 19]. The blood concentration of lactate is largely determined by the balance of the rate of lactate production (which mainly takes place in skeletal muscle, the erythrocytes, brain [25], and adipose tissue [26]) relative to the rate of its removal by other tissues or by urinary excretion. Importantly, subcutaneous fat was demonstrated to be a significant source of lactate; therefore, obese subjects have a greater apparent lactate release due to their larger adipose mass, and a higher plasma lactate than lean individuals [26]. Lactate is also the major precursor for gluconeogenesis in the body, and the rise in plasma lactate in obesity may be an indicator of perturbation of hepatic glucose production and hepatic lipid synthesis. Thus, lactate is an important obesity-related metabolite identified by metabolomics.
Under aerobic conditions, pyruvate enters the TCA cycle via AcCoA to produce energy via formation of citrate, and other TCA cycle metabolites. It was reported that inhibition of citrate metabolism by fluoroacetate, a chemical inhibitor, reduced body fat in mice [27]. Next to glucose catabolism, AcCoA and consequently citrate are in animals also generated by fatty acid oxidation. The concentration of citrate in plasma is regulated by insulin, glucose levels, fatty acid utilization, cholesterol synthesis, liver clearance and renal excretion [28]. Blood citrate was found to be increased in alloxan-induced diabetic rats [29], and lowered upon insulin administration in experimental animal models [30] and children [31]. Similarly, higher serum concentrations of citrate when compared to their controls were detected by NMR [28] or gas chromatography-MS (GC-MS) [32] based metabolomics in HFD-fed obese animals with insulin resistance. Conversely, lower urinary citrate excretion was reported to be associated with a higher level of insulin resistance in humans [33], and depletion of urinary citrate excretion was reported in obese animals with insulin resistance [32], while the opposite was seen in obese animals without insulin resistance [20]. Depletion of urinary citrate excretion was also found in obese animals, with truncations in the intracellular domain of the growth hormone receptor (GHR) [34, 35]. Urinary citrate excretion is influenced by the acid-base status of the body [36], with alkalosis inducing an increase in urinary citrate excretion, and acidosis having the opposite action. Obesity, especially in conjunction with insulin resistance, can increase metabolic acidosis and thus result in a reduction of urinary citrate excretion [37]. Thus, citrate can be used as a marker related to insulin or glucose levels in metabolic studies.
2.2. Metabolites Related to Lipid Metabolism
Lipids are an important source and store of energy for metabolism. Blood lipids, derived from food intake or adipose tissue and liver, are mainly fatty acid derivatives and cholesterol. High concentrations of fatty acids or cholesterol in blood have been used as an indicator of disease risk, as their alteration is related to some cardiovascular diseases, such as coronary heart disease, diabetes [38, 39], and hypertension [40]. In liver and muscle, free fatty acids (FFAs) are catabolised in the mitochondria to produce energy through β-oxidation and the TCA cycle, whereas excess lipids are stored in adipose tissue and elsewhere as triglycerides [41]. Obesity, characterized by fat deposits in tissue, is generally associated with elevated levels of plasma FFAs [42]. In agreement with this, elevation of FFAs in serum and liver of obese animals has been observed by metabolomic analysis (Table 1). Furthermore, the serum FFA composition, especially the proportion of saturated fatty acids (SFAs), has been found to be positively associated with the development of obesity and diabetes [43]. In contrast, lower levels of essential fatty acids such as linoleic acid were found in circulating lipids of obese patients [44].
Compared to conventional targeted analysis of FFAs, metabolomics can provide a more unbiased relationship of FFAs to other small molecules, which may help to understand obesity. For example, based on ultraperformance liquid chromatography quadrupole time-of-flight (UPLC Q-TOF) MS and GC-MS, higher levels of stearic acid, total SFAs and palmitoleic acid and lower linoleic acid levels, as well as the variation of amino acids and carnitine in plasma, were detected in overweight/obese men [45].
Carnitine is a key metabolite related to obesity, due to its involvement in fatty acid metabolism. It is well documented that provision of FFAs can promote fatty acid oxidation [46]. However, fatty acids can only produce energy via β-oxidation after esterification and transport into the mitochondrion with the help of carnitine [47]. Thus, higher plasma FFAs in obesity may require more carnitine for efficient β-oxidation. Consequently, the amount of carnitine in cells is an important factor regulating the process of β-oxidation. Indeed, it has been reported that supplementation of carnitine can diminish the risk of obesity caused by a HFD in C57BL/6J mice [48], and carnitine is popularly used as a weight loss product [49]. Consistent with this picture, depletion of carnitine levels was observed in liver tissue of obese mice [41] or blood samples of obese humans [45]. The decreased carnitine levels in obesity could be insufficient for β-oxidation to compensate the elevation of FFAs, and as a result, contribute to fat accumulation in adipose tissue.
Taurine is an important metabolite in bile acid metabolism and has many important biological roles such as conjugation of cholesterol and bile acids, antioxidation, osmoregulation, and modulation of calcium signaling [50]. In a rat model of type 2 diabetes, a taurine-supplemented diet tended to decrease total fat weight in the abdominal cavity and improved insulin sensitivity [51]. Similarly, Zhang et al. reported that taurine supplementation significantly decreased serum lipids and body weight in obese individuals [52]. Based on 1H-NMR spectroscopy and microarray techniques, significant depletion of hepatic and urinary taurine, as well as lower expression of cysteine sulfinic acid dehydrogenase (Csad) in GHR mutant obese mice, was observed when compared with wild-type mice in our previous work [34]. The findings indicated that lower urinary taurine levels in the mutant mice can reflect lower hepatic taurine biosynthesis in GHR mutant mice. Lower urinary excretion of taurine was also reported in obese Zucker rats [21, 53] (Table 1). These observations indicate that a decreased production of taurine in liver due to inhibition of taurine biosynthetic enzymes is closely related to obesity.
Interestingly, we found that the hepatic taurine level in liver was increased significantly when wild-type mice were fed an HFD [34]. Recently, Rubio-Aliaga et al. [54] confirmed that not only elevation of hepatic taurine, but also depletion of the expression of two key enzymes involved in taurine biosynthesis, cysteine dioxygenase (CDO) and Csad, was observed in HFD-induced obesity mice. Similar results of elevated taurine levels in liver extracts but decreased urinary taurine were also found in another study on HFD-fed obese mice [55].
In vivo, taurine in liver is supplied from blood by dietary ingestion as well as from de novo synthesis. It is likely that the elevation of hepatic taurine and the decreased production of biosynthesized taurine in obesity induced by HFD are associated with depletion of the blood taurine concentrations. This was confirmed in a recent metabolomic study for HFD-induced mice [56] and obese humans in comparison with age- and sex-matched nonobese subjects [57]. Indeed, Tsuboyama-Kasaoka et al. [58] not only found that blood taurine concentrations were decreased in HFD-induced obese mice, but also that dietary taurine supplementation could reverse the obesity induced by HFD. They proposed a role for taurine as a metabolite able to increase fatty acid oxidation and decrease obesity. In the light of this, the increased provision of fatty acids in obesity may require more taurine to promote fatty acid oxidation. Thus, the obesity in the GHR mutant mice is likely to be a consequence of the low taurine levels, whereas the elevation of hepatic taurine seen in HFD-fed wild-type mice is a compensatory mechanism to overcome the increased supply of dietary triglycerides by promoting β-oxidation [34]. These observations indicate that taurine should be a focus of further investigation with respect to the mechanism of the onset and development of obesity.
2.3. Metabolites Related to Choline Metabolism
Choline is an essential dietary nutrient that is important for integrity of cellular structure, methyl (one-carbon) metabolism, and lipid/cholesterol transport and metabolism [59, 60]. In animals, over 95% of the total choline pool in most tissues is used for the synthesis of phosphatidylcholine (PC) via the Kennedy pathway [61]. In HFD-fed obese mice the hepatic and serum PC was increased compared to normal controls [41]. In the mitochondria of liver and kidney, choline can be oxidized to betaine, whose methyl groups are used to synthesize methionine from homocysteine [62]. It was presumed that betaine plays a key role in fatty acid metabolism related to carnitine production [41, 63]. Metabolomic analysis revealed depletion of betaine in the liver of HFD-induced obese mice [41] and Zucker rats [18] which may result in a decreased hepatic carnitine level, and eventually lead to decreased β-oxidation and increased fatty acid storage. Indeed, a lower hepatic carnitine level was detected by LC(GC)-MS in HFD-fed obese mice [41].
In mammals, choline is derived not only from diet, but also from de novo synthesis. During HFD intervention, hepatic one-carbon metabolism and related pathways are altered significantly. For example, higher hepatic choline levels and lower hepatic methionine concentrations were found in an HFD mouse model [54]. It was suggested that the higher hepatic choline levels were used for synthesizing essential amino acids such as methionine and that these alterations would play an important role in the development of insulin resistance and liver steatosis [54].
However, the amount of choline supplied by de novo biosynthesis may be not adequate to meet the demand for choline to maintain health [59]. Indeed, feeding animals a methionine- and choline-deficient (MCD) diet can result in fatty liver, which is similar to human nonalcoholic steatohepatitis (NASH), and MCD diet is a frequently used nutritional model of NASH [64, 65]. The mechanism of development of hepatic steatosis induced by MCD diet in mice presumably involves an increase of fatty acid uptake and decrease of very low-density lipoprotein (VLDL) secretion, which would promote intrahepatic lipid accumulation [66].
The pathway from dietary PC/choline to trimethylamine (TMA) and trimethylamine N-oxide (TMAO) has been known since the 1950s [67]. Recently, Wang et al. [13] crucially demonstrated that intestinal microflora are a key element in this pathway and thus in the generation of TMA from dietary choline in vivo. The importance of gut microbiota for TMA production from its precursor choline was also demonstrated with germ-free mice experiments [68]. Thus, metabolites such as TMA and TMAO are directly indicative of gut microbiota status. By combining 1H NMR spectroscopy and multivariate statistical techniques, Dumas et al. [12] found a significant association between variations in choline metabolism—for example, low plasma PC and high urinary methylamines (dimethylamine, TMA, TMAO)—and genetic predisposition to HFD-induced nonalcoholic fatty liver disease in mice. Based on this, Dumas et al. proposed a diet-induced mechanism of steatosis, triggered by symbiotic microbiota, which mimic choline-deficient diets [12]. Indeed, gut microbiota have been demonstrated to be able to influence the efficiency of harvesting energy from diet and consequently influence susceptibility to obesity [69]. Several metabolomic studies show depletion of serum or urinary TMAO in HFD-induced obese mice or Zucker rats (Table 1), whereas, elevation of TMAO was observed in GHR mutant obese mice [34]. In addition, urinary excretion of microbiota-derived metabolites was found to vary significantly depending on the mouse strain [12], underlining the importance of gut microbiota in nutrient supply.
2.4. Metabolites Related to Amino Acid Metabolism
Amino acids that were shown to display significant obesity-related variations are listed in Table 1. The branched chain amino acids (BCAAs), leucine, isoleucine, and valine, are among the nine essential amino acids for humans. The BCAAs play important roles in protein synthesis [70], improve glucose metabolism and oxidation [71], and regulate leptin secretion from fat and food intake [72]. BCAA supplementation was found to beneficial for patients undergoing chemoembolization to improve postoperative nutritional status [73]. In mouse models, very low blood levels of BCAAs were associated with neuropathology, including the development of epileptic seizures [74]. However, high levels of BCAAs have been reported in obese persons, and fasting concentrations of branched-chain and aromatic amino acids were correlated with obesity and serum insulin levels [75, 76]. Based on metabolic profiling of obese versus lean humans and data obtained from rats on different diets, Newgard et al. [24] demonstrated that BCAAs did contribute to obesity-related comorbidities such as insulin resistance and glucose intolerance. Furthermore, a recent study showed that the blood concentration of five branched-chain and aromatic amino acids (isoleucine, leucine, valine, tyrosine, and phenylalanine) could predict the risk of future diabetes [77]. In agreement with this, plasma levels of valine and leucine were 23% and 14% higher, respectively, in overweight/obese male humans compared to the lean controls [45]. In contrast, some previous studies [78, 79] failed to demonstrate the elevation of blood BCAA levels in obese patients, but this may have been caused by a different dietary regimen in the obese subjects [79, 80]. Similarly, depletion of serum levels of BCAAs was reported in HFD-fed obese mice in other metabolomic studies [28, 56]. An HFD with lower protein content [28] may decrease the supply of BCAAs.
On the other hand, obesity may play a role in the regulation of BCAA catabolism. In animals, BCAAs are presumed to be degraded in muscle and adipose tissue rather than in the liver [81], and a recent study indicated that adipose tissue may make a more important contribution to the whole body BCAA metabolism [82]. It was reported that the activities of the mitochondrial branched chain amino acid aminotransferase and branched chain α-ketoacid dehydrogenase enzyme complex, the key enzymes in the catabolic pathway of BCAAs, were depressed in adipose tissue of obese ob/ob mice and Zucker rats, leading to increased BCAA levels [82]. Apart from the elevation of BCAAs in plasma, blood C3 and C5 acylcarnitine levels were observed to increase significantly in obesity [24]. In agreement with this, higher levels of propionyl-, butyryl-, and hexanoylcarnitines in obese male humans have been detected by metabolomics analysis [45]. Indeed, C3 acylcarnitines are a byproduct of both isoleucine and valine catabolism, and C5 acylcarnitines are intermediates in mitochondrial isoleucine and leucine catabolism [24]. In addition, elevation of blood pyruvate and alanine levels (Table 1)—both metabolites related to BCAA catabolic pathways—could contribute to development of glucose intolerance in obesity [24]. These metabolite changes may imply an overload of BCAA catabolism in obesity, caused by forcing the now expanded circulating BCAA pool to divert away from protein synthesis and into catabolic pathways [24].
A recent metabolomic study reported that both blood glutamine and glycine were significantly decreased in obese individuals when compared to their lean controls [83], which is consistent with the results of a previous study [84]. Both glutamine and glycine are nonessential amino acids that can be synthesized in the body. Glutamine is the most abundant amino acid in plasma [83], and glutamate, the precursor of glutamine, can be derived from 2-oxoglutarate in the TCA cycle [85]. Glycine can be generated from serine, an amino acid derived from pyruvate. Early experiments with 15N-labeled amino acids demonstrated that about 50% of the urinary ammonia is normally derived from the amide nitrogen and 16~25% from the amino nitrogen of plasma glutamine [86]. It has been reported that oral administration of glycine or glutamine is associated with a significant increase in the rate of urea synthesis, and administration of glycine results in a small increase in glutamine turnover in infants [87]. Thus, glutamine and glycine are important precursors for urea biosynthesis. In addition, as both glutamine and glycine are related to glucose metabolism, the depletion of glutamine or glycine in blood in obesity may lead to the dysfunction of cells [85].
2.5. Creatine Metabolism
Endogenous creatinine is a break-down product of creatine in muscle, which is biosynthesized from arginine and glycine [88]. In vivo, creatinine is usually produced at a fairly constant rate proportional to muscle mass, and then filtered from the blood by the kidneys. However, previous studies showed increased urinary excretion of creatinine in obese individuals during a 4-hour or 24-hour period [89]. Similar results were observed in HFD-fed obese mice and obese GHR mutant mice (Table 1). The reason for this may be related to skeletal and cardiac muscle hypertrophy to support and move the increased body mass [89], endogenous biosynthesis pathways, kidney function, or all of these [34].
In kidney, the excretion of creatinine is chiefly determined by glomerular filtration and proximal tubular secretion since virtually no creatinine is reabsorbed in the nephric tubule. Therefore, creatinine levels in blood and urine may be used to calculate the creatinine clearance, which usually reflects renal function in clinic [90]. It was reported that glomerular filtration rate and renal plasma flow exceeded the normal value by 51 and 31%, respectively, in nondiabetic subjects with severe obesity [91]. However, as indicated, obesity is associated with insulin resistance, hypertension, and dyslipidemia [89]. These metabolic abnormalities pose a higher risk for kidney diseases, which decreases creatinine clearance [92, 93], as does aging [94], thus caution is required in interpreting changes in creatinine clearance in obesity and diabetes.
3. Discussion
Metabolomics as a tool for determining biochemical profiles has in recent years been increasingly employed for investigating obesity and related diseases. With technological improvements in sensitivity and resolution, especially in multihyphenated NMR and MS, an increasingly large number of metabolites can be reliably detected and identified simultaneously in biofluids and tissue. In addition, integration and correlation of data derived from different biofluids, such as urine, plasma or tissues, and even of other “omics” data, can be achieved through new bioinformatic approaches [95]. These are expected to facilitate the development of metabolic models to understand the alterations of metabolism during obesity and related diseases such as type 2 diabetes. Based on the examples presented in this review, it is evident that metabolomics, especially when integrating multiple detecting techniques or using a multiomics approach, is a useful tool for investigating obesity. The information generated by metabolomic analysis provides us with increased knowledge as to how the metabolic network is perturbed during obesity.
However, dietary influence is a major issue that should be taken into consideration in metabolomics when relating changes in biologically significant metabolites to obesity. It has been reported that the most recent diet can strongly affect the serum profile of mice, particularly with respect to energy metabolism and glucose utilization, despite fasting prior to serum collection [19]. HFD-fed animal models are widely used for studying environmental influences resulting in obesity [10, 96]. However, the modified nutrient composition of HFD with a high content of fat (59%, 21% for standard diet) [28] and lower protein availability may instantly change the biofluid profiles such as amino acids, even before obesity occurs, because the levels of many metabolites derive from the balance of de novo synthesis, dietary supplement, and urinary excretion. In addition, it was found that the food intake of obese mice induced by HFD was decreased approximately 10% [41]. Therefore, in metabolomic analysis the effect of diet needs to be taken into account to obtain the metabolite alterations related to obesity rather than to diet changes.
Acknowledgments
This work was supported by Discovery Project Grant DP1096950 from the Australian Research Council. The authors thank Ms. Jordan Collier for help with formatting Figure 1 and the reference list.
References
- 1.Permana PA, Del Parigi A, Tataranni PA. Microarray gene expression profiling in obesity and insulin resistance. Nutrition. 2004;20(1):134–138. doi: 10.1016/j.nut.2003.09.023. [DOI] [PubMed] [Google Scholar]
- 2.Kussmann M, Raymond F, Affolter M. OMICS-driven biomarker discovery in nutrition and health. Journal of Biotechnology. 2006;124(4):758–787. doi: 10.1016/j.jbiotec.2006.02.014. [DOI] [PubMed] [Google Scholar]
- 3.Schmid C, Goede DL, Hauser RS, Brändle M. Increased prevalence of high Body Mass Index in patients presenting with pituitary tumours: severe obesity in patients with macroprolactinoma. Swiss Medical Weekly. 2006;136(15-16):254–258. doi: 10.4414/smw.2006.10955. [DOI] [PubMed] [Google Scholar]
- 4.Hill JO, Trowbridge FL. Childhood obesity: future directions and research priorities. Pediatrics. 1998;101(3):570–574. doi: 10.1542/peds.101.3.570. [DOI] [PubMed] [Google Scholar]
- 5.Aranceta Bartrina J. Prevalence of obesity in developed countries: current status and perspectives. Nutricion Hospitalaria. 2002;17(supplement 1):34–41. [PubMed] [Google Scholar]
- 6.von Deneen KM, Wei Q, Tian J, Liu Y. Obesity in China: what are the causes? Current Pharmaceutical Design. 2011;17(12):1132–1139. doi: 10.2174/138161211795656765. [DOI] [PubMed] [Google Scholar]
- 7.Nicholson JK, Lindon JC. Systems biology: Metabonomics. Nature. 2008;455(7216):1054–1056. doi: 10.1038/4551054a. [DOI] [PubMed] [Google Scholar]
- 8.Maher AD, Lindon JC, Nicholson JK. H NMR-based metabonomics for investigating diabetes. Future Medicinal Chemistry. 2009;1(4):737–747. doi: 10.4155/fmc.09.54. [DOI] [PubMed] [Google Scholar]
- 9.Spratlin JL, Serkova NJ, Eckhardt SG. Clinical applications of metabolomics in oncology: a review. Clinical Cancer Research. 2009;15(2):431–440. doi: 10.1158/1078-0432.CCR-08-1059. [DOI] [PMC free article] [PubMed] [Google Scholar]
- 10.Lee MS, Jung BH, Chung BC, et al. Metabolomics study with gas chromatography-mass spectrometry for predicting valproic acid-induced hepatotoxicity and discovery of novel biomarkers in rat urine. International Journal of Toxicology. 2009;28(5):392–404. doi: 10.1177/1091581809340329. [DOI] [PubMed] [Google Scholar]
- 11.Connor SC, Hansen MK, Corner A, Smith RF, Ryan TE. Integration of metabolomics and transcriptomics data to aid biomarker discovery in type 2 diabetes. Molecular BioSystems. 2010;6(5):909–921. doi: 10.1039/b914182k. [DOI] [PubMed] [Google Scholar]
- 12.Dumas ME, Barton RH, Toye A, et al. Metabolic profiling reveals a contribution of gut microbiota to fatty liver phenotype in insulin-resistant mice. Proceedings of the National Academy of Sciences of the United States of America. 2006;103(33):12511–12516. doi: 10.1073/pnas.0601056103. [DOI] [PMC free article] [PubMed] [Google Scholar]
- 13.Wang Z, Klipfell E, Bennett BJ, et al. Gut flora metabolism of phosphatidylcholine promotes cardiovascular disease. Nature. 2011;472(7341):57–65. doi: 10.1038/nature09922. [DOI] [PMC free article] [PubMed] [Google Scholar]
- 14.Speakman J, Hambly C, Mitchell S, Król E. The contribution of animal models to the study of obesity. Laboratory Animals. 2008;42(4):413–432. doi: 10.1258/la.2007.006067. [DOI] [PubMed] [Google Scholar]
- 15.Lindon JC, Nicholson JK. Spectroscopic and statistical techniques for information recovery in metabonomics and metabolomics. Annual Review of Analytical Chemistry. 2008;1(1):45–69. doi: 10.1146/annurev.anchem.1.031207.113026. [DOI] [PubMed] [Google Scholar]
- 16.Lindon JC, Holmes E, Nicholson JK. Metabonomics techniques and applications to pharmaceutical research & development. Pharmaceutical Research. 2006;23(6):1075–1088. doi: 10.1007/s11095-006-0025-z. [DOI] [PubMed] [Google Scholar]
- 17.Griffin JL, Gulston MK, Titman CM. Applications of metabolomics to understanding obesity in mouse and man. Biomarkers in Medicine. 2007;1(4):575–582. doi: 10.2217/17520363.1.4.575. [DOI] [PubMed] [Google Scholar]
- 18.Serkova NJ, Jackman M, Brown JL, et al. Metabolic profiling of livers and blood from obese Zucker rats. Journal of Hepatology. 2006;44(5):956–962. doi: 10.1016/j.jhep.2005.07.009. [DOI] [PubMed] [Google Scholar]
- 19.Duggan GE, Hittel DS, Hughey CC, Weljie A, Vogel HJ, Shearer J. Differentiating short- and long-term effects of diet in the obese mouse using 1H-nuclear magnetic resonance metabolomics. Diabetes, Obesity and Metabolism. 2011;13(9):859–862. doi: 10.1111/j.1463-1326.2011.01410.x. [DOI] [PubMed] [Google Scholar]
- 20.Kim SH, Yang SO, Kim HS, Kim Y, Park T, Choi HK. 1H-nuclear magnetic resonance spectroscopy-based metabolic assessment in a rat model of obesity induced by a high-fat diet. Analytical and Bioanalytical Chemistry. 2009;395(4):1117–1124. doi: 10.1007/s00216-009-3054-8. [DOI] [PubMed] [Google Scholar]
- 21.Waldram A, Holmes E, Wang Y, et al. Top-down systems biology modeling of host metabotype-microbiome associations in obese rodents. Journal of Proteome Research. 2009;8(5):2361–2375. doi: 10.1021/pr8009885. [DOI] [PubMed] [Google Scholar]
- 22.Rull A, Vinaixa M, Ángel Rodríguez M, et al. Metabolic phenotyping of genetically modified mice: an NMR metabonomic approach. Biochimie. 2009;91(8):1053–1057. doi: 10.1016/j.biochi.2009.04.019. [DOI] [PubMed] [Google Scholar]
- 23.Zhao LC, Zhang XD, Liao SX, Wang HY, Lin DH, Gao HC. A metabonomic comparison of urinary changes in Zucker and GK rats. Journal of Biomedicine and Biotechnology. 2010;2010:6 pages. doi: 10.1155/2010/431894. Article ID 431894. [DOI] [PMC free article] [PubMed] [Google Scholar]
- 24.Newgard CB, An J, Bain JR, et al. A branched-chain amino acid-related metabolic signature that differentiates obese and lean humans and contributes to insulin resistance. Cell Metabolism. 2009;9(4):311–326. doi: 10.1016/j.cmet.2009.02.002. [DOI] [PMC free article] [PubMed] [Google Scholar]
- 25.Kreisberg RA. Glucose-lactate inter-relations in man. New England Journal of Medicine. 1972;287(3):132–137. doi: 10.1056/NEJM197207202870307. [DOI] [PubMed] [Google Scholar]
- 26.Jansson PA, Larsson A, Smith U, Lonnroth P. Lactate release from the subcutaneous tissue in lean and obese men. Journal of Clinical Investigation. 1994;93(1):240–246. doi: 10.1172/JCI116951. [DOI] [PMC free article] [PubMed] [Google Scholar]
- 27.Isken F, Schulz TJ, Weickert MO, Pfeiffer AFH, Ristow M. Chemical inhibition of citrate metabolism alters body fat content in mice. Hormone and Metabolic Research. 2006;38(2):134–136. doi: 10.1055/s-2006-925136. [DOI] [PubMed] [Google Scholar]
- 28.Shearer J, Duggan G, Weljie A, Hittel DS, Wasserman DH, Vogel HJ. Metabolomic profiling of dietary-induced insulin resistance in the high fat-fed C57BL/6J mouse. Diabetes, Obesity and Metabolism. 2008;10(10):950–958. doi: 10.1111/j.1463-1326.2007.00837.x. [DOI] [PMC free article] [PubMed] [Google Scholar]
- 29.DeVilliers DC, Dixit PK, Lazarow A. Citrate metabolism in diabetes. I. Plasma citrate in alloxan-diabetic rats and in clinical diabetes. Metabolism. 1966;15(5):458–465. doi: 10.1016/0026-0495(66)90088-6. [DOI] [PubMed] [Google Scholar]
- 30.Penttila IM, Pollanen LO. Effect of insulin acid tolbutamide on blood citric acid in rabbits. Scandinavian Journal of Clinical and Laboratory Investigation. 1959;11:322–325. doi: 10.3109/00365515909060459. [DOI] [PubMed] [Google Scholar]
- 31.Natelson S, Pincus JB, Rannazzisi G. Dynamic control of calcium, phosphate, citrate, and glucose levels in blood serum. Effect of ACTH, adrenaline, noradrenaline, hydrocortisone, parathormone, insulin, and glucagon. Clinical chemistry. 1963;9:31–62. [PubMed] [Google Scholar]
- 32.Li H, Xie Z, Lin J, et al. Transcriptomic and metabonomic profiling of obesity-prone and obesity-resistant rats under high fat diet. Journal of Proteome Research. 2008;7(11):4775–4783. doi: 10.1021/pr800352k. [DOI] [PubMed] [Google Scholar]
- 33.Cupisti A, Meola M, D’Alessandro C, et al. Insulin resistance and low urinary citrate excretion in calcium stone formers. Biomedicine and Pharmacotherapy. 2007;61(1):86–90. doi: 10.1016/j.biopha.2006.09.012. [DOI] [PubMed] [Google Scholar]
- 34.Schirra HJ, Anderson CG, Wilson WJ, et al. Altered metabolism of growth hormone receptor mutant mice: a combined NMR metabonomics and microarray study. PLoS One. 2008;3(7) doi: 10.1371/journal.pone.0002764. Article ID e2764. [DOI] [PMC free article] [PubMed] [Google Scholar]
- 35.Rowland JE, Lichanska AM, Kerr LM, et al. In vivo analysis of growth hormone receptor signaling domains and their associated transcripts. Molecular and Cellular Biology. 2005;25(1):66–77. doi: 10.1128/MCB.25.1.66-77.2005. [DOI] [PMC free article] [PubMed] [Google Scholar]
- 36.Simpson DP. Citrate excretion: a window on renal metabolism. The American journal of physiology. 1983;244(3):F223–F234. doi: 10.1152/ajprenal.1983.244.3.F223. [DOI] [PubMed] [Google Scholar]
- 37.Souto G, Donapetry C, Calviño J, Adeva MM. Metabolic acidosis-induced insulin resistance and cardiovascular risk. Metabolic Syndrome and Related Disorders. 2011;9(4):247–253. doi: 10.1089/met.2010.0108. [DOI] [PMC free article] [PubMed] [Google Scholar]
- 38.Öhrvall M, Berglund L, Salminen I, Lithell H, Aro A, Vessby B. The serum cholesterol ester fatty acid composition but not the serum concentration of alpha tocopherol predicts the development of myocardial infarction in 50-year-old men: 19 years follow-up. Atherosclerosis. 1996;127(1):65–71. doi: 10.1016/s0021-9150(96)05936-9. [DOI] [PubMed] [Google Scholar]
- 39.Laaksonen DE, Lakka TA, Lakka HM, et al. Serum fatty acid composition predicts development of impaired fasting glycaemia and diabetes in middle-aged men. Diabetic Medicine. 2002;19(6):456–464. doi: 10.1046/j.1464-5491.2002.00707.x. [DOI] [PubMed] [Google Scholar]
- 40.Green R, Kwok S, Durrington PN. Preventing cardiovascular disease in hypertension: effects of lowering blood pressure and cholesterol. QJM. 2002;95(12):821–826. doi: 10.1093/qjmed/95.12.821. [DOI] [PubMed] [Google Scholar]
- 41.Kim H-J, Kim JH, Noh S, et al. Metabolomic analysis of livers and serum from high-fat diet induced obese mice. Journal of Proteome Research. 2011;10(2):722–731. doi: 10.1021/pr100892r. [DOI] [PubMed] [Google Scholar]
- 42.Golay A, Swislocki ALM, Chen YDI. Effect of obesity on ambient plasma glucose, free fatty acid, insulin, growth hormone, and glucagon concentrations. Journal of Clinical Endocrinology and Metabolism. 1986;63(2):481–484. doi: 10.1210/jcem-63-2-481. [DOI] [PubMed] [Google Scholar]
- 43.Wang L, Folsom AR, Zheng ZJ, Pankow JS, Eckfeldt JH. Plasma fatty acid composition and incidence of diabetes in middle-aged adults: the Atherosclerosis Risk in Communities (ARIC) Study. American Journal of Clinical Nutrition. 2003;78(1):91–98. doi: 10.1093/ajcn/78.1.91. [DOI] [PubMed] [Google Scholar]
- 44.Rossner S, Walldius G, Bjorvell H. Fatty acid composition in serum lipids and adipose tissue in severe obesity before and after six weeks of weight loss. International Journal of Obesity. 1989;13(5):603–612. [PubMed] [Google Scholar]
- 45.Kim JY, Park JY, Kim OY, et al. Metabolic profiling of plasma in overweight/obese and lean men using ultra performance liquid chromatography and Q-TOF Mass spectrometry (UPLC-Q-TOF MS) Journal of Proteome Research. 2010;9(9):4368–4375. doi: 10.1021/pr100101p. [DOI] [PubMed] [Google Scholar]
- 46.Randle PJ. Regulatory interactions between lipids and carbohydrates: the glucose fatty acid cycle after 35 years. Diabetes/Metabolism Reviews. 1998;14(4):263–283. doi: 10.1002/(sici)1099-0895(199812)14:4<263::aid-dmr233>3.0.co;2-c. [DOI] [PubMed] [Google Scholar]
- 47.Cha YS. Effects of L-carnitine on obesity, diabetes, and as an ergogenic aid. Asia Pacific Journal of Clinical Nutrition. 2008;17(1):306–308. [PubMed] [Google Scholar]
- 48.Mun EG, Soh JR, Cha YS. L-carnitine reduces obesity caused by high-fat diet in C57BL/6J mice. Food Science and Biotechnology. 2007;16(2):228–233. [Google Scholar]
- 49.Yoo HH, Yoon HJ, Shin HJ, Lee SH, Yoon HR. Characterization of plasma carnitine level in obese adolescent Korean women. Biomolecules and Therapeutics. 2009;17(2):181–187. [Google Scholar]
- 50.Satoh H. Cardioprotective actions of taurine against intracellular and extracellular calcium-induced effects. Advances in Experimental Medicine and Biology. 1994;359:181–196. doi: 10.1007/978-1-4899-1471-2_19. [DOI] [PubMed] [Google Scholar]
- 51.Nakaya Y, Minami A, Harada N, Sakamoto S, Niwa Y, Ohnaka M. Taurine improves insulin sensitivity in the Otsuka Long-Evans Tokushima Fatty rat, a model of spontaneous type 2 diabetes. American Journal of Clinical Nutrition. 2000;71(1):54–58. doi: 10.1093/ajcn/71.1.54. [DOI] [PubMed] [Google Scholar]
- 52.Zhang M, Bi LF, Fang JH, et al. Beneficial effects of taurine on serum lipids in overweight or obese non-diabetic subjects. Amino Acids. 2004;26(3):267–271. doi: 10.1007/s00726-003-0059-z. [DOI] [PubMed] [Google Scholar]
- 53.Williams R, Lenz EM, Wilson AJ, et al. A multi-analytical platform approach to the metabonomic analysis of plasma from normal and zucker (fa/fa) obese rats. Molecular BioSystems. 2006;2(3-4):174–183. doi: 10.1039/b516356k. [DOI] [PubMed] [Google Scholar]
- 54.Rubio-Aliaga I, de Roos B, Sailer M, et al. Alterations in hepatic one-carbon metabolism and related pathways following a high-fat dietary intervention. Physiological Genomics. 2011;43(8):408–416. doi: 10.1152/physiolgenomics.00179.2010. [DOI] [PubMed] [Google Scholar]
- 55.Klein MS, Dorn C, Saugspier M, Hellerbrand C, Oefner PJ, Gronwald W. Discrimination of steatosis and NASH in mice using nuclear magnetic resonance spectroscopy. Metabolomics. 2011;7(2):237–246. [Google Scholar]
- 56.Duggan GE, Hittel DS, Sensen CW, Weljie AM, Vogel HJ, Shearer J. Metabolomic response to exercise training in lean and diet-induced obese mice. Journal of Applied Physiology. 2011;110(5):1311–1318. doi: 10.1152/japplphysiol.00701.2010. [DOI] [PubMed] [Google Scholar]
- 57.Jeevanandam M, Ramias L, Schiller WR. Altered plasma free amino acid levels in obese traumatized man. Metabolism. 1991;40(4):385–390. doi: 10.1016/0026-0495(91)90149-q. [DOI] [PubMed] [Google Scholar]
- 58.Tsuboyama-Kasaoka N, Shozawa C, Sano K, et al. Taurine (2-Aminoethanesulfonic Acid) deficiency creates a vicious circle promoting obesity. Endocrinology. 2006;147(7):3276–3284. doi: 10.1210/en.2005-1007. [DOI] [PubMed] [Google Scholar]
- 59.Zeisel SH. Choline: an essential nutrient for humans. Nutrition. 2000;16(7-8):669–671. doi: 10.1016/s0899-9007(00)00349-x. [DOI] [PubMed] [Google Scholar]
- 60.Blusztajn JK. Choline, a vital amine. Science. 1998;281(5378):794–795. doi: 10.1126/science.281.5378.794. [DOI] [PubMed] [Google Scholar]
- 61.Gibellini F, Smith TK. The Kennedy pathway-de novo synthesis of phosphatidylethanolamine and phosphatidylcholine. IUBMB Life. 2010;62(6):414–428. doi: 10.1002/iub.337. [DOI] [PubMed] [Google Scholar]
- 62.Michel V, Singh RK, Bakovic M. The impact of choline availability on muscle lipid metabolism. Food and Function. 2011;2(1):53–62. doi: 10.1039/c0fo00069h. [DOI] [PubMed] [Google Scholar]
- 63.Steiber A, Kerner J, Hoppel CL. Carnitine: a nutritional, biosynthetic, and functional perspective. Molecular Aspects of Medicine. 2004;25(5-6):455–473. doi: 10.1016/j.mam.2004.06.006. [DOI] [PubMed] [Google Scholar]
- 64.Rinella ME, Green RM. The methionine-choline deficient dietary model of steatohepatitis does not exhibit insulin resistance. Journal of Hepatology. 2004;40(1):47–51. doi: 10.1016/j.jhep.2003.09.020. [DOI] [PubMed] [Google Scholar]
- 65.Yamaguchi K, Yang L, McCall S, et al. Inhibiting triglyceride synthesis improves hepatic steatosis but exacerbates liver damage and fibrosis in obese mice with nonalcoholic steatohepatitis. Hepatology. 2007;45(6):1366–1374. doi: 10.1002/hep.21655. [DOI] [PubMed] [Google Scholar]
- 66.Rinella ME, Elias MS, Smolak RR, Fu T, Borensztajn J, Green RM. Mechanisms of hepatic steatosis in mice fed a lipogenic methionine choline-deficient diet. Journal of Lipid Research. 2008;49(5):1068–1076. doi: 10.1194/jlr.M800042-JLR200. [DOI] [PMC free article] [PubMed] [Google Scholar]
- 67.de la Huerga J, Popper H. Urinary excretion of choline metabolites following choline administration in normals and patients with hepatobiliary diseases. Journal of Clinical Investigation. 1951;30(5):463–470. doi: 10.1172/JCI102463. [DOI] [PMC free article] [PubMed] [Google Scholar]
- 68.Al-Waiz M, Mikov M, Mitchell SC, Smith RL. The exogenous origin of trimethylamine in the mouse. Metabolism: Clinical and Experimental. 1992;41(2):135–136. doi: 10.1016/0026-0495(92)90140-6. [DOI] [PubMed] [Google Scholar]
- 69.Turnbaugh PJ, Ley RE, Mahowald MA, Magrini V, Mardis ER, Gordon JI. An obesity-associated gut microbiome with increased capacity for energy harvest. Nature. 2006;444(7122):1027–1031. doi: 10.1038/nature05414. [DOI] [PubMed] [Google Scholar]
- 70.Holeček M. The BCAA-BCKA cycle: its relation to alanine and glutamine synthesis and protein balance. Nutrition. 2001;17(1):p. 70. doi: 10.1016/s0899-9007(00)00483-4. [DOI] [PubMed] [Google Scholar]
- 71.Doi M, Yamaoka I, Nakayama M, Sugahara K, Yoshizawa F. Hypoglycemic effect of isoleucine involves increased muscle glucose uptake and whole body glucose oxidation and decreased hepatic gluconeogenesis. American Journal of Physiology. 2007;292(6):E1683–E1693. doi: 10.1152/ajpendo.00609.2006. [DOI] [PubMed] [Google Scholar]
- 72.Lynch CJ, Gern B, Lloyd C, Hutson SM, Eicher R, Vary TC. Leucine in food mediates some of the postprandial rise in plasma leptin concentrations. American Journal of Physiology. 2006;291(3):E621–E630. doi: 10.1152/ajpendo.00462.2005. [DOI] [PubMed] [Google Scholar]
- 73.Poon RTP, Yu WC, Fan ST, Wong J. Long-term oral branched chain amino acids in patients undergoing chemoembolization for hepatocellular carcinoma: a randomized trial. Alimentary Pharmacology and Therapeutics. 2004;19(7):779–788. doi: 10.1111/j.1365-2036.2004.01920.x. [DOI] [PubMed] [Google Scholar]
- 74.Watford M. Lowered concentrations of branched-chain amino acids result in impaired growth and neurological problems: insights from a branched-chain α-keto acid dehydrogenase complex kinase-deficient mouse model. Nutrition Reviews. 2007;65(4):167–172. doi: 10.1111/j.1753-4887.2007.tb00296.x. [DOI] [PubMed] [Google Scholar]
- 75.Felig P, Marliss E, Cahill GF. Plasma amino acid levels and insulin secretion in obesity. New England Journal of Medicine. 1969;281(15):811–816. doi: 10.1056/NEJM196910092811503. [DOI] [PubMed] [Google Scholar]
- 76.Felig P, Wahren J, Hendler R, Brundin T. Splanchnic glucose and amino acid metabolism in obesity. Journal of Clinical Investigation. 1974;53(2):582–590. doi: 10.1172/JCI107593. [DOI] [PMC free article] [PubMed] [Google Scholar]
- 77.Wang TJ, Larson MG, Vasan RS, et al. Metabolite profiles and the risk of developing diabetes. Nature Medicine. 2011;17(4):448–453. doi: 10.1038/nm.2307. [DOI] [PMC free article] [PubMed] [Google Scholar]
- 78.Sherwin RS. Effect of starvation on the turnover and metabolic response to leucine. Journal of Clinical Investigation. 1978;61(6):1471–1481. doi: 10.1172/JCI109067. [DOI] [PMC free article] [PubMed] [Google Scholar]
- 79.Adibi SA, Drash AL. Hormone and amino acid levels in altered nutritional states. The Journal of Laboratory and Clinical Medicine. 1970;76(5):722–732. [PubMed] [Google Scholar]
- 80.Forlani G, Vannini P, Marchesini G. Insulin-dependent metabolism of branched-chain amino acids in obesity. Metabolism. 1984;33(2):147–150. doi: 10.1016/0026-0495(84)90127-6. [DOI] [PubMed] [Google Scholar]
- 81.Shimomura Y, Murakami T, Nakai N, Nagasaki M, Harris RA. Exercise promotes BCAA catabolism: effects of BCAA supplementation on skeletal muscle during exercise. Journal of Nutrition. 2004;134(6):1583S–1587S. doi: 10.1093/jn/134.6.1583S. [DOI] [PubMed] [Google Scholar]
- 82.She P, Van Horn C, Reid T, Hutson SM, Cooney RN, Lynch CJ. Obesity-related elevations in plasma leucine are associated with alterations in enzymes involved in branched-chain amino acid metabolism. American Journal of Physiology. 2007;293(6):E1552–E1563. doi: 10.1152/ajpendo.00134.2007. [DOI] [PMC free article] [PubMed] [Google Scholar]
- 83.Oberbach A, Blüher M, Wirth H, et al. Combined proteomic and metabolomic profiling of serum reveals association of the complement system with obesity and identifies novel markers of body fat mass changes. Journal of Proteome Research. 2011;10(10):4769–4788. doi: 10.1021/pr2005555. [DOI] [PubMed] [Google Scholar]
- 84.Backman L, Hallberg D, Kallner A. Amino acid pattern in plasma before and after jejuno ileal shunt operation for obesity. Scandinavian Journal of Gastroenterology. 1975;10(8):811–816. [PubMed] [Google Scholar]
- 85.Newsholme P, Lima MMR, Procopio J, et al. Glutamine and glutamate as vital metabolites. Brazilian Journal of Medical and Biological Research. 2003;36(2):153–163. doi: 10.1590/s0100-879x2003000200002. [DOI] [PubMed] [Google Scholar]
- 86.Pitts RF, Pilkington LA. The relation between plasma concentrations of glutamine and glycine and utilization of their nitrogens as sources of urinary ammonia. Journal of Clinical Investigation. 1966;45(1):86–93. doi: 10.1172/JCI105326. [DOI] [PMC free article] [PubMed] [Google Scholar]
- 87.Parimi PS, Devapatla S, Gruca LL, Amini SB, Hanson RW, Kalhan SC. Effect of enteral glutamine or glycine on whole-body nitrogen kinetics in very-low-birth-weight infants. American Journal of Clinical Nutrition. 2004;79(3):402–409. doi: 10.1093/ajcn/79.3.402. [DOI] [PubMed] [Google Scholar]
- 88.Walker JB. Metabolic control of creatine biosynthesis. II. Restoration of transamidinase activity following creatine repression. The Journal of Biological Chemistry. 1961;236:493–498. [PubMed] [Google Scholar]
- 89.Konishi F. The relationship of urinary 17-hydroxycorticosteroids to creatinine in obesity. Metabolism. 1964;13(9):847–851. doi: 10.1016/0026-0495(64)90053-8. [DOI] [PubMed] [Google Scholar]
- 90.Lew SQ, Bosch JP. Effect of diet on creatinine clearance and excretion in young and elderly healthy subjects and in patients with renal disease. Journal of the American Society of Nephrology. 1991;2(4):856–865. doi: 10.1681/ASN.V24856. [DOI] [PubMed] [Google Scholar]
- 91.Chagnac A, Weinstein T, Korzets A, Ramadan E, Hirsch J, Gafter U. Glomerular hemodynamics in severe obesity. American Journal of Physiology. 2000;278(5):F817–F822. doi: 10.1152/ajprenal.2000.278.5.F817. [DOI] [PubMed] [Google Scholar]
- 92.Kim KE, Onesti G, Ramirez O, Brest AN, Swartz C. Creatinine clearance in renal disease. A reappraisal. British Medical Journal. 1969;4(674):11–14. doi: 10.1136/bmj.4.5674.11. [DOI] [PMC free article] [PubMed] [Google Scholar]
- 93.Sugino N. Evaluation of renal function in chronic renal disease with special reference to creatinine. Japanese Journal of Nephrology. 1990;32(7):745–750. [PubMed] [Google Scholar]
- 94.Peralta CA, Shlipak MG, Judd S, et al. Detection of chronic kidney disease with creatinine, cystatin c, and urine albumin-to-creatinine ratio and association with progression to end-stage renal disease and mortality. Journal of the American Medical Association. 2011;305(15):1545–1552. doi: 10.1001/jama.2011.468. [DOI] [PMC free article] [PubMed] [Google Scholar]
- 95.Fukushima A, Kusano M, Redestig H, Arita M, Saito K. Integrated omics approaches in plant systems biology. Current Opinion in Chemical Biology. 2009;13(5-6):532–538. doi: 10.1016/j.cbpa.2009.09.022. [DOI] [PubMed] [Google Scholar]
- 96.Fearnside JF, Dumas ME, Rothwell AR, et al. Phylometabonomic patterns of adaptation to high fat diet feeding in inbred mice. PLoS One. 2008;3(2) doi: 10.1371/journal.pone.0001668. Article ID e1668. [DOI] [PMC free article] [PubMed] [Google Scholar]
- 97.Calvani R, Miccheli A, Capuani G, et al. Gut microbiome-derived metabolites characterize a peculiar obese urinary metabotype. International Journal of Obesity. 2010;34(6):1095–1098. doi: 10.1038/ijo.2010.44. [DOI] [PubMed] [Google Scholar]