Abstract
The UT-A1 urea transporter plays a critical role in the production of concentrated urine. Both vasopressin and hypertonicity increase urea permeability in rat terminal inner medullary collecting ducts (IMCD). Each agonist independently increases UT-A1 phosphorylation and apical plasma membrane accumulation. Vasopressin activates PKA and phosphorylates UT-A1 at serines 486 and 499. Hypertonicity stimulates urea permeability through protein kinase C (PKC) and intracellular calcium. To determine whether the hypertonic stimulation of urea permeability results from a PKC-mediated phosphorylation of UT-A1, rat IMCDs were metabolically labeled with [32P]. Hypertonicity stimulated UT-A1 phosphorylation, and this increase was blocked by preincubation with a PKC inhibitor. IMCDs were biotinylated to assess plasma membrane UT-A1. Hypertonicity increased biotinylated UT-A1, and this increase was blocked by preincubation with a PKC inhibitor. When PKC was directly activated using a phorbol ester, total UT-A1 phosphorylation increased, but phosphorylation at serine 486 was not increased, indicating that PKC did not phosphorylate UT-A1 at the same residue as PKA. Since PKC-α is a calcium-dependent PKC isoform and PKC-α knockout mice have a urine-concentrating defect, it suggested that PKC-α may mediate the response to hypertonicity. Consistent with this hypothesis, hypertonicity increased phospho-PKC-α in rat IMCDs. Finally, PKC-α knockout mice were used to determine whether hypertonicity could stimulate UT-A1 phosphorylation in the absence of PKC-α. Hypertonicity significantly increased UT-A1 phosphorylation in wild-type mice but not in PKC-α knockout mice. We conclude that PKC-α mediates the hypertonicity-stimulated increase in UT-A1 phosphorylation in the IMCD.
Keywords: vasopressin, urine-concentrating mechanism
the kidney's ability to produce concentrated urine depends on the coordinated actions of solute (NaCl, urea) transporters and water channels (reviewed in Ref. 17). In the inner medulla, the water channels and the urea transporters are the major transport proteins involved in the concentrating mechanism. Vasopressin, also known as antidiuretic hormone, activates both water channels and urea transporters. Vasopressin signals through the V2 vasopressin receptor, a Gs-coupled receptor, to increase cAMP, which in turn activates protein kinase A (PKA) to phosphorylate and activate both aquaporin-2 and the urea transporter UT-A1. The PKA-mediated phosphorylation of UT-A1 at serines 486 and 499 is necessary for the movement of UT-A1 to the apical plasma membrane where it transports urea from the tubule lumen, and in coordinated action with UT-A3 at the basolateral membrane, transcellularly to the inner medullary interstitium (2, 3, 13). The result is an increase in the osmolality of the interstitium.
A hypertonic interstitium is required to achieve concentrated urine (reviewed in Ref. 17). In the outer medulla, thick ascending limbs of the loops of Henle reabsorb NaCl, diluting luminal fluid and providing NaCl to increase the osmolality of the medullary interstitium, collecting ducts, and vasculature. The countercurrent orientation of the nephron and vessels allows an osmolality gradient to be generated from cortex to medulla. In the inner medulla, the hypertonic interstitium is widely ascribed to the passive reabsorption of NaCl (15, 20). Although the mechanism for urine concentration in the inner medulla remains controversial, there is a general agreement that urea transport and urea transporters are required since genetically engineered mice that lack UT-A1 and UT-A3 have a marked urine-concentrating defect (6, 7).
Studies in isolated, perfused rat terminal inner medullary collecting ducts (IMCDs) show that raising the osmolality stimulates urea permeability independently of vasopressin (18). Hypertonic NaCl and vasopressin result in additive stimulatory effects on urea permeability (8, 18). The hypertonicity-stimulated increase in urea permeability is mediated by protein kinase C (PKC) (21) and is calcium dependent (9). Hypertonicity increases both the phosphorylation of the UT-A1 urea transporter and its apical plasma membrane accumulation (1). Thus, hypertonicity, as is found in the inner medulla, stimulates urea permeability by increasing the phosphorylation and apical plasma membrane accumulation of UT-A1.
In this study, we asked whether the hypertonic stimulation of urea permeability results from a PKC-mediated phosphorylation of UT-A1. Next, we asked whether the increase in UT-A1 phosphorylation was specific to hypertonicity or could be mimicked by directly activating PKC using a phorbol ester. Finally, we tested whether PKC-α, a calcium-dependent PKC isoform that is expressed in the IMCD (16, 22), is specifically involved in the response to hypertonicity.
MATERIALS AND METHODS
Animals.
All animal protocols were approved by the Emory University Institutional Animal Care and Use Committee. Sprague-Dawley rats (Charles River Laboratories, Wilmington, MA) weighing 100–150 g received free access to water and standard rat chow (Purina). PKC-α knockout mice were the kind gift of Dr. Jeffrey Molkentin, University of Cincinnati (4). C57Bl6 wild-type control mice and PKC-α knockout mice were maintained in the Emory Mouse Breeding facility.
For physiological assessments, mice were housed in metabolic cages for 48 h. Over the first 24 h mice were acclimatizing to their environment and no samples were collected. Urine was collected and food and water consumption was recorded over the second 24-h period.
Sample preparation for protein analysis.
Kidneys were removed and the inner medulla (IM) was collected and cut into small pieces. Fresh suspensions of rat or mouse IMCDs were prepared by enzymatic digest as described previously (13). IMCDs were treated with vasopressin (100 nM), a phorbol ester (phorbol dibutyrate, 2 μM), or a PKC inhibitor (chelerythrine, 10 μM) for 30 min. For hypertonic treatment of the IMCDs, osmolality was raised by adding sucrose to the incubation buffers.
Biotinylation.
Rat IMCD suspensions were biotinylated as described (1). IMCDs were biotinylated using biotinamidohexanoic acid 3-sulfo-N-hydroxysuccinimide ester (catalog no. B1022, Sigma) for 60 min at 4°C and biotinylated proteins were absorbed onto streptavidin beads overnight at 4°C. Proteins were solubilized by adding Laemmli SDS-PAGE sample buffer directly to the pellets, samples were boiled for 1 min, and the pool of biotinylated proteins was analyzed by Western blot (1, 5, 13).
Western blot analysis.
Proteins (20 μg/lane) were size separated by SDS-PAGE and then electroblotted to polyvinylidene difluoride membranes (Immobilon, Millipore, Bedford, MA) as described previously (14). Blots were blocked with 5% nonfat dry milk in Tris-buffered saline (20 mM Tris·HCl, 0.5 M NaCl, pH 7.5) for 1 h and then incubated with our polyclonal antibody to the COOH terminus of UT-A1 overnight at 4°C (14). In some experiments, blots were probed with our phosphospecific Pser486-UT-A1 antibody (11), or with commercial PKC-α and phosphoPKC-α antibodies (GeneTex, Irvine, CA). Blots were then incubated with Alexa Fluor 680-linked anti-rabbit IgG (Molecular Probes, Eugene, OR) and the bound secondary antibody was visualized using infrared detection with the Licor Odyssey protein analysis system.
Phosphorylation.
Metabolic labeling with 32P-orthophosphate was performed as previously published (24). After 3-h incubation of IM pieces in phosphate-free DMEM with 0.15 mCi/ml 32P-orthophosphate to radiolabel the ATP pool, vasopressin (100 nM), a phorbol ester (phorbol dibutyrate, 2 μM), or a PKC inhibitor (chelerythrine, 10 μM) was added to the radiolabeling buffer for an additional 30 min. In some experiments, incubation with vasopressin was followed by additional treatment with the phorbol ester. Following treatments, pieces were washed free of unincorporated 32P with phosphate-free DMEM and [32P]-UT-A1 was immunoprecipitated as previously described (10). Precipitated proteins were separated by SDS-PAGE and radiolabeled UT-A1 was determined by autoradiography of the dried gel. Parallel Western blots were performed to ensure uniform protein content per lane (data not shown).
Statistics.
All data are presented as means ± SE. To test two groups, we used a Student's t-test. To test more than two groups, we used an ANOVA, followed by Fisher's least significant difference (protected t-test) (19). The criterion for statistical significance is P < 0.05. N is the number of animals per condition in each experiment.
RESULTS
Hypertonicity stimulates UT-A1 phosphorylation.
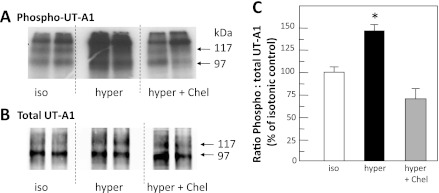
To determine whether the hypertonicity-stimulated increase in UT-A1 phosphorylation in rat IMCDs (1) is dependent on PKC, rat IMCDs were incubated for 15 min with the PKC inhibitor chelerythrine, followed by increasing the osmolality of the incubation medium from 290 to 600 mosmol/kgH2O by addition of sucrose. Figure 1A provides a representative autoradiogram showing radiolabeled UT-A1 in the presence and absence of hypertonic stimulation and PKC inhibition. Each lane provides results from the kidneys of a separate animal. Arrows indicate the 117- and 97-kDa glycoprotein forms of UT-A1. Total UT-A1 in each immunoprecipitated sample is provided in Fig. 1B. Hypertonicity significantly increased the ratio of phosphorylated UT-A1 to total UT-A1 by 49 ± 13% (P < 0.05, n = 8; Fig. 1C) above control isotonic levels. In contrast, there was no significant change in the ratio of phosphorylated UT-A1 to total UT-A1 after hypertonic stimulation when PKC is inhibited by chelerythrine (P = NS, n = 8; Fig. 1C).
Fig. 1.
Inhibition of protein kinase C (PKC) blocks hypertonic stimulation of UT-A1 phosphorylation. Metabolically labeled (32P) rat inner medullary collecting ducts (IMCDs) were incubated with 290-mosmol/kgH2O buffer (iso), 600-mosmol/kgH2O buffer (hyper), or 600-mosmol/kgH2O buffer with 10 μM chelerythrine (hyper + Chel) and then immunoprecipitated with anti-UT-A1 and analyzed by Western blot and autoradiography. A: autoradiogram of 32P-UT-A1. B: Western blot of total UT-A1 for representative samples. Each lane provides results from the kidneys of a separate animal. Arrows indicate the 117- and 97-kDa glycoprotein forms of UT-A1. C: bar of the ratio of phosphorylated UT-A1 to total UT-A1 from all samples from 2 separate cohorts of animals, presented as means ± SE, n = 8/condition. *P < 0.05 vs. isotonic control.
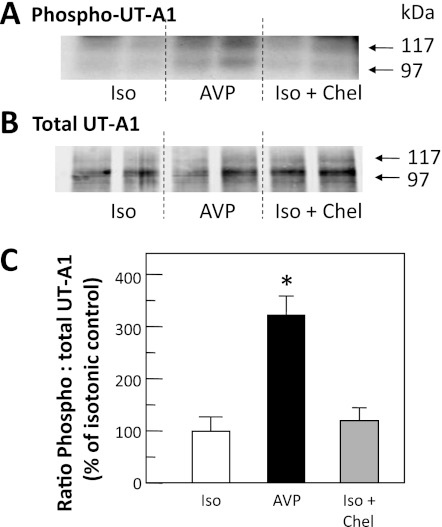
We next compared the ratio of phosphorylated UT-A1 (Fig. 2A) to total UT-A1 (Fig. 2B) when IMCDs were treated with chelerythrine under isotonic conditions. To ensure that the tissue was responsive, we treated with vasopressin and observed the expected increase in UT-A1 phosphorylation. The bar graph combining two cohorts of animals (n = 6 per condition) confirms that there was no statistically significant effect of chelerythrine on the phosphorylation level of UT-A1 under isotonic conditions (Fig. 2C).
Fig. 2.
Chel does not decrease phosphorylation under isotonic (Iso) conditions. Metabolically labeled (32P) rat IMCDs were incubated for 30 min with 100 nM arginine vasopressin (AVP) or 10 μM Chel and then immunoprecipitated with anti-UT-A1 and analyzed by Western blot and autoradiography. A: autoradiogram of 32P-UT-A1. B: Western blot of total UT-A1 for representative samples. Each lane provides results from the kidneys of a separate animal. Arrows indicate the 117- and 97-kDa glycoprotein forms of UT-A1. C: bar of the ratio of phosphorylated UT-A1 to total UT-A1 from all samples from 2 separate cohorts of animals, presented as means ± SE, n = 6/condition. *P < 0.05 vs. isotonic control.
Hypertonicity alters the membrane accumulation of UT-A1.
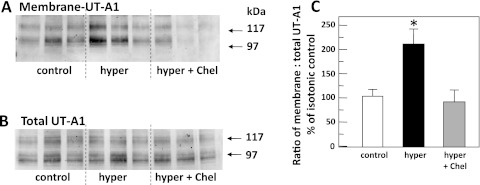
To determine whether the hypertonicity-stimulated increase in biotinylated UT-A1 in rat IMCDs (1) was dependent on PKC, rat IMCDs were incubated in either 450-mosmol/kgH2O buffer (control), 900-mosmol/kgH2O buffer, or 900-mosmol/kgH2O buffer with the PKC inhibitor chelerythrine, for 30 min, and then biotinylated to reveal membrane-associated UT-A1. Sucrose was added to bring the osmolality of the hypertonic solution to 900 mosmol/kgH2O in these experiments because the biotinylation buffer is slightly hyperosmolar already (450 mosmol/kgH2O) and the new level reflects a doubling of the osmolality, similar to the degree of change in the phosphorylation studies and consistent with our previous characterization of the membrane accumulation of UT-A1 with hyperosmolality (1). Figure 3A shows the Western blot of biotinylated UT-A1 and Fig. 3B shows total UT-A1 from control, hypertonic, and hypertonically stimulated IMCDs with PKC inhibition. The membrane-associated UT-A1 was normalized to the total protein present and these ratios were compared for response to changing tonicity. Membrane-associated UT-A1 increased by 100 ± 32% over control levels in IMCDs subjected to 900-mosmol/kgH2O conditions (P < 0.05, n = 6; Fig. 3C). Pretreatment with chelerythrine to inhibit PKC ablated any stimulation of membrane accumulation by hypertonicity (−16 ± 16% of control levels, P = NS, n = 6; Fig. 3C).
Fig. 3.
Hypertonic stimulation of UT-A1 membrane accumulation is blocked by inhibition of PKC. Rat IMCD suspensions were incubated in either 450-mosmol/kgH2O buffer (control), 900-mosmol/kgH2O buffer (hyper), or 900-mosmol/kgH2O buffer with 10 μM Chel (hyper + Chel), for 30 min, and then biotinylated to reveal membrane-associated UT-A1. The biotinylated protein population was subjected to Western blot analysis probed with anti-UT-A1. A: membrane-associated UT-A1. B: total UT-A1 in representative samples. Each lane provides results from the kidneys of a separate animal. Arrows indicate the 117- and 97-kDa glycoprotein forms of UT-A1. C: bar of the ratio of membrane UT-A1 to total UT-A1 from all samples presented as means ± SE, n = 6/condition. *P < 0.05 vs. isotonic control.
Stimulation of PKC with phorbol dibutyrate increases UT-A1 phosphorylation.
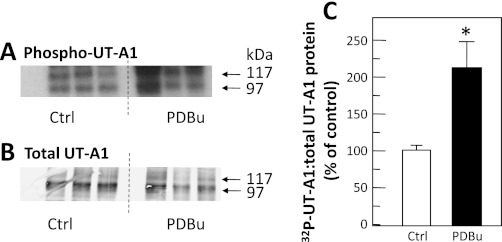
To determine whether directly stimulating PKC with a phorbol ester, phorbol dibutyrate, increases UT-A1 phosphorylation, IMCDs from normal rats were metabolically labeled with 32P-orthophosphate for 3 h and then treated with phorbol dibutyrate for 30 min. Figure 4A shows the autoradiogram of the dried gel with each lane from a different animal and equal portion of the original tissue loaded per lane. Figure 4B shows the Western blot of the same samples showing the amount of UT-A1 per sample. Stimulating PKC with phorbol dibutyrate significantly increased the ratio of phospho-UT-A1 to total UT-A1 by 111 ± 41% (P < 0.05, n = 6; Fig. 4C).
Fig. 4.
Stimulation of PKC results in increased UT-A1 phosphorylation. Metabolically labeled (32P) rat IMCDs were incubated without (control, Ctrl) or with 2 μM phorbol dibutyrate (PDBu) for 30 min, and then UT-A1 was immunoprecipitated and analyzed by Western blot and autoradiography. A: autoradiogram of 32P-UT-A1. B: Western blot of total UT-A1 for representative samples. Arrows indicate the 117- and 97-kDa glycoprotein forms of UT-A1. C: bar of the ratio of phosphorylated UT-A1 to total UT-A1 from all samples presented as means ± SE, n = 6/condition. *P < 0.05 vs. Ctrl.
Phosphorylation by PKC is supplemented by PKA.
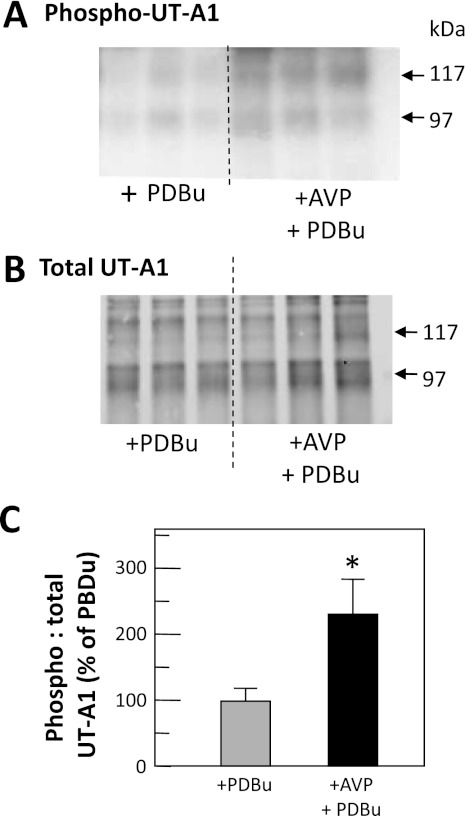
To determine whether vasopressin could further increase phorbol dibutyrate-stimulated levels of UT-A1 phosphorylation, rat IMCDs were radiolabeled and then treated with phorbol dibutyrate or a combination of 100 nM vasopressin and phorbol dibutyrate for 30 min. Figure 5A (autoradiogram) and 5B (Western blot) shows the phosphorylated and total UT-A1, respectively, in representative samples. The ratio of phospho-UT-A1 to total UT-A1 in IMCDs treated with both vasopressin and phorbol dibutyrate was significantly increased (228 ± 52%, P < 0.05, n = 9; Fig. 5C) above the level with phorbol dibutyrate alone.
Fig. 5.
Phosphorylation of UT-A1 by PKA+PKC exceeds PKC phosphorylation levels. Metabolically labeled (32P) rat IMCDs were incubated with PDBu or both AVP with PDBu (AVP+PDBu) and then immunoprecipitated with anti-UT-A1 and analyzed by Western blot and autoradiography. A: autoradiogram of 32P-UT-A1. B: Western blot of total UT-A1 for representative samples. Arrows indicate the 117- and 97-kDa glycoprotein forms of UT-A1. C: bar of the ratio of phosphorylated UT-A1 to total UT-A1 from all samples from 3 cohorts of animals, presented as means ± SE, n = 9/condition. *P < 0.05 vs. control.
PKC and PKA phosphorylate different sites on UT-A1.
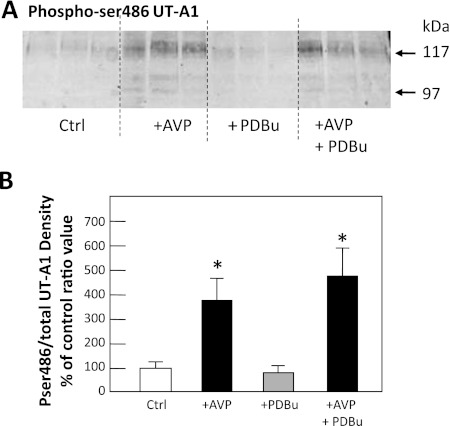
To determine whether PKC phosphorylates the same site on UT-A1 as PKA, rat IMCDs were treated without (control) or with vasopressin, phorbol dibutyrate, or both vasopressin and phorbol dibutyrate for 30 min. We used a Pser486-specific antibody to probe Western blots for this PKA-phosphorylated form of UT-A1 (3). Figure 6A shows Pser486-UT-A1 after 30 min of stimulation of PKA, PKC, or both. Vasopressin significantly increased the abundance of Pser486-UT-A1 by 248 ± 106% over control (100 ± 17%) levels (P < 0.05, n = 6; Fig. 6B). Phorbol dibutyrate treatment alone resulted in no increase (0 ± 20%) over control levels of phosphorylation at ser486 (P = NS, n = 6; Fig. 6B). Vasopressin in combination with phorbol dibutyrate caused a 390 ± 99% increase in the level of phosphorylation at ser486 over control levels (P < 0.05, n = 6; Fig. 6B). The level with vasopressin and phorbol dibutyrate was not statistically different from vasopressin treatment alone (P = NS, n = 6; Fig. 6B).
Fig. 6.
PKC does not phosphorylate UT-A1 at serine 486. Rat IMCD suspensions were treated without (Ctrl) or with 100 nM AVP, 2 μM PDBu, or AVP+PDBu and then immunoprecipitated with anti-UT-A1 and analyzed by Western blot using an antibody specific to UT-A1 phosphorylated at serine 486. A: 3 representative samples per condition. B: ratio of Pser486-UT-A1 to total UT-A1 from all samples presented as means ± SE, n = 6/condition. *P < 0.05 vs. Ctrl. Arrows indicate the 117- and 97-kDa glycoprotein forms of UT-A1. The response to AVP+PDBu was not statistically different from vasopressin alone.
PKC-α phosphorylates UT-A1.
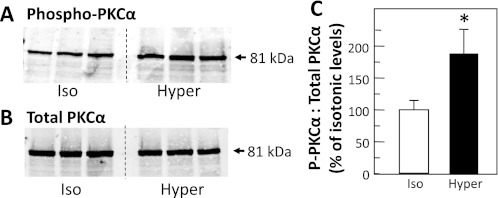
Since the hypertonicity-stimulated increase in urea permeability is calcium dependent (9), we tested whether the PKC isoform involved in the phosphorylation of UT-A1 could be PKC-α. Rat IMCDs were treated with isotonic (290 mosmol/kgH2O) or hypertonic (600 mosmol/kgH2O) buffer for 30 min, and then lysates were assessed by Western blot for the levels of the activated, phosphorylated form of PKC-α, and for total PKC-α. Figure 7, A and B, shows Western blots of phospho-PKC-α and total PKC-α, respectively. Hypertonicity significantly increased the ratio of phospho-PKC-α to total PKC-α by 92 ± 36% (P < 0.05, n = 11; Fig. 7C) over isotonic control levels.
Fig. 7.
PKC-α is phosphorylated by hypertonicity in rat inner medulla. Rat IMCDs were treated with 290-mosmol/kgH2O buffer (iso) or 600-mosmol/kgH2O buffer (hyper) that was made hypertonic by the addition of sucrose. Whole cell lysates were analyzed by Western blot probed for phosphorylated PKC-α (A) or total PKC-α (B). C: bar graph of the ratio of phosphorylated PKC-α to total PKC-α from all samples presented as means ± SE, n = 11/condition. *P < 0.05 vs. Ctrl.
PKC-α-deficient mice produce more dilute urine than wild-type mice.
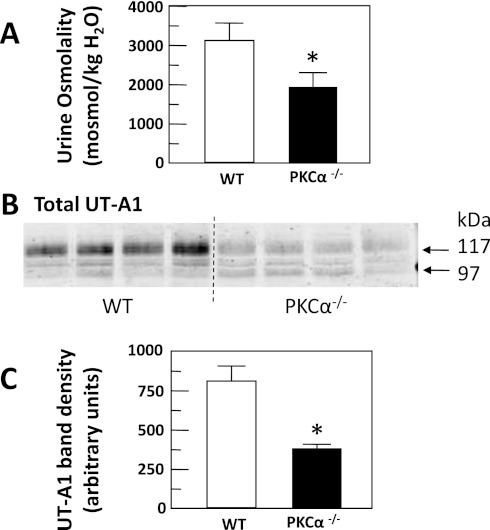
One global PKC-α knockout mouse has a urine-concentrating defect (23). We obtained a different global PKC-α knockout mouse (4) and tested whether it also has a urine-concentrating defect. PKC-α−/− mice were housed in metabolic cages and 24-h urine collections were made. Urine osmolality of PKC-α−/− mice (1,969 ± 255 mosmol/kgH2O) was significantly reduced when compared with wild-type mice (3,185 ± 385 mosmol/kgH2O, P < 0.05, n = 9; Fig. 8A).
Fig. 8.
PKC-α-deficient (PKC-α−/−) mice have dilute urine. A: normal wild-type (WT) and PKC-α−/− mice were placed in metabolic cages and 24-h urines were collected and urine osmolality was measured. The bar graph provides means ± SE, n = 9 animals per mouse type. *P < 0.05. B: Western blot of IM tissue lysate from normal WT and PKC-α−/− mice probed for UT-A1. C: bar graph showing means ± SE values for the combined 97- and 117-kDa band densities for 4 mice per group. *P < 0.05 vs. WT.
UT-A1 is decreased in the PKC-α knockout mouse. Figure 8B shows a representative Western blot of the relative abundance of UT-A1 in wild-type compared with PKC-α−/− mice with the average densities of four mice per type compared in the bar graph (Fig. 8C). There was 51% less UT-A1 in PKC-α−/− compared with wild-type controls.
Hypertonic stimulation of UT-A1 phosphorylation requires PKC-α.
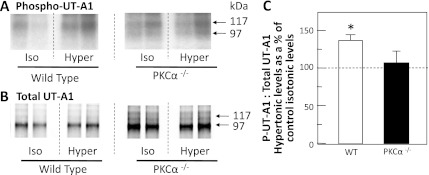
To determine whether hypertonicity could stimulate UT-A1 phosphorylation in the absence of PKC-α, metabolically labeled IMCDs from wild-type or PKC-α−/− mice were incubated with isotonic (290 mosmol/kgH2O) or hypertonic (600 mosmol/kgH2O) buffer for 30 min. Figures 9A shows 32P-UT-A1 from representative wild-type and PKC-α−/− mice, without or with hypertonic stimulation. Figure 9B shows the total UT-A1 protein in the same samples. Hypertonic treatment significantly increased the ratio of phosphorylated UT-A1 to total UT-A1 in wild-type mice by 40 ± 10% (P < 0.05, n = 12; Fig. 9C), similar to the effect observed in rats. In contrast, there was no significant increase in the ratio of phosphorylated UT-A1 to total UT-A1 in the PKC-α−/− mice (17 ± 18%, n = 12; Fig. 9C).
Fig. 9.
Hypertonicity stimulates UT-A1 phosphorylation in WT but not PKC-α−/− mice. IMCDs from WT and PKC-α−/− mice were metabolically labeled with 32P and then incubated with 290-mosmol/kgH2O buffer (iso) or 600-mosmol/kgH2O buffer (hyper). UT-A1 was immunoprecipitated from each sample and analyzed by Western blot and autoradiography. The autoradiograms in A show the phosphorylated UT-A1 levels from representative IMCDs from WT (left) or PKC-α−/− (right) mice. The Western blots in B show total UT-A1 protein levels in the same samples. C: bar graph showing the ratio of phosphorylated UT-A1 to total UT-A1 in hypertonically treated IMCDs as a percent of isotonic control levels (dashed line at 100%) for each mouse type. All data presented as means ± SE, n = 12/condition. *P < 0.05.
DISCUSSION
Our present results show that hypertonicity stimulates UT-A1 phosphorylation and plasma membrane accumulation, consistent with previous findings (1). We extended these findings by showing that these increases are ablated by pretreatment of rat IMCDs with chelerythrine, a general PKC inhibitor. To verify that PKC activation could phosphorylate UT-A1 and to determine whether the PKC-mediated stimulation of UT-A1 phosphorylation required a hypertonic environment, we used phorbol dibutyrate to stimulate PKC directly in IMCDs under isotonic conditions. We saw that UT-A1 phosphorylation is stimulated by phorbol dibutyrate, that is, phorbol dibutyrate mimics the response observed with hypertonicity. PKC, therefore, appears to be capable of stimulating both UT-A1 phosphorylation and plasma membrane accumulation under hypertonic conditions, and thus would be a viable candidate for an additional or alternative kinase to PKA in the regulation of urea transport.
There is ample experimental evidence that vasopressin regulates urea permeability and UT-A1 phosphorylation in IMCDs (reviewed in Ref. 12). Recently, we showed that vasopressin-stimulated urea permeability was further increased by stimulation of PKC (21). In the present study, we found that activating PKC with phorbol dibutyrate alone increased UT-A1 phosphorylation, and in the presence of vasopressin, resulted in a further increase in UT-A1 phosphorylation, which correlates with the functional increase in urea permeability that we found previously (21). Vasopressin, acting through the V2 receptor, stimulates the production of cAMP, which in turn activates PKA to phosphorylate proteins. PKA phosphorylates UT-A1 at serines 486 and 499, and this results in the movement of UT-A1 to the apical plasma membrane (3). Phosphorylation at these sites is required for activation of urea transport in response to vasopressin. We asked whether these sites are promiscuous and able to act as a phosphorylation sites for PKC as well. We used a phosphospecific antibody to identify Pser486-UT-A1 in Western blots of IMCDs that were treated with vasopressin, phorbol dibutyrate, or a combination of both. We found that PKC is not phosphorylating UT-A1 at serine 486. Future studies will be needed to determine the site in UT-A1 that is phosphorylated by PKC.
Since hypertonic stimulation of urea permeability in the IM is dependent on calcium (9) and PKC is involved in the hypertonic stimulation of urea permeability (21), we looked at PKC isoforms that are dependent on calcium. These “conventional” PKC isoforms include PKC-α, β1, βII, and γ, all of which have been documented to be present in the rodent IM (16, 21). From this short list of conventional PKC isoforms, we chose to examine PKC-α first because a global PKC-α knockout mouse has a urine-concentrating defect (23). Activated PKC-α was increased under hypertonic conditions compared with isotonic conditions. Although this does not prove that PKC-α is phosphorylating UT-A1 in response to changes of tonicity, it is consistent with this kinase being involved in the activation of UT-A1 by hypertonicity.
To more specifically address whether PKC-α was needed for UT-A1 phosphorylation by hypertonicity, we used a global PKC-α knockout mouse (4). We confirmed that this mouse has a urine-concentrating defect, consistent with the previous finding in a different global PKC-α knockout mouse (23), and showed that UT-A1 protein abundance is reduced. Hypertonicity increased UT-A1 phosphorylation in wild-type mice, as it does in rats, but was unable to increase UT-A1 phosphorylation in the PKC-α knockout mice.
In summary, the major findings in the present study are that 1) inhibiting PKC prevents the hypertonicity-mediated stimulation of UT-A1 phosphorylation, 2) the hypertonicity-mediated increase in biotinylated UT-A1 was blocked by preincubation with a PKC inhibitor, 3) the hypertonicity-mediated stimulation of UT-A1 phosphorylation can be mimicked by directly activating PKC using a phorbol ester, 4) activation of PKA and PKC results in a greater increase in UT-A1 phosphorylation than PKC stimulation alone, 5) PKC phosphorylates UT-A1 at a site distinct from serine 486, 6) hypertonicity stimulates phospho-PKC-α, and 7) hypertonicity cannot stimulate UT-A1 phosphorylation in a mouse lacking PKC-α. These findings strongly suggest that PKC-α mediates hypertonicity-induced phosphorylation of UT-A1, which may contribute to stimulated urea transport in the IMCD.
GRANTS
This work was supported by National Institutes of Health Grants R01-DK89828 and R01-DK41707.
DISCLOSURES
No conflicts of interest, financial or otherwise, are declared by the author(s).
AUTHOR CONTRIBUTIONS
Author contributions: J.D.K. and J.M.S. conception and design of research; J.D.K., C.F.M., and K.J.K. performed experiments; J.D.K., C.F.M., K.J.K., and J.M.S. analyzed data; J.D.K. and J.M.S. interpreted results of experiments; J.D.K. and C.F.M. prepared figures; J.D.K., K.J.K., and J.M.S. drafted manuscript; J.D.K. and J.M.S. edited and revised manuscript; J.D.K. and J.M.S. approved final version of manuscript.
REFERENCES
- 1. Blessing NW, Blount MA, Sands JM, Martin CF, Klein JD. Urea transporters UT-A1 and UT-A3 accumulate in the plasma membrane in response to increased hypertonicity. Am J Physiol Renal Physiol 295: F1336–F1341, 2008 [DOI] [PMC free article] [PubMed] [Google Scholar]
- 2. Blount MA, Klein JD, Martin CF, Tchapyjnikov D, Sands JM. Forskolin stimulates phosphorylation and membrane accumulation of UT-A3. Am J Physiol Renal Physiol 293: F1308–F1313, 2007 [DOI] [PubMed] [Google Scholar]
- 3. Blount MA, Mistry AC, Fröhlich O, Price SR, Chen G, Sands JM, Klein JD. Phosphorylation of UT-A1 urea transporter at serines 486 and 499 is important for vasopressin-regulated activity and membrane accumulation. Am J Physiol Renal Physiol 295: F295–F299, 2008 [DOI] [PMC free article] [PubMed] [Google Scholar]
- 4. Braz JC, Gregory K, Pathak A, Zhao W, Sahin B, Klevitsky R, Kimball TF, Lorenz JN, Nairn AC, Liggett SB, Bodi I, Wang S, Schwartz A, Lakatta EG, DePaoli-Roach AA, Robbins J, Hewett TE, Bibb JA, Westfall MV, Kranias EG, Molkentin JD. PKC-a regulates cardiac contractility and propensity toward heart failure. Nat Med 10: 248–254, 2004 [DOI] [PubMed] [Google Scholar]
- 5. Chen G, Huang H, Fröhlich O, Yang Y, Klein JD, Price SR, Sands JM. MDM2 E3 ubiquitin ligase mediates UT-A1 urea transporter ubiquitination and degradation. Am J Physiol Renal Physiol 295: F1528–F1534, 2008 [DOI] [PMC free article] [PubMed] [Google Scholar]
- 6. Fenton RA, Chou CL, Stewart GS, Smith CP, Knepper MA. Urinary concentrating defect in mice with selective deletion of phloretin-sensitive urea transporters in the renal collecting duct. Proc Natl Acad Sci USA 101: 7469–7474, 2004 [DOI] [PMC free article] [PubMed] [Google Scholar]
- 7. Fenton RA, Knepper MA. Mouse models and the urinary concentrating mechanism in the new millennium. Physiol Rev 87: 1083–1112, 2007 [DOI] [PubMed] [Google Scholar]
- 8. Gillin AG, Sands JM. Characteristics of osmolarity-stimulated urea transport in rat IMCD. Am J Physiol Renal Fluid Electrolyte Physiol 262: F1061–F1067, 1992 [DOI] [PubMed] [Google Scholar]
- 9. Gillin AG, Star RA, Sands JM. Osmolarity-stimulated urea transport in rat terminal IMCD: role of intracellular calcium. Am J Physiol Renal Fluid Electrolyte Physiol 265: F272–F277, 1993 [DOI] [PubMed] [Google Scholar]
- 10. Kato A, Klein JD, Zhang C, Sands JM. Angiotensin II increases vasopressin-stimulated facilitated urea permeability in rat terminal IMCDs. Am J Physiol Renal Physiol 279: F835–F840, 2000 [DOI] [PubMed] [Google Scholar]
- 11. Klein JD, Blount MA, Fröhlich O, Denson C, Tan X, Sim J, Martin CF, Sands JM. Phosphorylation of UT-A1 on serine 486 correlates with membrane accumulation and urea transport activity in both rat IMCDs and cultured cells. Am J Physiol Renal Physiol 298: F935–F940, 2010 [DOI] [PMC free article] [PubMed] [Google Scholar]
- 12. Klein JD, Blount MA, Sands JM. Urea transport in the kidney. Comp Physiol 1: 699–729, 2011 [DOI] [PubMed] [Google Scholar]
- 13. Klein JD, Fröhlich O, Blount MA, Martin CF, Smith TD, Sands JM. Vasopressin increases plasma membrane accumulation of urea transporter UT-A1 in rat inner medullary collecting ducts. J Am Soc Nephrol 17: 2680–2686, 2006 [DOI] [PubMed] [Google Scholar]
- 14. Klein JD, Price SR, Bailey JL, Jacobs JD, Sands JM. Glucocorticoids mediate a decrease in the AVP-regulated urea transporter in diabetic rat inner medulla. Am J Physiol Renal Physiol 273: F949–F953, 1997 [DOI] [PubMed] [Google Scholar]
- 15. Kokko JP, Rector FC. Countercurrent multiplication system without active transport in inner medulla. Kidney Int 2: 214–223, 1972 [DOI] [PubMed] [Google Scholar]
- 16. Redling S, Pfaff IL, Leitges M, Vallon V. Immunolocalization of protein kinase C isozymes a, bI, bII, d and e in mouse kidney. Am J Physiol Renal Physiol 287: F289–F298, 2004 [DOI] [PubMed] [Google Scholar]
- 17. Sands JM, Layton HE. The physiology of urinary concentration: an update. Semin Nephrol 29: 178–195, 2009 [DOI] [PMC free article] [PubMed] [Google Scholar]
- 18. Sands JM, Schrader DC. An independent effect of osmolality on urea transport in rat terminal IMCDs. J Clin Invest 88: 137–142, 1991 [DOI] [PMC free article] [PubMed] [Google Scholar]
- 19. Snedecor GW, Cochran WG. Statistical Methods. Ames, IA: Iowa State Univ., 1980 [Google Scholar]
- 20. Stephenson JL. Concentration of urine in a central core model of the renal counterflow system. Kidney Int 2: 85–94, 1972 [DOI] [PubMed] [Google Scholar]
- 21. Wang Y, Liedtke CM, Klein JD, Sands JM. Protein kinase C regulates urea permeability in the rat inner medullary collecting duct. Am J Physiol Renal Physiol 299: F1401–F1406, 2010 [DOI] [PMC free article] [PubMed] [Google Scholar]
- 22. Yao LJ, Wang JQ, Zhao H, Liu JS, Deng AG. Effect of telmisartan on expression of protein kinase C-a in kidneys of diabetic mice. Acta Pharmacol Sin 28: 829–838, 2007 [DOI] [PubMed] [Google Scholar]
- 23. Yao LJ, Huang DY, Pfaff IL, Nie X, Leitges M, Vallon V. Evidence for a role of protein kinase C-alpha in urine concentration. Am J Physiol Renal Physiol 287: F299–F304, 2004 [DOI] [PubMed] [Google Scholar]
- 24. Zhang C, Sands JM, Klein JD. Vasopressin rapidly increases the phosphorylation of the UT-A1 urea transporter activity in rat IMCDs through PKA. Am J Physiol Renal Physiol 282: F85–F90, 2002 [DOI] [PubMed] [Google Scholar]


