Abstract
RP105–MD-1 modulates the TLR4–MD-2-mediated, innate immune response against bacterial lipopolysaccharide (LPS). The crystal structure of the bovine 1:1 RP105–MD-1 complex bound to a putative endogenous lipid at 2.9 Å resolution shares a similar overall architecture to its homologue TLR4–MD-2, but assembles into an unusual 2:2 homodimer which differs from any other known TLR-ligand assembly. The homodimer is assembled in a head-to-head orientation that juxtaposes the N-terminal leucine-rich repeats (LRRs) of the two RP105 chains, rather than the usual tail-to-tail configuration of C-terminal LRRs in ligand-activated TLR dimers, such as TLR1–2, 3 and 4. Another novel interaction is mediated by an RP105-specific Asn-linked glycan, which wedges MD-1 into the co-receptor binding concavity on RP105. This unique mode of assembly in RP105–MD-1 represents a new paradigm for TLR complexes and suggests a potential molecular mechanism for regulating LPS responses.
INTRODUCTION
Innate immunity plays a critical role in immediately sensing pathogens and subsequently priming adaptive immunity1–2. Innate immune responses are initiated by detecting common molecular features of microbial pathogens through pattern recognition receptors including Toll-like receptors (TLRs), Nod-like receptors, and RIG-I-like receptors3–4. TLRs consist of an extracellular, soluble domain (sTLR), a single-pass transmembrane domain, and an intracellular signaling Toll–IL-1R (TIR) domain. The sTLR folds into a horseshoe-like structure with 20–26 leucine-rich repeat (LRR) modules, and is responsible for binding a specific ligand5–9. However, TLR–ligand binding by itself is not sufficient for signaling. Structural analyses of ligand-bound TLR complexes have suggested that for TLR activation, ligand binding should induce TLR dimerization in a tail-to-tail mode that juxtaposes their C-terminal regions in the center of the signaling complex6,8,10–11. As a result, the intracellular TIR domains are brought into close proximity for downstream signaling.
Among TLR family members, TLR4 is unique in requiring a tightly associated adaptor molecule, MD-2, to recognize bacterial lipopolysaccharide (LPS) on the cell surface5,12–14. sTLR4 forms a heterodimeric complex with MD-2 in its unliganded basal state5. MD-2 houses a large hydrophobic cavity, which provides the major LPS binding site10,15. LPS binding to MD-2 induces homodimerization of the 1:1 TLR4-MD-2 complex in a tail-to-tail orientation of two TLR4 chains10. In contrast, Eritoran, an antagonist ligand, binds to the MD-2 cavity, but fails to trigger TLR4–MD-2 homodimerization and subsequent signaling5,16.
RP105 (radioprotective 105, CD180) is a TLR-like, cell surface molecule that is evolutionarily closely related to TLR417–20. RP105 contains an extracellular LRR domain (sRP105) and transmembrane domain that share ~30% sequence identity with TLR4. The sRP105 associates with MD-1, an MD-2 homologue (~20% sequence identity), which promotes RP105 cell surface expression21–23. Unlike TLR4, RP105 contains only ~10 intracellular residues and lacks the canonical TIR signaling domain, suggesting that RP105–MD-1 by itself cannot transmit an extracellular signal into cells.
RP105–MD-1 exerts dichotomous regulatory activities on TLR4-mediated LPS responses depending on cell type. RP105-deficient B cells exhibit impairment in LPS responses such as cell proliferation and IgM and IgG3 antibody production24–25, suggesting that RP105–MD-1 is a B cell stimulator, although its stimulatory mechanism in B cells is largely unknown. In contrast, in antigen presenting cells including dendritic cells and macrophages, RP105–MD-1 downregulates LPS responses through a direct interaction with TLR4–MD-220,26–27. In addition, RP105–MD-1 can enhance TLR2 activity against Mycobacterium tuberculosis lipoproteins via TLR2 interaction in macrophages28. Thus, RP105–MD-1 appears to fine-tune the ligand-induced activities of TLRs as a regulatory complex rather than by directly initiating a signal by itself.
Given that RP105–MD-1 is homologous to TLR4–MD-2, it has been generally assumed that RP105–MD-1 would adopt a similar complex structure to TLR4–MD-2. However, as the RP105 structure was not known or the structural basis for RP105–MD-1 association, the molecular mechanism for RP105–MD-1 regulation of the TLR4–MD-2 activity could not be addressed. Thus, we determined the crystal structure of the bovine sRP105–MD-1 complex to 2.91 Å resolution. Unexpectedly, the structure reveals that sRP105–MD-1 forms a novel tetrameric complex of two sRP105 and two MD-1 molecules. Despite an identical molecular stoichiometry (2:2) to that of the LPS-activated sTLR4–MD-2 complex, sRP105–MD-1 uses distinctively different binding interfaces for complex formation. As a result, sRP105 and MD-1 are organized in a unique mode that positions the N-terminal LRR modules of two sRP105 chains in the center of the complex, together with two MD-1 molecules. This head-to-head arrangement of RP105 contrasts with the tail-to-tail mode that is highly conserved in ligand-activated TLR homo- and heterodimers6,8,10–11. The unique organization of this sRP105–MD-1 complex allows us to propose a mechanism for how the TLR4 response to LPS is regulated. Furthermore, the sRP105–MD-1 structure reveals that an RP105-specific, Asn-linked glycan provides an additional extensive site of interaction that is not present in the TLR4–MD-2 complex and represents an uncommon use of glycans in protein-protein interfaces.
RESULTS
Overall architecture of the 2:2 sRP105–MD-1 complex
sRP105 and MD-1 were co-expressed in insect cells by a baculovirus expression system and purified as a stable complex. Gel filtration analysis demonstrated that purified human, mouse, and bovine sRP105–MD-1 complexes elute at a size larger than for the unliganded 1:1 sTLR4–MD-2 complex, but similar to the LPS-activated 2:2 sTLR4–MD-2 complex (Supplementary Fig. 1a), suggesting a 2:2 stoichiometry.
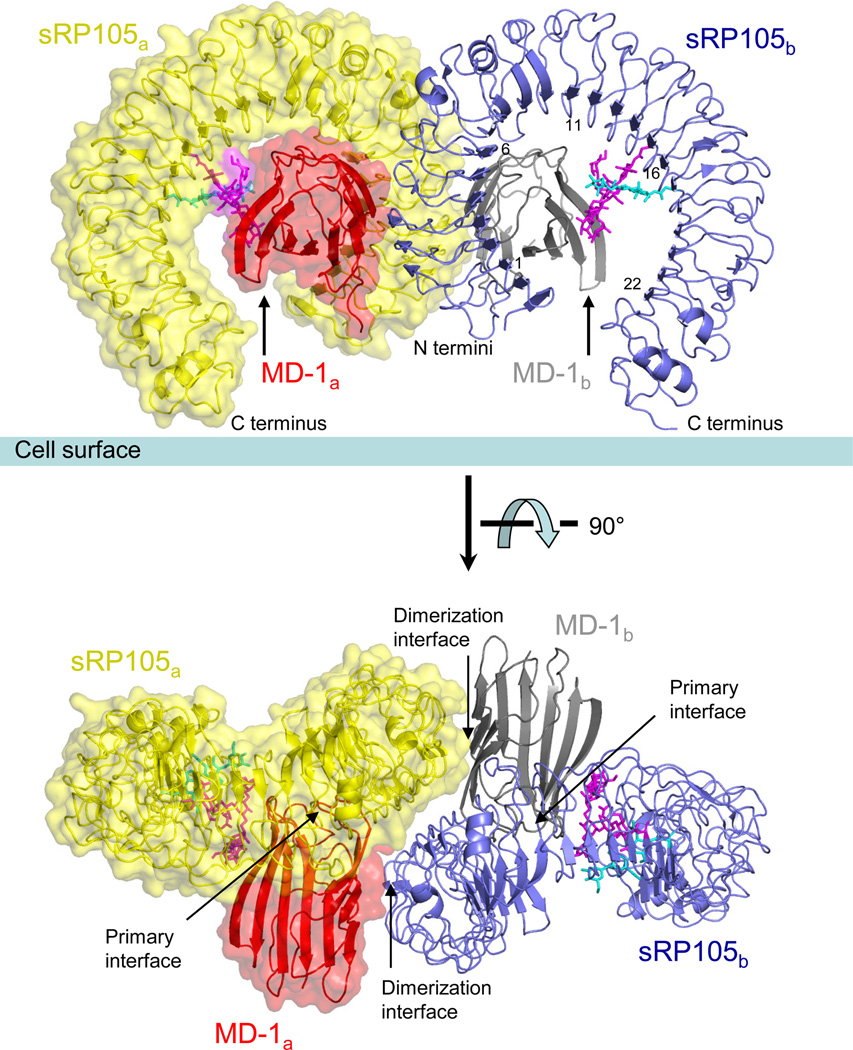
The crystal structure of the bovine sRP105–MD-1 (residues 24–626 and 22–159, respectively) complex was determined at 2.91 Å resolution (Fig. 1 and Supplementary Figs. 1b and 1c). The structure unambiguously reveals that the complex is assembled from two sRP105 and two MD-1 molecules in an inverted ‘ω’ shape (Fig. 1). sRP105 and MD-1 adopt horseshoe and β-cup like shapes, similar to sTLR4 and MD-2, respectively (Fig. 2)5,15. The sRP105–MD-1 complex consists of two copies of the 1:1 building block (sRP105a–MD-1a or sRP105b–MD-1b in Fig. 1), each of which resembles the unliganded 1:1 sTLR4–MD-2 complex in overall architecture5, but the assembly of the 2:2 tetramer distinguishes it from other agonist-activated TLR complexes (see below). In the 2:2 sRP105–MD-1 complex, two sRP105 molecules are arranged in a head-to-head orientation, that places their N-terminal regions in the center of the complex, while simultaneously interacting with two MD-1 molecules (Fig. 1). Such a unique organization of sRP105 and MD-1 in the complex was further confirmed by a 3.1 Å structure of a complex between MD-1 and an LRR hybrid of sRP105 (residues 24–521) fused with variable lymphocyte receptor (VLR) B.61 (residues 125–200) (Table 1).
Figure 1.
Overall architecture of the 2:2 sRP105–MD-1 complex. The 1:1 sRP105–MD-1 building block that corresponds to unliganded 1:1 sTLR4–MD-2 complex is designated by sRP105a–MD-1a (yellow–red, solid surface with underlying ribbon representation) or (blue–gray, ribbon only). The 1:1 complex formation is driven by the primary binding interface between RP105 and MD-1. Two copies of the 1:1 complex associate in a symmetrical manner in a head-to-head mode through a unique dimerization interface that stabilizes the 2:2 complex. RP105 Asn402- and Asn451-linked glycans that are well ordered in the sRP105a–MD-1a or sRP105b–MD-1b interface region are shown in magenta and cyan stick models, respectively. Two views are shown parallel to the cell surface and from the top looking down onto the cell surface.
Figure 2.
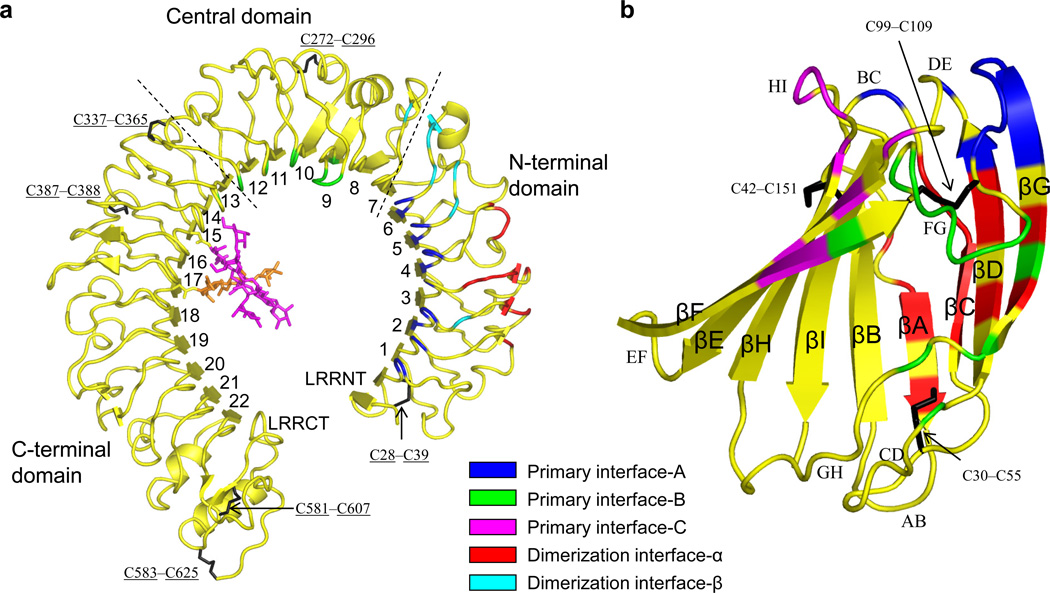
sRP105 and MD-1 structures as observed in the 2:2 complex. (a,b) The sRP105 (a) and MD-1 (b) structures are represented by yellow ribbon diagrams and the components of the structure that form each binding interface are colored as indicated in the figure. The Asn-linked glycan at sRP105 Asn402, which is involved in primary interface-C, is shown in magenta sticks and the nearby glycan at Asn451 is in orange. Disulfide bonds are shown in black sticks. sRP105 is divided into three subdomains as indicated by dashed lines that correspond to those designated previously in TLR4 as the N-terminal, central and C-terminal domains10.
Table 1.
Data collection and refinement statistics
| sRP105-VLR–MD-1 | sRP105–MD-1 | |
|---|---|---|
| Data collection | ||
| Space group | P212121 | P1 |
| Cell dimensions | ||
| a, b, c (Å) | 89.58, 137.52, 141.67 | 101.51, 141.58, 141.95 |
| α, β, γ (°) | 90.00, 90.00, 90.00 | 94.00, 91.66, 91.37 |
| Resolution (Å) | 20.00-3.10 (3.21-3.10) | 20.00-2.91 (3.00-2.91) |
| Rsym | 9.0 (80.3) | 6.3 (45.7) |
| I / σI | 34.3 (2.8) | 18.2 (1.8) |
| Completeness (%) | 98.9 (93.1) | 93.5 (73.0) |
| Redundancy | 8.1 (7.1) | 2.1 (1.9) |
| Refinement | ||
| Resolution (Å) | 20.00 - 2.91 | |
| No. reflections | 152,067 | |
| Rwork / Rfree | 23.8 / 27.6 | |
| No. atoms | ||
| Protein | 42,570 | |
| Carbohydrate | 1,064 | |
| Pseudoligand | 124 | |
| Water | 37 | |
| B-factors | ||
| Protein | 76.4 | |
| Carbohydrate | 49.4 | |
| Pseudoligand | 81.9 | |
| Water | 42.9 | |
| R.m.s. deviations | ||
| Bond lengths (Å) | 0.013 | |
| Bond angles (°) | 1.43 |
Values in parentheses are for highest-resolution shell. Data for the sRP105–MD-1 structure were collected from a single crystal.
Structure of sRP105
sRP105 folds into a typical horseshoe-like structure with the central LRR core (LRR modules 1–22) shielded by N-terminal (LRRNT) and C-terminal (LRRCT) LRR caps (Fig. 2a and Supplementary Fig. 2a)5,7,9. sRP105 is divided into three subdomains, namely N-terminal (LRRNT and LRR1–6), central (LRR7–12), and C-terminal (LRR13–22 and LRRCT) (Fig. 2a), as described for sTLR4, although sRP105 exhibits less obvious structural transitions at inter-domain boundaries compared to sTLR45. On the concave face of the horseshoe-like sRP105 structure, a continuous β-sheet is formed by 22 parallel β-strands of the LRR core as well as two antiparallel β-strands of the LRRNT β-hairpin. By comparison, the convex surface is irregularly decorated with various secondary structures including α-helices, 310-helices, and short β-strands. The sRP105 contains six disulfide bonds, five of which are conserved with sTLR4. The remaining disulfide between Cys337 and Cys365 is specific to sRP105 (RP105 residues are underlined throughout to distinguish from MD-1), and links LRR12 and LRR13 loops that are three residues longer than those of sTLR4, thereby potentially stabilizing otherwise mobile loops.
sRP105 adopts a more circular and flat profile than sTLR4 (Supplementary Fig. 2b). The curvature in sRP105 is more pronounced for its C-terminal LRR modules presumably due to the presence of an α-helix in the LRR21 convex face (Fig. 2a and Supplementary Fig. 2b, left) that is wider than the extended chain or 310-helix segments located in the corresponding region of TLR429–31. As a result, sRP105 displays a more closed circular shape [LRR1–LRR22 distance: sRP105, 31 Å; human sTLR4, 43 Å; mouse sTLR4, 38 Å) (Supplementary Fig. 2b, left). From the side profile, sRP105 is more or less flat, whereas sTLR4 is severely twisted in its N-terminal domain, which leads to ~19° and ~8° deviations of sRP105, compared to mouse and human sTLR4, respectively, when their N-terminal domains are superimposed (Supplementary Fig. 2b, right).
Structure of MD-1
As observed in previous MD-1 structures (MD-1free) in the absence of RP105 [chicken MD-1free (cMD-1free) and mouse MD-1free (mMD-1free)]32–33, sRP105-bound MD-1 (MD-1sRP105) adopts a β-cup like structure that consists of two antiparallel β-sheets (β-strands C, D, G and β-strands A, B, I, H, E, F), and contains three disulfide bonds (Cys30–Cys55, Cys42–Cys151, Cys99–Cys109) that stabilize the β-cup like structure (Fig. 2b and Supplementary Fig. 2c)32–33. The MD-1 loops are designated by their connecting β-strands (e.g. the AB loop connects β-strands A and B). MD-1sRP105 also houses a large hydrophobic cavity between its two β-sheets that is mainly lined with hydrophobic residues, although four polar residues (Lys105, Asn124, Asn125, Glu129) are positioned at the cavity entrance (Supplementary Fig. 2d). The MD-1sRP105 cavity contains additional electron density that was modeled as two connected acyl chains of an endogenous pseudoligand that was presumably acquired during protein expression (Supplementary Fig. 2d). Likewise, MD-1free also contains an endogenous ligand, potentially a diacylated phospholipid molecule32–33. These observations indicate that MD-1 has affinity for lipid ligands irrespective of whether RP105 is bound. Despite the expected overall structural conservation between MD-1free and MD-1sRP105, substantial differences are found in the conformation and flexibility of the FG and GH loops at the cavity entrance (Supplementary Fig. 2e), suggesting some dynamic behavior dependent on the state of ligation, whether with RP105 or lipid32–33.
Primary binding interfaces-A and B
sRP105–MD-1 assembly can be described as containing primary binding and dimerization interfaces (Fig. 1). sRP105 and MD-1 form the 1:1 complex via the primary interface, and homodimerize to a 2:2 complex using the dimerization interface. For the primary interaction, the concave surface of sRP105 wraps around one end of MD-1, mainly at βF, loop FG, βG, and loop HI (Figs. 2 and 3a). The primary interaction buries ~1290 Å2 of accessible surface area on each component and is segregated into three discontinuous regions corresponding to primary binding interfaces-A, B, and C (Fig. 3 and Supplementary Fig. 3a). Primary interfaces-A and B involve protein-only contacts of the sRP105 N-terminal and central domains, respectively, with MD-1 (Fig. 2a) and these contact regions are mostly conserved in TLR4–MD-2. However, primary interface-C is created by an Asn-linked glycan on the concave face of the sRP105 C-terminal domain and is unique to the RP105–MD-1 interaction (Fig. 2a).
Figure 3.
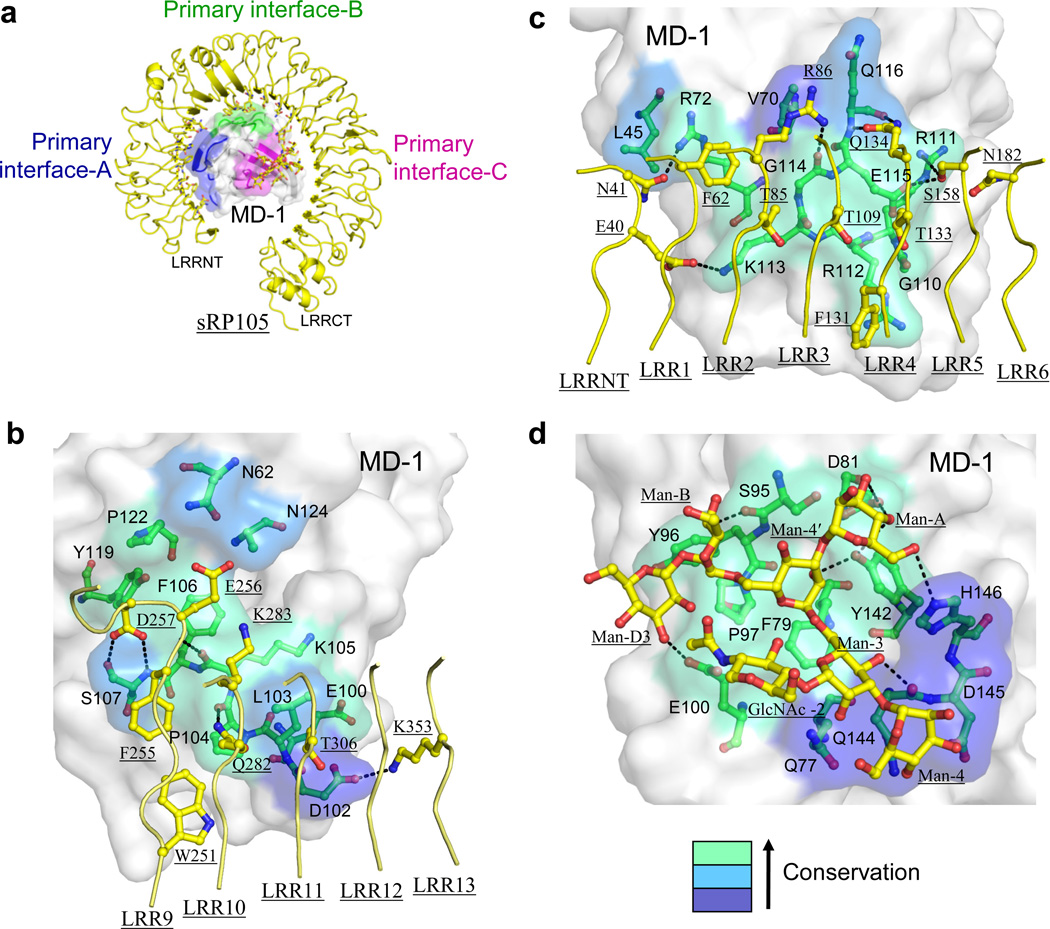
The sRP105–MD-1 primary interaction. (a) Overall view of the 1:1 sRP105–MD-1 complex. The 1:1 complex is represented by a ribbon diagram (sRP105, yellow; MD-1, gray) and primary interfaces-A, B, and C are colored in blue, green, and magenta, respectively, on the MD-1 surface. sRP105 primary interface residues are shown in stick models (carbon, yellow; oxygen, red; nitrogen, blue). (b–d) Close-up view of primary interfaces-A (b), B (c), and C (d). Interfaces-A and B correspond to A patch and B patch, respectively, as designated in TLR4–MD-25. MD-1 and sRP105 residues in the primary interface are shown in green and yellow ball-and-stick models, respectively, with oxygens in red and nitrogens in blue. The MD-1 interface is color-coded on a surface representation according to sequence conservation among ten MD-1 orthologs from light green (most conserved) to dark blue (less conserved). Broken dotted lines represent H-bonds or salt bridges.
In primary interface-A, 15 residues on the sRP105 N-terminal domain bury ~500 Å2 of accessible surface area through contact with 10 MD-1 residues (Fig. 3b and Supplementary Fig. 3a). A set of highly conserved MD-1 residues from loop FG (Arg111, Arg112, Lys113, Gly114, Glu115), βG (Gln116), and loop DE (Arg72) make extensive contacts with sRP105 residues scattered throughout the concave side of LRRNT and LRR1–6. The interaction is mainly polar including 6 H-bonds and 1 salt bridge, but also van der Waals contacts between three spatially adjacent sRP105 threonine residues (Thr85, Thr109, Thr133) and three successive MD-1 residues (Lys113, Gly114, Glu115).
Primary interface-B is formed by interaction between 10 residues on sRP105 LRR9–13 and 11 MD-1 residues mainly from βF, loop FG and βG, burying ~410 Å2 of accessible surface area on each side (Fig. 3c and Supplementary Fig. 3a). The major interaction occurs between a protruding loop of LRR9 and 8 MD-1 residues where three LRR9 residues (Phe255, Glu256, Asp257) contribute to ~60% of the buried surface area and form three H-bonds to MD-1 Lys105 (carbonyl) and Ser107 (amide and hydroxyl).
The primary interfaces-A and B of sRP105–MD-1 involve similar protein surfaces or residues as in sTLR4–MD-2 (Supplementary Fig. 3b)5,10, but several structural features are distinguishable. First, the charge complementarity observed in the primary sTLR4–MD-2 interaction is less pronounced in sRP105–MD-1 (Supplementary Fig. 3c). In primary interface-A of mouse sTLR4–MD-2, Arg68 makes a salt bridge with Asp41, and Lys109 makes ionic interactions with Asp59 and Asp83 (MD-2 residues are in italics and TLR4 residues are italicized and underlined). In sTLR4–MD-2 primary interface-B, three acidic MD-2 residues (Asp99, Asp100, Asp101) are surrounded by four basic sTLR4 residues (Arg233, Lys263, Arg288, Arg337), with an additional salt bridge between Arg106 and Asp208. These extensive interactions suggest that charge complementarity is a major contributor to the sTLR4–MD-2 interaction. However, in the sRP105–MD-1 interface, only two salt bridges (Glu40–Lys113, Lys353–Asp102) are found. Moreover, Asp102 of bovine MD-1 corresponds to Ala105 in human MD-1 that cannot form the salt bridge (Supplementary Fig. 2c). Secondly, the total buried surface area of primary interfaces-A and B in sRP105–MD-1 (1810 Å2) is smaller than in mouse (2280 Å2) or human (2030 Å2) sTLR4–MD-2 due to lack of interactions of sRP105 LRR7–8 with MD-1 (Supplementary Fig. 3a, bottom). Thirdly, sRP105–MD-1’s hydrophilic interactions (12 H-bonds) are fewer than in mouse (18) and human (24) sTLR4–MD-2 (Supplementary Fig. 3b). Thus, these observations suggest that the contribution of protein-protein interactions from interfaces-A and B to the overall interface in sRP105–MD-1 is less than in TLR4–MD-2.
To define the structural basis for binding specificity of RP105 for MD-1 and TLR4 for MD-2, primary interfaces of both complexes were carefully analyzed. In the sTLR4–MD-2 structure, the negatively charged Asp101 in MD-2 forms an ionic interaction with the positively charged Lys263 in mouse sTLR4 or Arg264 in human sTLR4 (Supplementary Figs. 2a, 2c, and 3c, right). In sRP105–MD-1, the electrostatic charge pattern is opposite with MD-1 contributing a positively charged Lys105 and sRP105 providing the acidic residue, Glu256 (Supplementary Figs. 2a and 2c), suggesting that a charge-charge repulsion may disfavor complex formation between RP105 and MD-2, and TLR4 and MD-1. Furthermore, steric complementarity also rules out possibilities for such cross-reactivity as severe steric clashes are observed between sRP105 LRR9–10 and the rigid MD-2 loop FG at and around a 310 helix when MD-2 is superimposed onto the RP105–MD-1 structure,
The unique primary binding interface-C
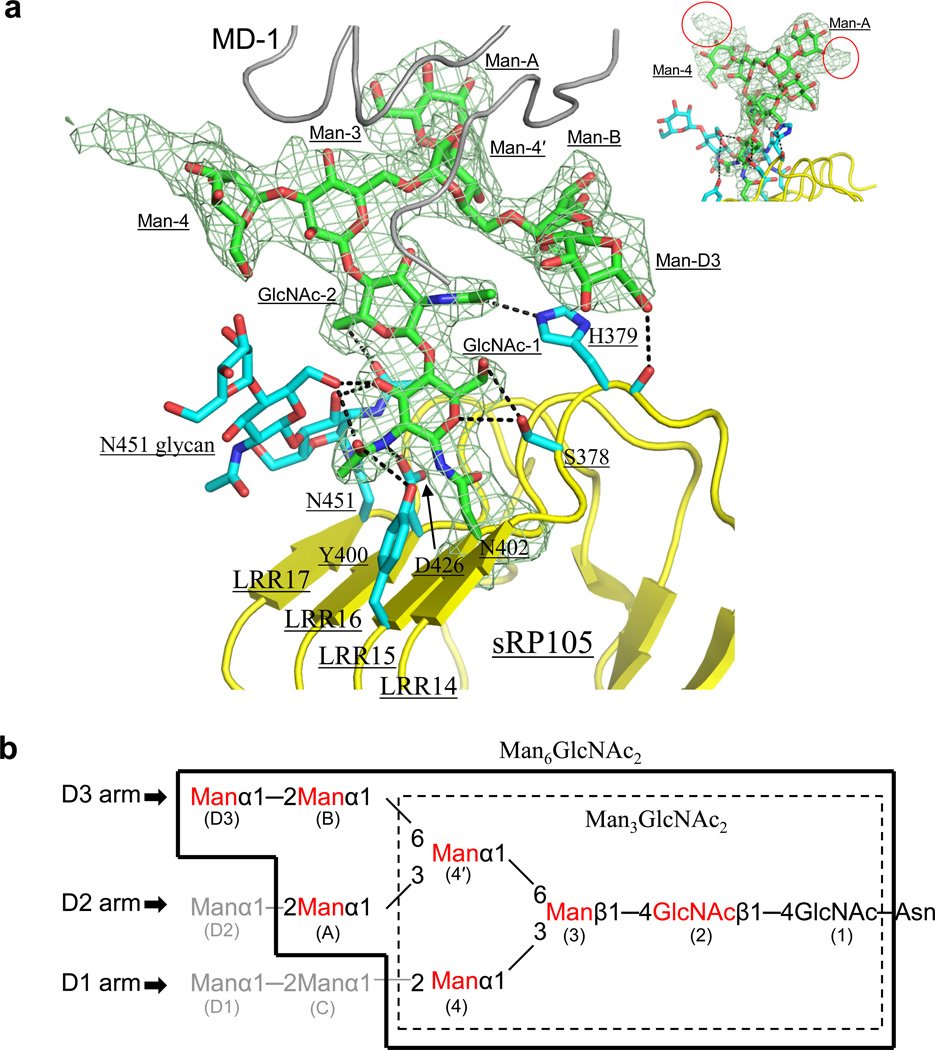
In the 1:1 sRP105–MD-1 structure, a tri-antennary glycan, which is N-linked to RP105 Asn402 at LRR15 on the concave surface (Supplementary Fig. 2a), makes extensive interactions with MD-1, creating primary interface-C (Figs. 1, 3d and 4a). When glycoproteins, such as sRP105–MD-1, are expressed in insect cells, Asn-linked glycans are processed from Glc3Man9GlcNAc2 tetradecasaccharide, via Man9GlcNAc2 and Man5GlcNAc2, to fucosylated or nonfucosylated Man3GlcNAc2 pentasaccharides34–35 (Fig. 4b). However, the RP105 Asn402-linked glycan displays unequivocal electron density for a tri-antennary high mannose glycan (D1, D2, D3 arms) that is occasionally observed in insect cell glycoproteins, and has been modeled as Man6GlcNAc2 (Fig. 4)35. Additional weak residual electron density beyond terminal Man-A and -4 sugars suggests that the actual glycan attached to Asn402 is Man8–9GlcNAc2 (Fig. 4a).
Figure 4.
sRP105-specific glycan at Asn402. (a) Asn402-linked glycan (green sticks) is stabilized by interactions with neighboring sRP105 protein residues, as well as with Asn451-linked glycan (cyan sticks). H-bonds are represented by broken lines. Electron density for the Asn402-linked glycan is shown in a pale green mesh at a 1.0 σ level in a 2Fo-Fc map. The sRP105 and MD-1 Cα traces are colored in yellow and gray, respectively. Residual electron density observed beyond Man-A and Man-4 sugars of glycan at Asn402 are circled in red in the inset (top right) and suggest that the glycan is Man89GlcNAc2. (b) Schematic diagram of an Asn-linked high mannose glycan, Man9GlcNAc2. The most frequently found Asn-linked glycan in insect cells, Man3GlcNAc2, is boxed in dashed lines. Asn402-linked glycan (Man6GlcNAc2) that was built in the sRP105 structure is enclosed by thick lines. Glycan residues that make contacts with MD-1 are colored in red. The standard nomenclature of each sugar moiety is shown in parenthesis.
Although Asn-linked glycans are usually highly flexible, this sRP105 glycan is well ordered (average B-value ~49 Å2) through extensive polar interactions with surrounding sRP105–MD-1 protein residues (~53 Å2) and another neighboring glycan (~51 Å2) (Figs. 3d and 4a). The two core GlcNAc moieties H-bond with the RP105 glycan at Asn451, as well as with Ser378, His379, Tyr400, and Asp426 side chains. The terminal Man (D3) on the D3 arm H-bonds to His379 main-chain carbonyl (Fig. 4a). These interactions help orient the glycan toward MD-1, which further stabilizes the glycan conformation.
In primary interface-C, seven sugars (GlcNAc-2 and Man-3, 4, 4′, A, B, D3) interact with 11 residues from MD-1 β-strands E, F, H and loops DE, HI. The interaction involves 8 H-bonds and buries ~370 Å2 of MD-1 surface area, which is comparable to primary interface-A or B (Fig. 3d). The glycan-interacting residues on MD-1 are largely conserved (Fig. 3d and Supplementary Fig. 2c). Furthermore, the Asn402 glycosylation site and stabilizing residues, including Ser378, His379, Asp426, and Asn451, are completely conserved among RP105 orthologs (Supplementary Fig. 2a).
The glycan-mediated protein-protein interaction is specific to RP105–MD-1 as no glycans are found in the sTLR4–MD-2 interface and the residue corresponding to sRP105 Asn402 is aspartate in all known mammalian TLR4 orthologs (Supplementary Fig. 2a). The only other example of glycan involvement in TLR interactions is found in TLR3 where the glycan at Asn413, modeled as Man3GlcNAc2, contacts the ribose backbone of its dsRNA ligand, but only one terminal Man is involved that buries ~70 Å2 of dsRNA surface area (Supplementary Fig. 4a).
The dimerization binding interface
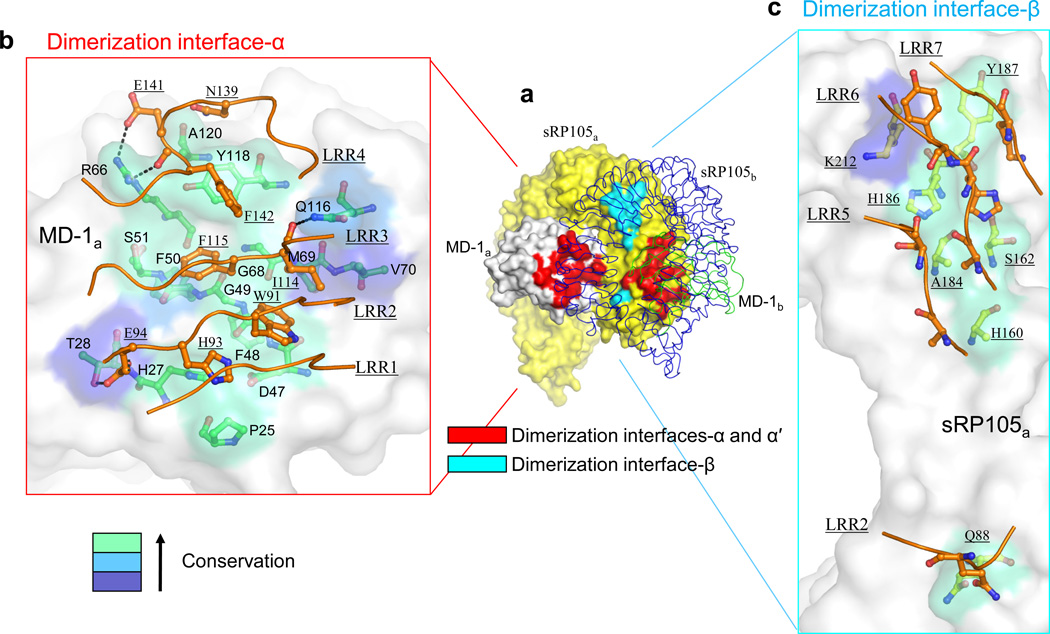
The dimerization interface is involved in assembly of two copies of the 1:1 sRP105–MD-1 complex (sRP105a–MD-1a and sRP105b–MD-1b) into the 2:2 complex through non-crystallographic, two-fold symmetry between the two 1:1 complexes (Fig. 1). This homodimerization interface contains three separate interaction surfaces: sRP105a–MD-1b interface-α, its two-fold related sRP105b–MD-1a interface-α′, and a minor contribution from sRP105a–sRP105b interface-β (Fig. 5a). This dimerization interface is composed from 19 highly conserved residues from sRP105 and 15 from MD-1, with ~1230 Å2 of total buried surface area (Supplementary Fig. 5a and 5b).
Figure 5.
The unique sRP105–MD-1 homodimerization interaction for assembly of the 2:2 complex. (a) Overall view of the 2:2 sRP105–MD-1 complex. 1:1 sRP105a–MD-1a and sRP105b–MD-1b complexes are shown in a surface representation (yellow sRP105a, gray MD-1a) and in thin coils (blue sRP105b, green MD-1b), respectively. The dimerization interface is colored in red (interfaces-α and -α′) and cyan (interface-β) on the surface representation sRP105a–MD-1a. (b) Close-up view of dimerization interface-α. MD-1a and sRP105b residues in the dimerization interface-α are shown with green and orange carbons (red oxygens, blue nitrogens) in ball-and-stick models, respectively. The MD-1a interface is color-coded on the surface representation by sequence conservation as Fig. 3. Broken dotted lines represent H-bonds or salt bridges. (c) Close-up view of dimerization interface-β. The sRP105a and sRP105b residues in the dimerization interface-β are shown in green and orange ball-and-stick models, respectively. The RP105a interface is color-coded on the surface representation according to sequence conservation in four RP105 orthologs, as in Fig. 3.
Dimerization interface-α is located on the convex surface of sRP105 LRR1–4 and on βA, βC, βD, βG, loop BC, and the N-terminal region of MD-1, burying ~560 Å2 of sRP105 surface area (Figs. 2 and 5b, and Supplementary Fig. 5a). Three hydrophobic residues (Trp91, Ile114, Phe115) from LRR2 and LRR3 protrude into a shallow groove on MD-1 βC and βD, and interact mainly with Gly49 and Gly68 (Fig. 5b). This central interaction is buttressed by peripheral polar interactions including 4 H-bonds and 1 salt bridge, as well as an aromatic, perpendicular stacking interaction between Tyr118 and Phe142.
Interface-β involves symmetrical interactions of sRP105a and sRP105b from the ascending side of LRR2 and LRR5–7 (Figs. 2 and 5c). Each sRP105 chain buries a relatively small surface area of only ~180 Å2 in interface-β (Supplementary Fig. 5a, top) using only van der Waals interactions (Fig. 5c). In addition, interface-β exhibits poor shape complementarity (Sc value, 0.35) compared to other interfaces (primary interface-A, 0.67; primary interface-B, 0.68; dimerization interface-α, 0.69)36. Thus, interface-β makes relatively minor contributions compared to interface-α.
Comparison with agonist-activated TLR dimers
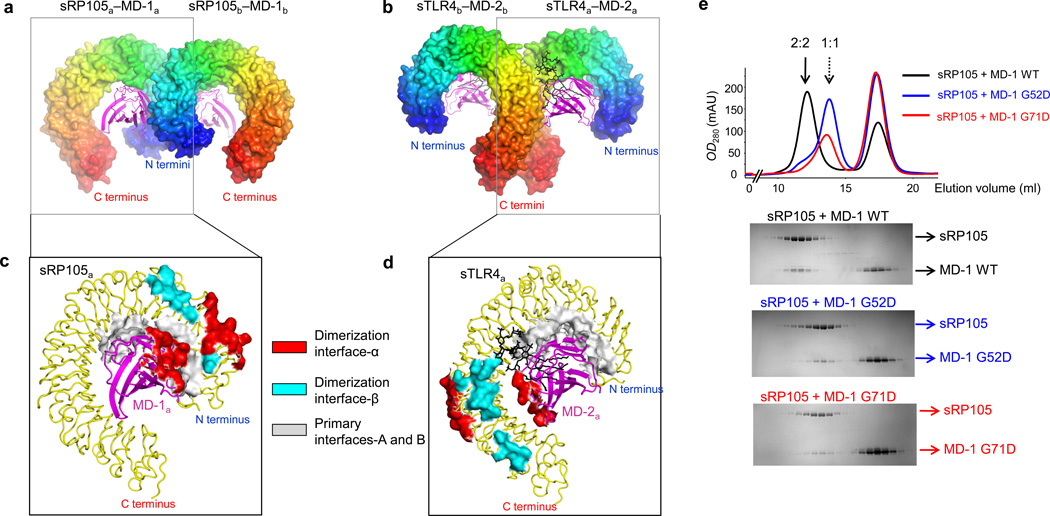
Despite the same 2:2 molecular stoichiometry of sRP105–MD-1 and LPS-bound sTLR4–MD-2, they exhibit completely different dimerization interfaces and arrangement of their TLR or TLR-like structures (Figs. 6a–d). In sRP105–MD-1, each MD-1 molecule uses contiguous primary and dimerization interfaces to simultaneously engage the concave face of N-terminal LRR1–4 modules from one sRP105 chain and the convex face of the same LRR modules from the second sRP105 chain, respectively (Fig. 6c). Consequently, the N-terminal LRR modules of the two sRP105 chains are positioned, along with MD-1, in the center of the complex in a head-to-head orientation (Fig. 6a). In the LPS-bound 2:2 sTLR4–MD-2 complex, MD-2 uses spatially separated surfaces for the primary and dimerization interactions (Fig. 6d). MD-2 forms primary interactions using the same face with the N-terminal LRR modules of sTLR4 as MD-1 does with RP105, but uses its opposite face to make homodimerizing contacts with the C-terminal modules (LRR15–17) from the second TLR4 chain, rather than with the N-terminal LRRs (Fig. 6d). As a result, the two C-terminal domains of sTLR4 interact in a tail-to-tail arrangement that brings their intracellular C-terminal signaling domains together (Fig. 6b)10. Such a tail-to-tail TLR arrangement is recapitulated in other agonist-activated sTLR dimers, including dsRNA-bound sTLR3 homodimer and lipopeptide-bound sTLR2–sTLR1 or sTLR2–sTLR6 heterodimers (Supplementary Fig. 6)6,8,11. Taken together, sRP105–MD-1, in the absence of added LPS, forms preassembled homodimers in a head-to-head organization through contiguous primary and dimerization interfaces, whereas sTLR4–MD-2, in the presence of LPS, homodimerizes in a tail-to-tail mode using spatially separated interfaces.
Figure 6.
Different organization of the 2:2 sRP105–MD-1 and 2:2 LPS-bound sTLR4–MD-2 homodimeric assemblies. (a,b) The head-to-head homodimer of 2:2 sRP105–MD-1 (a) and the tail-to-tail homodimer of 2:2 LPS-bound TLR4–MD-2 (PDB ID code 3fxi)10 (b). The surface representations of sRP105 and sTLR4 are rainbow-colored from N-terminus (blue) and to C-terminus (red). MD-1 and MD-2 are shown in magenta ribbons. LPS bound to sTLR4–MD-2 is represented by black sticks. (c,d) Close-up views of 1:1 sRP105a–MD-1a (c) and 1:1 sTLR4a–MD-2a (d). The distinct dimerization interfaces of 2:2 sRP105–MD-1 and TLR4–MD-2 are shown as red and cyan surface representation over the ribbon diagram of their respective 1:1 complexes. For comparison, the similar primary interfaces-A and B are shown in gray surface representation. (e) The unique head-to-head arrangement of sRP105–MD-1 is verified by mouse MD-1 mutants, G52D and G71D, which do not permit homodimerization of the sRP105–MD-1 complex. sRP105 co-expressed with an excess of MD-1 WT or mutants was analyzed by gel filtration chromatography (Top) and its fractions were resolved by SDS-PAGE (Bottom).
This unique quaternary binding interaction of sRP105–MD-1 has not been found to date in other TLRs. The uniqueness of RP105–MD-1 homodimerization interaction is substantiated by higher sequence conservation in RP105–MD-1 residues in the homodimerization interface than their equivalent residues in TLR4–MD-2 (Supplementary Fig. 5b and 5c), and lower conservation in RP105–MD-1 residues that correspond to TLR4–MD-2 homodimerization interface (Supplementary Fig. 5d and 5e). To further verify the RP105–MD-1 homodimerization interaction, mouse MD-1 mutants, G52D and G71D, were designed to disrupt this interaction. Mouse MD-1 Gly52 and Gly71 correspond to bovine MD-1 Gly49 and Gly68, respectively, that play a critical role in accommodating hydrophobic residues from sRP105 in the center of dimerization interface-α. Consistent with our structural observation, both MD-1 G52D and MD-1 G71D were almost completely devoid of homodimer formation, but retained the sRP105–MD-1 primary interaction as suggested by formation of a stable 1:1 complex between the mutant MD-1 and sRP105 (Fig. 6e). This mutational study, combined with the crystal structure, demonstrates that the sRP105–MD-1 dimerization interaction is not species-specific and is conserved at least in mouse and bovine sRP105–MD-1. Furthermore, it is consistent with the two sRP105 molecules being arranged in the head-to-head orientation via the unique dimerization interaction with MD-1.
DISCUSSION
Here, we provide compelling crystallographic, biophysical, and mutational evidence that sRP105 forms a unique tetrameric complex with MD-1 through primary and homodimerization interfaces. Although the primary interaction engages RP105 and MD-1 in a similar orientation as TLR4–MD-2, several structural differences are observed. The sRP105–MD-1 primary interaction does not show as strong charge complementarity as that of sTLR4–MD-2 and, thus, may be of lower affinity and specificity. This protein-protein interface (interfaces-A and B) is supplemented by novel RP105–MD-1-specific glycan-protein interface (interface-C) between RP105 Asn402-linked glycan and MD-1. The relatively large buried surface area and the sequence conservation within this glycan-protein interface would suggest its importance in sRP105–MD-1 association, but we have not been able to quantitate this interaction as sRP105 N402Q mutant does not express well and is likely misfolded. Nevertheless, co-expression of RP105 N402Q with MD-1 does lead to formation of relatively stable 2:2 complexes.
RP105 Asn402 glycan adopts partially processed, high-mannose type, rather than Man3GlcNAc2 that is commonly observed in insect cells34–35. The incomplete processing may be attributable to its highly restricted location in the sRP105–MD-1 complex. Asn402 glycan is wedged between MD-1 and the concave face of sRP105 (Supplementary Fig. 4b), and would be sterically inaccessible to glycan-processing enzymes in the endoplasmic reticulum or Golgi apparatus, resulting in retention of a high-mannose sugar. Accordingly, mammalian cell expressed in vivo Asn402 glycan would also favor high-mannose glycans, rather than highly processed complex-type glycans. Notwithstanding, when we in silico modeled a complex glycan in place of the high-mannose glycan, most of key interactions with MD-1 are conserved without noticeable steric clashes.
Although RP105–MD-1 forms a homodimer as in ligand-activated TLRs, their configurations are completely different. All of the structures of ligand-bound TLR dimers determined to date exhibit a tail-to-tail organization, which places the C-termini of two sTLRs in close proximity (~25 Å) to activate signaling6,8,10–11. In contrast, 2:2 sRP105–MD-1 engages its two sRP105 molecules in a head-to-head orientation, resulting in a large distance (~90 Å) between their C-termini. The distant positioning of sRP105 C-termini in the complex, as well as a lack of a signaling TIR domain in RP105, suggests that RP105 cannot directly transduce any signal in cells.
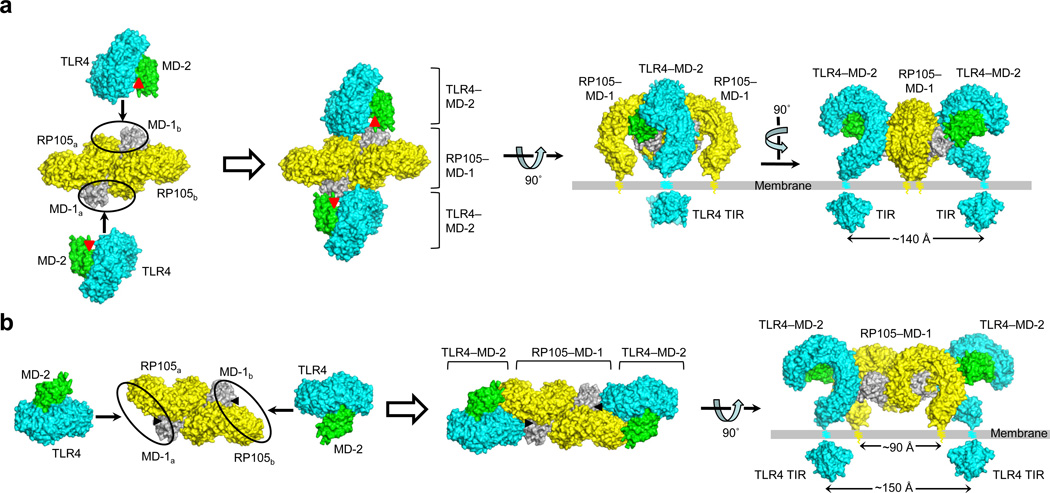
RP105–MD-1 exerts its regulatory activity on LPS and lipoprotein responses by directly interacting with TLR4–MD-2 and TLR2, respectively20,26,28. In particular, inhibition of LPS responses occurs through the extracellular interaction between RP105–MD-1 and TLR4–MD-220. Here, we propose two potential sTLR4–MD-2 binding sites on sRP105–MD-1 (Fig. 7). First, the binding site might be a composite surface of MD-1a and sRP105b (loops AB, CD, GH in MD-1a and the descending side of N-terminal domain in sRP105b), or vice versa, which is generated only after homodimerization (Model 1; Fig. 7a). This model would explain why sRP105–MD-1 evolved a unique 2:2 organization rather than a 1:1 stoichiometry observed in sTLR4–MD-2. In this model, RP105–MD-1 mainly binds and occludes the homodimerization interface of TLR4–MD-2–LPS, thereby preventing formation of a signaling-competent 2:2 complex through a direct competition mechanism. Alternatively, RP105–MD-1 may interfere with the accessibility of LPS to MD-2 by closing off the entrance to the MD-2 cavity (Fig. 7a)20. Model 1 is consistent with previous co-immunoprecipitation data that suggested direct MD-1–MD-2 interaction20. The second model is based on close evolutionary relatedness between RP105–MD-1 and TLR4–MD-2. This model proposes that the TLR4–MD-2 binding site is located in the sRP105 C-terminal domain and the MD-1 EF and GH loops that are equivalent to the homodimerization interface of sTLR4–MD-2–LPS10 (Model 2; Figs. 6d and 7b). The RP105–MD-1 regions would make contacts with the counterparts of TLR4–MD-2 in a pseudo-symmetric manner, engaging sRP105a–MD-1a (or sRP105b–MD-1b) and sTLR4–MD-2 in a similar molecular organization as the LPS-activated 2:2 TLR4–MD-2 complex. Similar to the model 1, RP105–MD-1 may competitively inhibit LPS-induced TLR4–MD-2 oligomerization by occluding the homodimerization interface of TLR4–MD-2–LPS. Moreover, model 2 also explains how RP105–MD-1 inhibits LPS binding to TLR4–MD-220. In LPS-bound 2:2 sTLR4–MD-2, one of LPSa acyl chains bulges out of the MD-2a cavity and is stabilized via hydrophobic interactions with apolar sTLR4b residues including F440, L444, and F463 (Supplementary Fig. 7). However, these three apolar TLR4 residues are substituted with polar residues in RP105. Thus, the corresponding hydrophilic surface of RP105 could not stabilize the exposed hydrophobic LPS acyl chain, thereby disfavoring LPS binding to TLR4–MD-2. Since RP105–MD-1 forms a symmetric homodimer, one 2:2 RP105–MD-1 complex could provide two TLR4–MD-2 binding sites (Fig. 7). In both models, distances between the C-termini of two sTLR4 chains are 140–150 Å, suggesting that two TLR4 molecules complexed with RP105–MD-1 are not competent to signal into cells, and consistent with the inhibitory role of RP105–MD-1 in TLR4 signaling.
Figure 7.
Two possible models for the interaction between RP105–MD-1 and TLR4–MD-2. (a,b) Binding models 1 (a) and 2 (b). Potential TLR4–MD-2 binding sites on RP105–MD-1 are highlighted by black circles in left panels and their resulting complexes are shown in right panels. The sRP105–MD-1 (yellow–gray) and sTLR4–MD-2 (cyan–green) structures are shown by surface representation. MD-2 (a) and MD-1 (b) cavities that accommodate LPS molecules are represented by red and black triangles, respectively. Currently, we favor model 2.
Furthermore, recent reports of MD-1 interaction with LPS33 and an LPS-precursor lipid IVa32–33, combined with the structural conservation of the lipid recognition mode between MD-133 and TLR4–MD-210, allow us to propose that RP105–MD-1 can directly interact with LPS to sequester TLR4–MD-2 from LPS signaling. In MD-1 complexed with tetra-acylated lipid IVa, one of its acyl chains is exposed out of the MD-1 cavity33 as in hexa-acylated LPS in sTLR4–MD-210. Although the exact binding mode of LPS to RP105–MD-1 remains to be revealed, structures of MD-2 complexed with pseudoligands15, lipid IVa15, and LPS10 suggest that, when LPS binds RP105–MD-1, LPS would have to rearrange the binding site to accommodate its six acyl chains compared to pseudoligands or lipid IVa. In this scenario, LPS head groups would be displaced from the MD-1 cavity, and LPS acyl chains would more bulge out of the cavity. We expect that the exposed acyl chain would favor heterodimerization of RP105–MD-1 and TLR4–MD-2 (model 2 in Fig. 7b), as it mediates homodimerization of TLR4–MD-210. Since model 2 explains the regulation of LPS response by RP105–MD-1 regardless of LPS binding, model 2 at present seems more plausible to us. Additionally, model 2 provides further insights into how RP105–MD-1 promotes TLR2-medidated response to M. tuberculosis lipoprotein28. When TLR2 is substituted for TLR4 in model 2, its lipopeptide binding site is located close to the MD-1 cavity that has already been shown to accommodate diverse lipid molecules, raising a possibility that MD-1 would facilitate lipoprotein transfer to TLR2 to enhance the TLR2-mediated lipoprotein response6,8,32–33.
Our analysis above implies that heterodimerization of RP105–MD-1 and TLR4–MD-2 and, thereby, reduction in LPS response, would be favored only when LPS is bound to MD-1, but not to MD-2. Notwithstanding, dimerization of the C-terminal domains of TLR4 and RP105 would essentially block signaling in either scenario of LPS being bound to MD-2 or MD-1. Therefore, the question remains as to how LPS triggers formation of the inhibitory complex, such as by RP105–MD-1–LPS having higher affinity for TLR4–MD-2, or by TLR4–MD-2–LPS having higher affinity for RP105–MD-1. Furthermore, the strict symmetry of the dimeric interaction, as in TLR4–MD-2–LPS, would not be maintained in the RP105–TLR4 heterodimer. Thus, many fascinating questions are now raised by these unexpected findings, and future structural and mutational studies on the interaction between RP105–MD-1 and TLR4–MD-2, in the presence and absence of LPS, are required to determine the exact regulatory mechanism of RP105 and the precise biological role of the 2:2 RP105–MD-1 complex.
METHODS
Methods and their associated references are available in the online version of the paper at http://www.nature.com/nsmb/.
Supplementary Material
ACKNOWLEDGEMENTS
We thank Robyn L. Stanfield (The Scripps Research Institute) and Yeun Su Choo (Sanford-Burnham Medical Research Institute) for critical comments on the manuscript, Robyn L. Stanfield (The Scripps Research Institute), Henry Tien, and David Marciano (The Joint Center for Structural Genomics) for automated crystal screening, and Xiaoping Dai and Marc A. Elsliger (The Scripps Research Institute) for expert technical assistance. The work was supported by the National Institutes of Health grant AI042266 (IAW) and the Skaggs Institute for Chemical Biology. X-ray diffraction datasets were collected at the Stanford Synchrotron Radiation Light source beamline 9-2 and the Advanced Photon Source beamline 23ID-B. This is manuscript no. 20749 from The Scripps Research Institute.
Footnotes
Accession code
Protein Data Bank: coordinates and structure factors have been deposited for bovine sRP105–MD-1 with the accession code 3rg1.
AUTHOR CONTRIBUTIONS
S.I.Y. and I.A.W. designed experiments. S.I.Y. and M.H. performed experiments. S.I.Y., M.H. and I.A.W. analyzed data and wrote the manuscript.
COMPETING FINANCIAL INTERESTS
The authors declare no competing financial interests.
REFERENCES
- 1.Bell JK, et al. Leucine-rich repeats and pathogen recognition in Toll-like receptors. Trends Immunol. 2003;24:528–533. doi: 10.1016/s1471-4906(03)00242-4. [DOI] [PubMed] [Google Scholar]
- 2.Takeda K, Kaisho T, Akira S. Toll-like receptors. Annu Rev Immunol. 2003;21:335–376. doi: 10.1146/annurev.immunol.21.120601.141126. [DOI] [PubMed] [Google Scholar]
- 3.Proell M, Riedl SJ, Fritz JH, Rojas AM, Schwarzenbacher R. The Nod-like receptor (NLR) family: a tale of similarities and differences. PLoS One. 2008;3:e2119. doi: 10.1371/journal.pone.0002119. [DOI] [PMC free article] [PubMed] [Google Scholar]
- 4.Nakhaei P, Genin P, Civas A, Hiscott J. RIG-I-like receptors: sensing and responding to RNA virus infection. Semin Immunol. 2009;21:215–222. doi: 10.1016/j.smim.2009.05.001. [DOI] [PubMed] [Google Scholar]
- 5.Kim HM, et al. Crystal structure of the TLR4-MD-2 complex with bound endotoxin antagonist Eritoran. Cell. 2007;130:906–917. doi: 10.1016/j.cell.2007.08.002. [DOI] [PubMed] [Google Scholar]
- 6.Jin MS, et al. Crystal structure of the TLR1–TLR2 heterodimer induced by binding of a tri-acylated lipopeptide. Cell. 2007;130:1071–1082. doi: 10.1016/j.cell.2007.09.008. [DOI] [PubMed] [Google Scholar]
- 7.Choe J, Kelker MS, Wilson IA. Crystal structure of human toll-like receptor 3 (TLR3) ectodomain. Science. 2005;309:581–585. doi: 10.1126/science.1115253. [DOI] [PubMed] [Google Scholar]
- 8.Kang JY, et al. Recognition of lipopeptide patterns by Toll-like receptor 2-Toll-like receptor 6 heterodimer. Immunity. 2009;31:873–884. doi: 10.1016/j.immuni.2009.09.018. [DOI] [PubMed] [Google Scholar]
- 9.Bell JK, et al. The molecular structure of the Toll-like receptor 3 ligand-binding domain. Proc Natl Acad Sci U S A. 2005;102:10976–10980. doi: 10.1073/pnas.0505077102. [DOI] [PMC free article] [PubMed] [Google Scholar]
- 10.Park BS, et al. The structural basis of lipopolysaccharide recognition by the TLR4-MD-2 complex. Nature. 2009;458:1191–1195. doi: 10.1038/nature07830. [DOI] [PubMed] [Google Scholar]
- 11.Liu L, et al. Structural basis of toll-like receptor 3 signaling with double-stranded RNA. Science. 2008;320:379–381. doi: 10.1126/science.1155406. [DOI] [PMC free article] [PubMed] [Google Scholar]
- 12.Shimazu R, et al. MD-2, a molecule that confers lipopolysaccharide responsiveness on Toll-like receptor 4. J Exp Med. 1999;189:1777–1782. doi: 10.1084/jem.189.11.1777. [DOI] [PMC free article] [PubMed] [Google Scholar]
- 13.Nagai Y, et al. Essential role of MD-2 in LPS responsiveness and TLR4 distribution. Nat Immunol. 2002;3:667–672. doi: 10.1038/ni809. [DOI] [PubMed] [Google Scholar]
- 14.Poltorak A, et al. Defective LPS signaling in C3H/HeJ and C57BL/10ScCr mice: mutations in Tlr4 gene. Science. 1998;282:2085–2088. doi: 10.1126/science.282.5396.2085. [DOI] [PubMed] [Google Scholar]
- 15.Ohto U, Fukase K, Miyake K, Satow Y. Crystal structures of human MD-2 and its complex with antiendotoxic lipid IVa. Science. 2007;316:1632–1634. doi: 10.1126/science.1139111. [DOI] [PubMed] [Google Scholar]
- 16.Mullarkey M, et al. Inhibition of endotoxin response by e5564, a novel Toll-like receptor 4-directed endotoxin antagonist. J Pharmacol Exp Ther. 2003;304:1093–1102. doi: 10.1124/jpet.102.044487. [DOI] [PubMed] [Google Scholar]
- 17.Miyake K, Yamashita Y, Ogata M, Sudo T, Kimoto M. RP105, a novel B cell surface molecule implicated in B cell activation, is a member of the leucine-rich repeat protein family. J Immunol. 1995;154:3333–3340. [PubMed] [Google Scholar]
- 18.Miura Y, et al. Molecular cloning of a human RP105 homologue and chromosomal localization of the mouse and human RP105 genes (Ly64 and LY64) Genomics. 1996;38:299–304. doi: 10.1006/geno.1996.0632. [DOI] [PubMed] [Google Scholar]
- 19.Fugier-Vivier I, et al. Molecular cloning of human RP105. Eur J Immunol. 1997;27:1824–1827. doi: 10.1002/eji.1830270734. [DOI] [PubMed] [Google Scholar]
- 20.Divanovic S, et al. Negative regulation of Toll-like receptor 4 signaling by the Toll-like receptor homolog RP105. Nat Immunol. 2005;6:571–578. doi: 10.1038/ni1198. [DOI] [PMC free article] [PubMed] [Google Scholar]
- 21.Miura Y, et al. RP105 is associated with MD-1 and transmits an activation signal in human B cells. Blood. 1998;92:2815–2822. [PubMed] [Google Scholar]
- 22.Miyake K, et al. Mouse MD-1, a molecule that is physically associated with RP105 and positively regulates its expression. J Immunol. 1998;161:1348–1353. [PubMed] [Google Scholar]
- 23.Nagai Y, et al. Requirement for MD-1 in cell surface expression of RP105/CD180 and B-cell responsiveness to lipopolysaccharide. Blood. 2002;99:1699–1705. doi: 10.1182/blood.v99.5.1699. [DOI] [PubMed] [Google Scholar]
- 24.Nagai Y, et al. The radioprotective 105/MD-1 complex links TLR2 and TLR4/MD-2 in antibody response to microbial membranes. J Immunol. 2005;174:7043–7049. doi: 10.4049/jimmunol.174.11.7043. [DOI] [PubMed] [Google Scholar]
- 25.Ogata H, et al. The toll-like receptor protein RP105 regulates lipopolysaccharide signaling in B cells. J Exp Med. 2000;192:23–29. doi: 10.1084/jem.192.1.23. [DOI] [PMC free article] [PubMed] [Google Scholar]
- 26.Divanovic S, et al. Regulation of TLR4 signaling and the host interface with pathogens and danger: the role of RP105. J Leukoc Biol. 2007;82:265–271. doi: 10.1189/jlb.0107021. [DOI] [PubMed] [Google Scholar]
- 27.Divanovic S, et al. Inhibition of TLR-4/MD-2 signaling by RP105/MD-1. J Endotoxin Res. 2005;11:363–368. doi: 10.1179/096805105X67300. [DOI] [PubMed] [Google Scholar]
- 28.Blumenthal A, et al. RP105 facilitates macrophage activation by Mycobacterium tuberculosis lipoproteins. Cell Host Microbe. 2009;5:35–46. doi: 10.1016/j.chom.2008.12.002. [DOI] [PMC free article] [PubMed] [Google Scholar]
- 29.Hindle KL, Bella J, Lovell SC. Quantitative analysis and prediction of curvature in leucine-rich repeat proteins. Proteins. 2009;77:342–358. doi: 10.1002/prot.22440. [DOI] [PubMed] [Google Scholar]
- 30.Bublitz M, et al. Crystal structure and standardized geometric analysis of InlJ, a listerial virulence factor and leucine-rich repeat protein with a novel cysteine ladder. J Mol Biol. 2008;378:87–96. doi: 10.1016/j.jmb.2008.01.100. [DOI] [PubMed] [Google Scholar]
- 31.Enkhbayar P, Kamiya M, Osaki M, Matsumoto T, Matsushima N. Structural principles of leucine-rich repeat (LRR) proteins. Proteins. 2004;54:394–403. doi: 10.1002/prot.10605. [DOI] [PubMed] [Google Scholar]
- 32.Harada H, Ohto U, Satow Y. Crystal structure of mouse MD-1 with endogenous phospholipid bound in its cavity. J Mol Biol. 2010;400:838–846. doi: 10.1016/j.jmb.2010.05.063. [DOI] [PubMed] [Google Scholar]
- 33.Yoon SI, Hong M, Han GW, Wilson IA. Crystal structure of soluble MD-1 and its interaction with lipid IVa. Proc Natl Acad Sci U S A. 2010;107:10990–10995. doi: 10.1073/pnas.1004153107. [DOI] [PMC free article] [PubMed] [Google Scholar]
- 34.Altmann F, Staudacher E, Wilson IB, Marz L. Insect cells as hosts for the expression of recombinant glycoproteins. Glycoconj J. 1999;16:109–123. doi: 10.1023/a:1026488408951. [DOI] [PubMed] [Google Scholar]
- 35.Aeed PA, Elhammer AP. Glycosylation of recombinant prorenin in insect cells: the insect cell line Sf9 does not express the mannose 6-phosphate recognition signal. Biochemistry. 1994;33:8793–8797. doi: 10.1021/bi00195a022. [DOI] [PubMed] [Google Scholar]
- 36.Lawrence MC, Colman PM. Shape complementarity at protein/protein interfaces. J Mol Biol. 1993;234:946–950. doi: 10.1006/jmbi.1993.1648. [DOI] [PubMed] [Google Scholar]
Associated Data
This section collects any data citations, data availability statements, or supplementary materials included in this article.


