Abstract
Background and Aims
Inflammatory bowel disease (IBD) refers to two chronic inflammatory diseases of the intestine: ulcerative colitis and Crohn’s disease. IBD results from environmental factors (e.g. bacterial antigens) triggering a dysregulated immune response in genetically predisposed hosts. While the basis of IBD is incompletely understood, a number of recent studies have implicated defective innate immune responses in the pathogenesis of IBD. In this regard, there is much interest in therapies that activate innate immunity (e.g. recombinant GM-CSF).
Methods
In this study, we screened expression and function of circulating leukocyte GM-CSF receptor (CD116) mRNA and surface protein in 52 IBD patients and 52 healthy controls.
Results
Our results show that both granulocyte and monocyte CD116 levels, but not CD114 or IL-3Rα, were significantly repressed in IBD compared to control (p<0.001) and disease controls (irritable bowel syndrome, IBS, p<0.001; rheumatoid arthritis, RA, p<0.025). IBD-associated CD116 repression was more prominent in patients with ulcerative colitis compared to Crohn’s disease (p<0.05), was independent of disease activity (p>0.05) and was not influenced by current medications (p>0.05). Receiver operating characteristic (ROC) curve analysis revealed that leukocyte CD116 expression is a sensitive (85%) and specific (92%) biomarker for IBD. Moreover, granulocyte CD116-mediated function (phosphorylation of STAT3) paralleled decreased expression of CD116 in IBD granulocytes compared to control (p<0.001).
Conclusion
These studies identify repression of CD116 as a distinguishing feature of IBD and implicate an associated defect in innate immune responses toward GM-CSF.
Keywords: intestine, leukocyte, growth factor, inflammation
Introduction
The inflammatory bowel diseases (IBD), including ulcerative colitis (UC) and Crohn’s disease (CD) are chronic mucosal inflammatory disorders which result from a dysregulated immune response in genetically predisposed hosts1. Although the etiology of CD and UC remains unclear, accumulating evidence suggests that dysfunction of the mucosal immune system plays an important role in the pathogenesis of IBD. Significant evidence, in fact, implicates impaired innate immunity (granulocytes, macrophages and dendritic cells) in IBD, particularly CD2. These defects include reduced barrier function, delayed bacterial clearance, hyporesponsive neutrophils and defective macrophage cytokine secretion 2, 3. Such defects have the potential to allow abnormal microbial invasion and pathological T-cell mediated chronic inflammation.
The effective treatment of IBD is currently an area of intense investigation. Treatment of IBD includes lifestyle changes, medical management, and surgical interventions. The use of biological therapies has gained much attention in recent years4. A seminal advance was the introduction of anti-TNF-α monoclonal antibody, which is particularly effective in Crohn’s disease 1. The efficacy of this therapy alone likely reflects the pleiotropic influence of TNF-α, although anti-TNF-α therapy is often limited by a loss of efficacy, therefore underscoring the need for other therapies. Given the central role of innate immune cells in IBD, considerable attention has been given to granulocyte-macrophage colony-stimulating factor (GM-CSF)5. Recent studies, for example, have suggested that auto-antibodies to GM-CSF are associated with ileitis in mouse models and with progressive ileal disease in human CD patients6. In the past several years, recombinant CSF’s have emerged as a potential tool for the treatment of IBD 5, showing some promise in the treatment of active CD patients with recombinant human GM-CSF (rhGM-CSF) 7–10. The efficacy of rhGM-CSF has been hampered by significant variability amongst CD patient populations 5.
The GM-CSF receptor (also called CD116) belongs to the family of colony-stimulating hematopoietic growth factor receptors 11, which includes three structurally distinct receptors which bind GM-CSF, M-CSF or G-CSF. The M-CSF receptor (CSF1R; also known as CD115 or FMS) is a homodimeric type III receptor tyrosine kinase. CD116 (also called CSF2R) consists of a unique α-chain and a common β-chain (βc) which is shared with the interleukin (IL)-3 and IL-5 receptor. The G-CSF receptor (CSF3R or CD114) is typical of the type I cytokine receptor family11. CD116 is most prominently expressed on myeloid lineages and on epithelial cells 11.
Based on established defects in innate immunity and variable rhGM-CSF efficacy in IBD treatment, we hypothesized that IBD leukocytes differentially express CD116 relative to a healthy control population. Therefore, we undertook a screen to define levels of leukocyte GM-CSF receptor levels (CD116) in CD and UC patients. We report here that repressed expression of leukocyte CD116 is a novel, distinguishing feature of IBD.
Material and Methods
Human subjects
The institutional review board of the University of Colorado Denver approved all human studies. CD and UC patients were diagnosed using established criteria, and CD phenotype was per the Montreal criteria12 (see Table 1 for patient characteristics). IBS patients were diagnosed by ROME III criteria13. Rheumatoid arthritis patients were diagnosed based on criteria of the American College of Rheumatology14. Medications were recorded at time of blood draw and the attending physician recorded a clinical estimation of disease activity, which included disease remission, mild disease, moderate disease or severe disease.
Table 1.
IBD Patient Characteristics
| Crohn’s Disease | Ulcerative Colitis | IBS | RA | Healthy | |
|---|---|---|---|---|---|
| No. of Patients | 33 | 19 | 8 | 9 | 52 |
| % Male | 61 | 53 | 25 | 66 | 60 |
| Median Age (yrs) | 31 | 51 | 36 | NA* | 28 |
| Disease Severity | |||||
| % Severe | 12 | 5 | |||
| % Moderate | 36 | 16 | |||
| % Mild | 40 | 48 | |||
| % Remission | 12 | 31 | |||
| Medications | |||||
| % None | 15 | 27 | |||
| % 5-ASA | 20 | 42 | |||
| % 5-ASA/Steroids | 18 | 11 | |||
| % AZA/Steroids | 11 | 14 | |||
| % Anti-TNF | 36 | 6 | |||
NA = information not available
IBS = irritable bowel syndrome
RA = rheumatoid arthritis
Leukocyte isolation, RNA isolation and transcriptional analysis
Whole venous blood granulocytes were isolated as previously described15. RNA was isolated using Trizol (Invitrogen, Carlsbad, CA) and cDNA synthesized as described previously 15. Potential contaminating genomic DNA was digested using Turbo DNA-free (Ambion, Austin, TX, USA). Changes in gene expression in granulocytes isolated from patient whole blood was compared to that of granulocytes isolated from healthy controls. Semi-quantitative and real-time PCR were performed using increasing numbers of cycles of 95°C for 45 sec, 59°C for 35 sec and 72°C for 45 sec and a final extension time of 7 min. The following primers were used to quantify expression in isolated granulocytes: CSF1R (M-CSFR, CD115): forward 5′-CTGCCTGCCACTTCCCCA -3′ and reverse 5′-ACGCTGCCATTGCCCACA -3′; CSF2R (GM-CSFR, CD116): forward 5′-GCAGACGTCCGCATCTTGA-3′ and reverse 5′-CCGTCGTCAGAACCAAATTCA-3′; CSF3R (G-CSFR, CD114): forward 5′-AGCCCCAAGTCCTATGAGAAC-3′ and reverse 5′-GCAGGAGGGGGAAGTTGAG-3′; IL3RA: forward 5′-CGCAAACACACGTGCCTGG -3′ and reverse 5′-CTTTGCCCGCCTCCCAGA -3′; β-actin: forward 5′-GCACTCTTCCAGCCTTCCTTCC-3′ and reverse 5′-CAGGTCTTTGCGGATGTCCACG-3′. Transcript levels were analyzed by comparison of 2−Δ CT (where CT is the PCR threshold cycle number for either the gene of interest or the gene control) as described in detail elsewhere16. Intron-spanning primer pairs were designed using Primer3 software (http://frodo.wi.mit.edu/). Primer properties and secondary structures including hairpins, self-dimers, and cross-dimers were evaluated in a second step using Netprimer software (http://www.premierbiosoft.com/netprimer). Samples were controlled for β-actin.
GM-CSF receptor (CD116) staining
Whole blood (100 μL) was incubated with phycoerythrin-labeled mouse anti-human CD116 (2.5 μL) (BD Pharmigen, San Jose, CA) in the dark for 30 minutes at 4°C. The red blood cells (RBC) were then lysed using BD pharm lyse™ (2 mL) (BD Pharmigen, San Jose, CA) for 15 minutes in the dark at room temperature. The cells were then washed with FACS wash (phosphate-buffered saline (PBS) and 1% bovine serum albumin) and fixed in 2% paraformaldehyde. CD116 expression on granulocytes and monocytes was evaluated using flow cytometry (FACSCantoII and Diva software, BD Biosciences, San Jose, CA). Granulocytes and monocytes were gated according to forward- and side-scatter properties and result presented as the mean fluorescence intensity (MFI) for indicated surface markers.
Granulocyte phospho-STAT3 response to GM-CSF
Whole blood (100 μL) was stimulated with PBS or recombinant human GM-CSF (Invitrogen, Carlsbad, CA), 180 ng/mL, for 15 minutes. The reaction was fixed and the RBC lysed using BD™ Phosflow Lyse/Fix buffer (2 mL) (BD Biosciences, San Jose, CA) for 15 minutes at 37°C. The cells were permeabilized with BD™ Phosflow Perm Bufffer III (1 ml, BD Biosciences, San Jose, CA) for 30 minutes on ice. The tubes were washed and stained with phosphorylated signal transducers and activators of transcription 3 (pSTAT3-pY705) (BD Pharmigen, San Jose, CA) for 30 min at room temperature. The granulocytes containing pSTAT3 were determined using flow cytometry.
Western Blot Analysis
Granulocytes were isolated to >98% purity from whole venous blood as described elsewhere 17. Following activation with GM-CSF (1×10⁶ granulocytes/ml 10ng/ml, 15 min), cells were washed with ice-cold phosphate-buffered saline and lysed by sonication in Tris lysis buffer (150 mM NaCl; 20 mM Tris, pH 5.5; 1 mM EDTA; 1 mM EGTA; 1% Triton X-100. Protein concentration was assessed by the bicinchoninic acid (BCA) assay following the manufacturer’s instructions (Thermo Scientific) in order to ensure equal protein loading of each preparation. Proteins were separated by SDS-PAGE electrophoresis and transferred to PVDF membrane (Bio-Rad Laboratories, Hercules, CA) for immunoblotting. Antibodies utilized for this study were: anti-pSTAT3 (Cell Signaling) and anti-β-actin (Abcam). Proteins were visualized using the SuperSignal detection substrate (Thermo Scientific).
Statistical analysis
All expression patterns were compared using analysis of variance with post-hoc Student’s t Test for continuous variables. A Receiver Operator Characteristic (ROC) analysis is a statistical approach for evaluating the performance of a new quantitative assay18 and was used to determine the optimal threshold as measured by sensitivity and specificity. A p value of <0.05 was considered statistically significant. All data are presented as the mean ± standard error of the mean. Statistical analyses were perfomed using GraphPad Prism software (LaJolla, CA).
Results
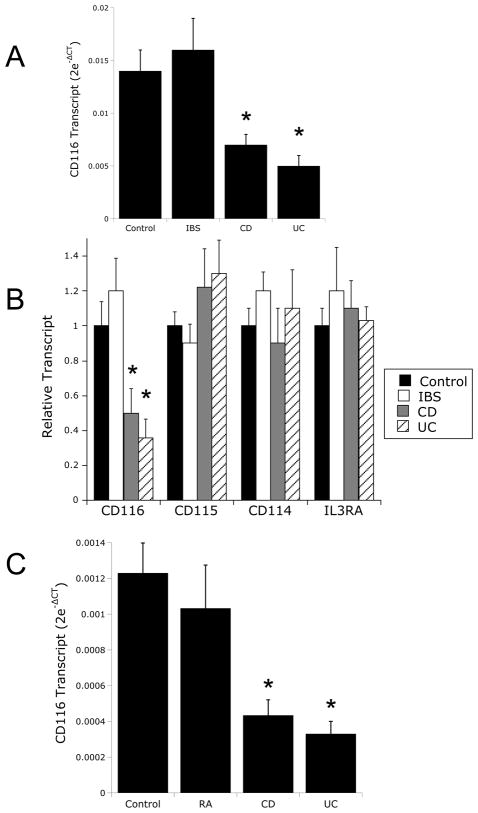
Initial studies were undertaken to define the levels of CD116 mRNA in IBD and control granulocytes. As shown in Figure 1A, real-time PCR analysis for CD116 were compared in ten healthy controls and ten patients with IBD. As can be seen, CD116 mRNA levels were decreased by as much as 65±8% in IBD granulocytes (p<0.001). Defective CD116 expression was evident in both UC and CD, but not in granulocytes from patients with irritable bowel syndrome (IBS, Figure 1A). To examine the specificity of this observation, we screened monocyte expression patterns of other related cytokine receptors. As shown in Figure 1B, no significant changes between IBD and healthy controls were observed for CD115 (p>0.05), CD114 (p>0.05) or the IL3RA (p>0.05), demonstrating at least some degree of specificity for CD116. Moreover, patients with rheumatoid arthritis (RA, n=9), which serve as an inflammatory control for these studies, showed not defect in CD116 expression compared to healthy controls (Figure 1C, p>0.05).
Figure 1. Analysis of CD114 (G-CSF receptor) and CD116 (GM-CSF receptor) mRNA expression in healthy, RA and IBD granulocytes.
In Panel A, total RNA was isolated from purified granulocytes derived from healthy control (n=10), IBD (n=5 CD and n=5 UC), irritable bowel syndrome (IBS, n=8). RNA was used as a template to analyze CD116. Data are expressed as mean±SD transcript level derived from the differential threshold cycle number (2e-ΔCT) where * is p<0.01 compared to both Control and IBS. In panel B, RNA from mononuclear cells was used as a template to examine expression of CD116, CD115, CD114 and IL3RA relative to β-actin using real-time PCR. Because expression levels varied between the different receptors, results were normalized to healthy control expression levels and presented as relative transcript level±SD where * is p<0.01 compared to both Control and IBS. In panel C total RNA was isolated from purified mononuclear cells derived from healthy control (n=10), IBD (n=5 CD and n=5 UC) and rheumatoid arthritis (RA, n=9). RNA was used as a template to analyze CD116 relative to β-actin using real-time PCR. Data are expressed as mean±SD transcript level derived from the differential threshold cycle number (2e-ΔCT) where * is p<0.025 compared to both Control and RA.
Table 1 depicts the demographics of patients used in this study. None of the parameters listed were significantly different between healthy controls and IBD patients (all p>0.05) The median age of IBD [interquartile range (IQR) 29 to 51] patients was 42yo wherein 57% were male, for which 33 patients had Crohn’s disease (CD) and 19 patients had ulcerative colitis (UC). The median age of normal patients was 28yo (IQR 28 to 46) wherein 54% were male. The median age of IBS patients was 36yo (IQR 26 to 54) wherein 17% were male.
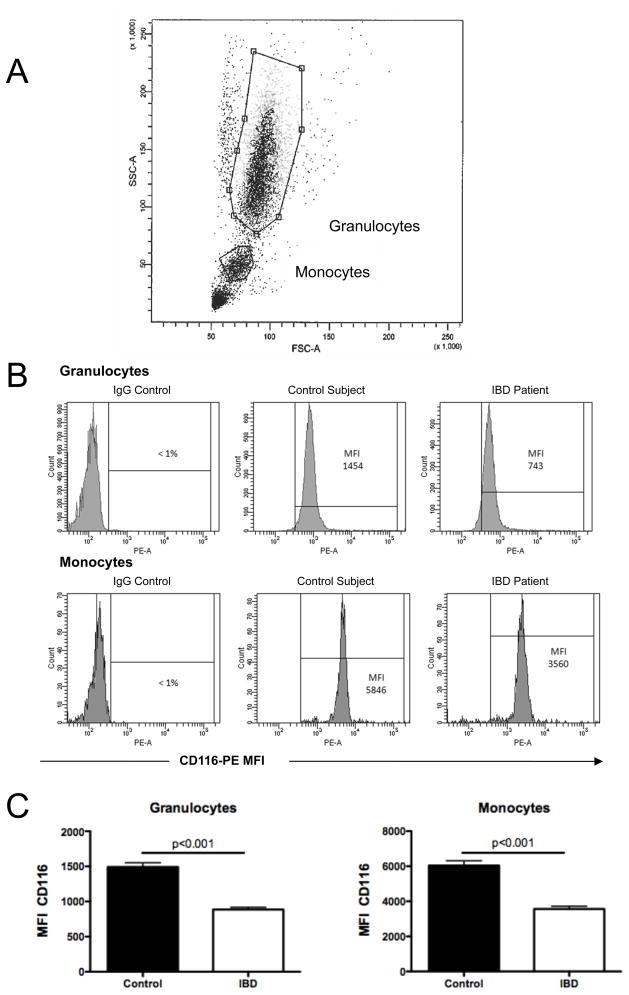
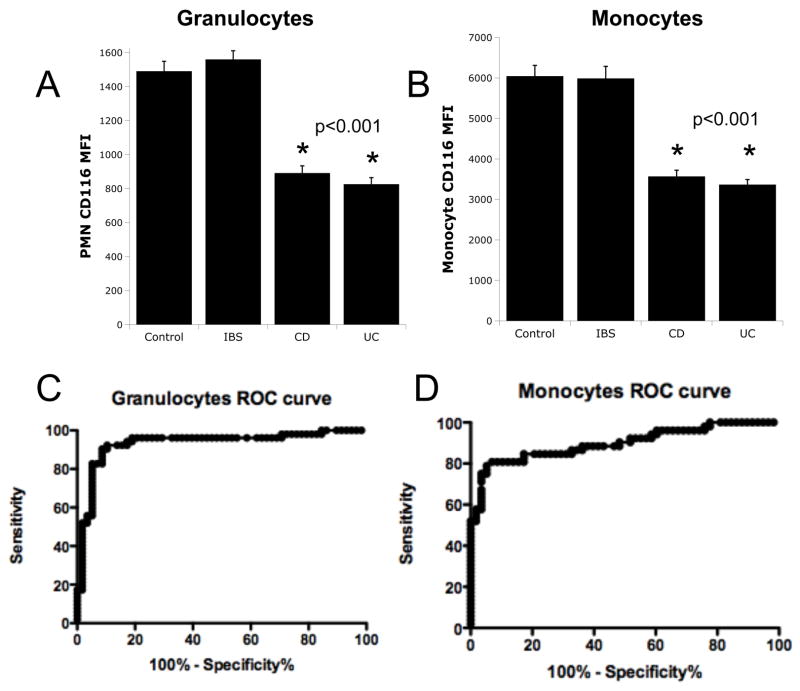
Using this patient cohort, we extended our initial PCR results to define levels of surface CD116 on circulating granulocytes and monocytes in 52 IBD patients, 52 healthy controls and 8 disease control (IBS) patients by flow cytometry (see gating strategy in Figure 2A). Representative scattergrams for flow cytometric analysis of CD116 are shown in Figure 2B. These revealed that granulocyte surface CD116 levels in IBD (MFI 886±32) were significantly lower than healthy controls (MFI 1490±59, p < 0.001, Figure 2C). Likewise, monocyte CD116 levels in IBD (MFI 3566±156) were significantly less compared to healthy controls (MFI 6042±268, p < 0.001, Figure 2C). Circulating lymphocytes did not express detectable CD116 (MFI equivalent to IgG control). Expression of CD116 on disease control (IBS) granulocytes (Figure 3A) and monocytes (Figure 3B) were indistinguishable from healthy control leukocytes (p<0.001 for both compared to CD and UC leukocytes).
Figure 2. Flow cytometric analysis of CD116 surface expression on healthy and IBD granulocytes and monocytes.
Anti-coagulated whole venous blood was obtained from healthy controls (n=52) and IBD patients (n=52) and used to examine CD116 expression by flow cytometry. Panel A shows an example of the gating strategy used to define granulocytes and monocytes. Panle B depicts representative flow cytometry scattergrams for IgG control and CD116 expression on granulocytes (top panels) and monocytes (bottom panels). Panel C depict expression levels (MFI, mean fluorescence intensity) for granulocytes and monocytes, respectively.
Figure 3. Receiver operating characteristic (ROC) curve analysis for CD116 expression on healthy, irritable bowel syndrome (IBS) and IBD leukocytes.
Anticoagulated whole venous blood was obtained from healthy controls (n=52) irritable bowel syndrome patients (IBS, n=6) and IBD patients (CD n=33 and UC n=19) and used to examine CD116 expression by flow cytometry. Panels A and B show expression of CD116 for granulocytes and monocytes, respectively. Panels C and D depict ROC curve analysis for granulocytes and monocytes, respectively.
Analysis of these results using a receiver operating characteristic (ROC) curve revealed an area of 0.931 for granulocytes with a cutoff MFI less than 1120 translating to a sensitivity of 90% and a specificity of 91% for predicting IBD (Figure 3C). The ROC curve for monocytes showed an area of 0.898 that with a cutoff of MFI less than 4250 translating to a sensitivity of 81% and a specificity of 94% for predicting IBD (Figure 3D). Of the 52 IBD patients, 82% (43/52) had low granulocyte and low monocyte CD116 levels, 6% (3/52) had low granulocyte but normal monocyte CD116, and 6% (3/52) had normal granulocyte and low monocyte CD116 levels. Of the IBD patients, 3 patients (3/52) had normal granulocyte and normal monocyte CD116 levels. Of the healthy controls and IBS controls, 87% (45/52) had normal granulocyte and normal monocyte CD116 levels, 4% (2/52) had normal granulocyte and low monocyte CD116, and 9% (5/52) had low granulocyte and normal monocyte CD116 expression. Of the healthy controls and IBS controls, no patients had low granulocyte and low monocyte levels.
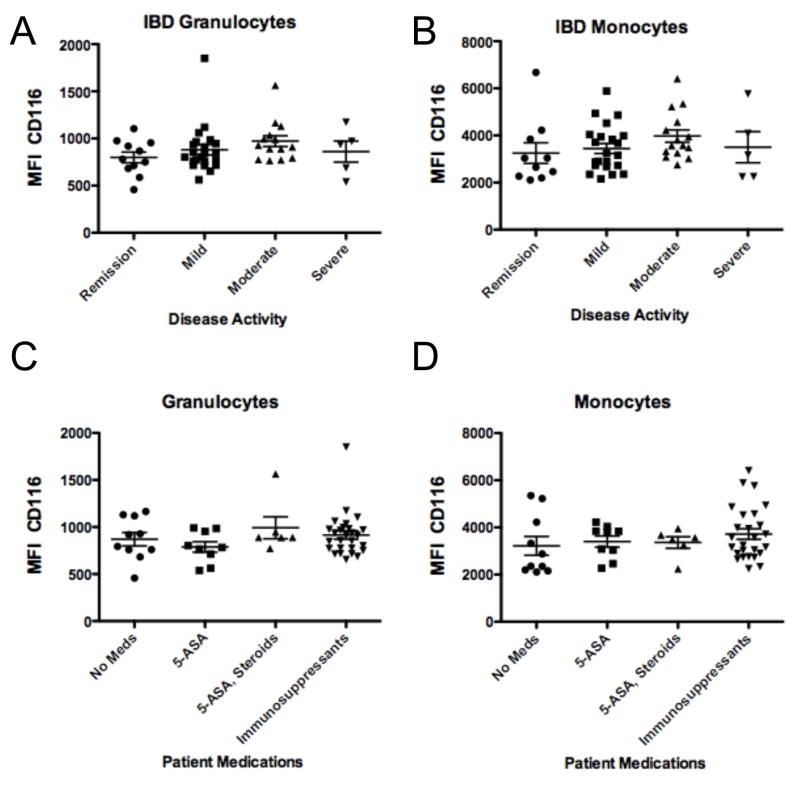
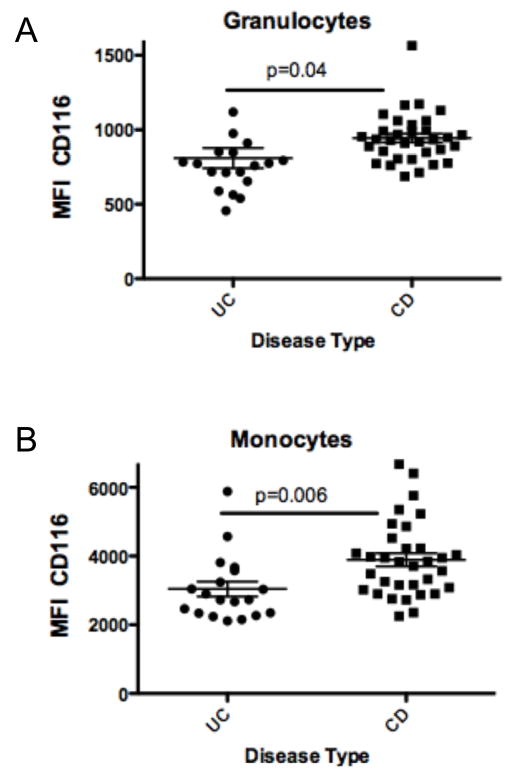
CD116 levels in IBD patients were not affected by disease activity at the time of sampling (p > 0.05, Figure 4A and 4B) and were independent of any medications (p > 0.05, Figure 4C and 4D). Within IBD populations, UC patients were found to express significantly lower granulocyte (679±33 vs 897±35, p < 0.001, Figure 5A) and monocyte CD116 (2592±168 vs 3475±161, p < 0.01, Figure 5B) compared to CD patients.
Figure 4. Influence of disease activity and current medications on CD116 expression on IBD leukocytes.
Anti-coagulated whole venous blood was obtained from IBD patients with indicated disease activity (panels A and B) or on indication medications (panels C and D) and examined for surface expression of CD116 on granulocytes (panels A and C) or monocytes (panels B and D), respectively.
Figure 5. Analysis of CD116 expression on UC and CD leukocytes.
Anti-coagulated whole venous blood was obtained from UC or CD patients and examined for surface expression of CD116 on granulocytes (panel A) or monocytes (panel B), respectively.
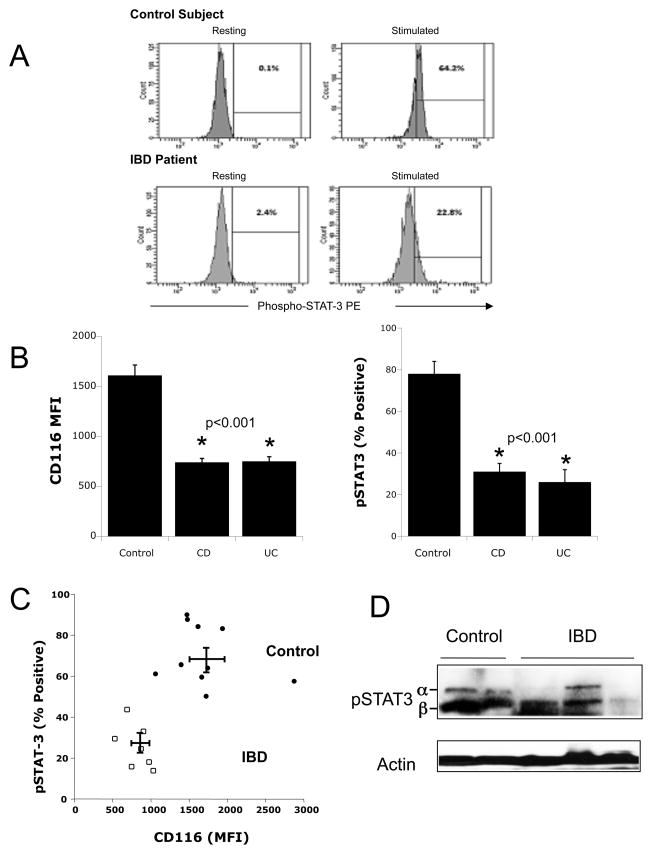
To determine if reduced levels of CD116 correlated with a reduced functional response, GM-CSF activation (180 ng/ml for 15 min based on pilot studies) of pSTAT3 was investigated in 10 healthy controls and 8 patients with IBD. Representative scattergrams for flow cytometric analysis of resting and stimulated pSTAT3 are shown in Figure 6A. In this analysis, we reconfirmed that granulocyte surface CD116 levels in UC and CD (MFI 846±54) were significantly lower than healthy controls (MFI 1655±140, p < 0.001) (Figure 6B). Such decreased expression corresponded to significant reductions on STAT3 phosphorylation. Indeed pSTAT3 levels in CD and UC patients (28±4 % positive) were significantly lower than healthy controls (73±5 % positive, p < 0.001) (Figure 6B). A plot of these corresponding expression (flow cytometry CD116 MFI) and function (% positive for pSTAT3) values showed a distinct separation between healthy controls and IBD (Figure 6C). Analysis of stimulated (10ng/ml, 15min) pSTAT3 in purified granulocytes by immunoblotting revealed both the α (86kDa) and β (79kDa) chains of STAT3 typical of stimulated human granulocytes19. As shown in Figure 6D, variable induction of pSTAT3 in IBD patients, with significant reduction compared to healthy controls. Such findings identify defective CD116 expression and function as a distinguishing biomarker in leukocytes derived from UC and CD patients.
Figure 6. Comparison of CD116 expression and GM-CSF-stimulated STAT3 phosphorylation in healthy ad IBD granulocytes.
Whole blood from healthy controls (n=10) and IBD patients (n=8) were stimulated rhGM-CSF (180ng/ml, 15 min) and stained for CD116 or pSTAT3. Panel A shows representative scattergrams for resting and stimulated pSTAT3 staining. Panel B shows a cumulative plot of CD116 (left panel, plotted as CD116 MFI) and pSTAT3 (right panel, plotted as % of Parent). Panel C depicts a plot of CD116 MFI vs pSTAT3 for IBD (open squares) and healthy control granulocytes (closed circles). In panel D, granulocytes were purified from whole venous blood and stimulated with rhGM-CSF (10ng/ml, 15min). Shown here is a representative pSTAT3 immunoblot from healthy control (n=2) and IBD (n=3) patients, with β-actin serving as a loading control.
Discussion
Given the unknown etiology of IBD, there is significant interest in both new therapies and biomarkers to define and sub-divide patient populations. GM-CSF has attracted attention of late as a therapy for disorders of innate immunity, including IBD 5. In this study, we sought to define whether specific differences existed in CD116 expression between IBD and healthy control patients. Results from the present studies show that decreased expression and function of CD116 is a distinguishing feature of IBD and may provide important insight into the innate immune defects in IBD.
There is much recent interest in defining the innate immune defect in IBD. Ongoing studies, for example, have revealed that CD is associated with a significantly impaired acute inflammatory response and defects in bacterial clearance 3. Such defects result in granulomatous inflammation and persistence to the extent that some have suggested that CD is a primary immunodeficiency of unknown etiology 2. Central to the development and functional activation of innate immune cells is GM-CSF11. We report here that CD116 expression is uniformly decreased on granulocytes and monocytes from both UC and CD patients. This repression was found to be independent of disease severity and current medications, suggesting that this defect is more basic in nature. At present, we do not know the mechanism(s) that result in such decreased expression of CD116. This phenotype is not likely to result from increased internalization or abnormal processing of CD116, since decreased surface expression paralleled decreases in CD116 mRNA expression. Decreased CD116 expression and function in peripheral blood leukocytes has been variably associated in myelodysplastic syndrome20 and in granulocytes of elderly patients21, and thus could result from a developmental myeloid defect. Important in this regard, we have not determined whether CD116 expression is abnormal in bone marrow lineages or in cells other than monocytes and granulocytes (e.g. intestinal epithelial cells).
Of interest for our observations is the emergence of recombinant GM-CSF as a potential treatment of IBD 5. While these studies have shown some promise for subsets of CD patients8–10, a large scale, randomized clinical trial has yet to be done. Given the observed deficiencies in CD116 expression and function (decreased STAT3 phosphorylation in response to GM-CSF) in IBD, it is interesting to speculate whether analysis of CD116 might be a reasonable first step before the initiation of rhGM-CSF therapy. Notable in this regard is the finding that a small number of IBD patients express nearly normal levels of CD116, particularly on circulating monocytes (see Figure 3). Likewise, it may be interesting to consider whether CD116 might be a stratifying tool for UC versus CD patients. Our analysis was able to distinguish a significant difference between CD and UC based on CD116 expression, although with far less sensitivity than distinguishing IBD relative to control. A significantly larger cohort of patients would be necessary to define whether CD116 expression might definitively distinguish CD from UC.
Within these studies, we showed functional abnormalities in IBD granulocytes administered exogenous rhGM-CSF, namely deficient GM-CSF-induced STAT3 phosphorylation. STAT3-mediated signaling in granulocytes has been shown to direct neutrophil migration, promote bacterial killing and to enhance neutrophil proliferation and survival 11. It is interesting to note that STAT3 mutations have been reported in IBD using genome-wide association 22. To date, none of these mutations have been shown to translate to defective STAT3 protein expression. While we have not screened our patients for mutations in STAT3, given the low incidence of STAT3 mutations amongst overall IBD patients, it is not likely that such mutations contribute significantly to our observations here. Rather, it is more likely that this functional defect in STAT3 phosphorylation represents a direct reflection of decreased surface CD116 expression. Our own analysis plotting function (STAT3 phosphorylation) versus CD116 expression revealed a strong separation between the IBD and normal patient cohorts (see Figure 6).
The finding of defective leukocyte CD116 has the potential to serve as both an IBD diagnostic marker as well as a therapeutic response predictor. Important in this regard, the definitive diagnosis of CD and UC is not straightforward and is currently based on a combination of clinical, radiographic, endoscopic, and histological criteria 23. Patients often present with varying complaints of abdominal pain, rectal bleeding, weight loss, anemia and diarrhea that guide the diagnosis of IBD. Some of these symptoms overlap with other more common gastrointestinal disorders, including IBS and celiac disease 23. In cases where CD or UC is strongly suspected, early intervention could prove valuable. Our analysis was, for example, able to distinguish between IBD and IBS, albeit on a small number of IBS patients. Nonetheless, in the comparison of IBD to control, ROC curve analysis revealed sensitivity and specificity of nearly 90% for both monocytes and granulocytes in distinguishing IBD from healthy controls. These values compare well, and even exceed, the positive predictive value of currently available diagnostic tests 24. In addition, given the recent interest in sub-typing IBD patients prior to initiation of treatment25, there exists an opportunity to use CD116 as a stratification tool for patient selection.
In summary, these results define CD116 as a previously unappreciated biomarker for IBD. Defective CD116 expression and function could have important implications toward a role for GM-CSF-mediated signaling the pathogenesis of IBD as well as potential strategies for therapy and diagnosis.
Acknowledgments
This work was supported by National Institutes of Health grants R37-DK5018, RO1-HL60569 and by support from the Crohn’s and Colitis Foundation of America.
Footnotes
The authors declare no financial interests in any of the work submitted here.
Author contributions:
Jonathan I. Goldstein: study concept and design, acquisition of data, interpretation of data
Douglas J. Kominsky: study design, acquisition of data; analysis and interpretation of data
Nicole Jacobson: acquisition of data; analysis and interpretation of data
Brittelle Bowers: acquisition of data; analysis and interpretation of data
Kirsten Regalia: acquisition of data; analysis and interpretation of data
Gregory L. Austin: study design interpretation of data
Melinda Yousefi: acquisition of data
Michael T. Falta: acquisition of data
Andrew P. Fontenot: acquisition of data
Mark E. Gerich: acquisition of data
Lucy Golden-Mason acquisition of data; analysis and interpretation of data
Sean P. Colgan: study concept and design, interpretation of data, drafting manuscript
Publisher's Disclaimer: This is a PDF file of an unedited manuscript that has been accepted for publication. As a service to our customers we are providing this early version of the manuscript. The manuscript will undergo copyediting, typesetting, and review of the resulting proof before it is published in its final citable form. Please note that during the production process errors may be discovered which could affect the content, and all legal disclaimers that apply to the journal pertain.
References
- 1.Xavier RJ, Podolsky DK. Unravelling the pathogenesis of inflammatory bowel disease. Nature. 2007;448:427–34. doi: 10.1038/nature06005. [DOI] [PubMed] [Google Scholar]
- 2.Marks DJ, Rahman FZ, Sewell GW, Segal AW. Crohn’s disease: an immune deficiency state. Clin Rev Allergy Immunol. 2010;38:20–31. doi: 10.1007/s12016-009-8133-2. [DOI] [PMC free article] [PubMed] [Google Scholar]
- 3.Sewell GW, Marks DJ, Segal AW. The immunopathogenesis of Crohn’s disease: a three-stage model. Curr Opin Immunol. 2009;21:506–13. doi: 10.1016/j.coi.2009.06.003. [DOI] [PMC free article] [PubMed] [Google Scholar]
- 4.Rutgeerts P, Vermeire S, Van Assche G. Biological therapies for inflammatory bowel diseases. Gastroenterology. 2009;136:1182–97. doi: 10.1053/j.gastro.2009.02.001. [DOI] [PubMed] [Google Scholar]
- 5.Barahona-Garrido J, Yamamoto-Furusho JK. New treatment options in the management of IBD - focus on colony stimulating factors. Biologics. 2008;2:501–4. doi: 10.2147/btt.s3543. [DOI] [PMC free article] [PubMed] [Google Scholar]
- 6.Han X, Uchida K, Jurickova I, Koch D, Willson T, Samson C, Bonkowski E, Trauernicht A, Kim MO, Tomer G, Dubinsky M, Plevy S, Kugathsan S, Trapnell BC, Denson LA. Granulocyte-macrophage colony-stimulating factor autoantibodies in murine ileitis and progressive ileal Crohn’s disease. Gastroenterology. 2009;136:1261–71. e1–3. doi: 10.1053/j.gastro.2008.12.046. [DOI] [PMC free article] [PubMed] [Google Scholar]
- 7.Kelsen JR, Rosh J, Heyman M, Winter HS, Ferry G, Cohen S, Mamula P, Baldassano RN. Phase I trial of sargramostim in pediatric Crohn’s disease. Inflamm Bowel Dis. 2010;16:1203–1208. doi: 10.1002/ibd.21204. [DOI] [PubMed] [Google Scholar]
- 8.Korzenik JR, Dieckgraefe BK, Valentine JF, Hausman DF, Gilbert MJ. Sargramostim for active Crohn’s disease. N Engl J Med. 2005;352:2193–201. doi: 10.1056/NEJMoa041109. [DOI] [PubMed] [Google Scholar]
- 9.Takazoe M, Matsui T, Motoya S, Matsumoto T, Hibi T, Watanabe M. Sargramostim in patients with Crohn’s disease: results of a phase 1–2 study. J Gastroenterol. 2009;44:535–43. doi: 10.1007/s00535-009-0029-7. [DOI] [PubMed] [Google Scholar]
- 10.Valentine JF, Fedorak RN, Feagan B, Fredlund P, Schmitt R, Ni P, Humphries TJ. Steroid-sparing properties of sargramostim in patients with corticosteroid-dependent Crohn’s disease: a randomised, double-blind, placebo-controlled, phase 2 study. Gut. 2009;58:1354–62. doi: 10.1136/gut.2008.165738. [DOI] [PubMed] [Google Scholar]
- 11.Hamilton JA. Colony-stimulating factors in inflammation and autoimmunity. Nat Rev Immunol. 2008;8:533–44. doi: 10.1038/nri2356. [DOI] [PubMed] [Google Scholar]
- 12.Satsangi J, Silverberg MS, Vermeire S, Colombel JF. The Montreal classification of inflammatory bowel disease: controversies, consensus, and implications. Gut. 2006;55:749–53. doi: 10.1136/gut.2005.082909. [DOI] [PMC free article] [PubMed] [Google Scholar]
- 13.Drossman DA. The functional gastrointestinal disorders and the Rome III process. Gastroenterology. 2006;130:1377–90. doi: 10.1053/j.gastro.2006.03.008. [DOI] [PubMed] [Google Scholar]
- 14.Aletaha D, Neogi T, Silman AJ, Funovits J, Felson DT, Bingham CO, 3rd, Birnbaum NS, Burmester GR, Bykerk VP, Cohen MD, Combe B, Costenbader KH, Dougados M, Emery P, Ferraccioli G, Hazes JM, Hobbs K, Huizinga TW, Kavanaugh A, Kay J, Kvien TK, Laing T, Mease P, Menard HA, Moreland LW, Naden RL, Pincus T, Smolen JS, Stanislawska-Biernat E, Symmons D, Tak PP, Upchurch KS, Vencovsky J, Wolfe F, Hawker G. Rheumatoid arthritis classification criteria: an American College of Rheumatology/European League Against Rheumatism collaborative initiative. Arthritis. 2010;62:2569–81. doi: 10.1002/art.27584. [DOI] [PubMed] [Google Scholar]
- 15.Weissmuller T, Campbell EL, Rosenberger P, Scully M, Beck PL, Furuta GT, Colgan SP. PMNs facilitate translocation of platelets across human and mouse epithelium and together alter fluid homeostasis via epithelial cell-expressed ecto-NTPDases. J Clin Invest. 2008;118:3682–92. doi: 10.1172/JCI35874. [DOI] [PMC free article] [PubMed] [Google Scholar]
- 16.Pfaffl MW. A new mathematical model for relative quantification in real-time RT- PCR. Nucleic Acids Res. 2001;29:E45–E45. doi: 10.1093/nar/29.9.e45. [DOI] [PMC free article] [PubMed] [Google Scholar]
- 17.Louis NA, Hamilton KE, Kong T, Colgan SP. HIF-dependent induction of apical CD55 coordinates epithelial clearance of neutrophils. Faseb J. 2005:2287–93. doi: 10.1096/fj.04-3251com. In press. [DOI] [PubMed] [Google Scholar]
- 18.Grund B, Sabin C. Analysis of biomarker data: logs, odds ratios, and receiver operating characteristic curves. Curr. 2010;5:473–9. doi: 10.1097/COH.0b013e32833ed742. [DOI] [PMC free article] [PubMed] [Google Scholar]
- 19.Dewilde S, Vercelli A, Chiarle R, Poli V. Of alphas and betas: distinct and overlapping functions of STAT3 isoforms. Front Biosci. 2008;13:6501–14. doi: 10.2741/3170. [DOI] [PubMed] [Google Scholar]
- 20.Cherian S, Moore J, Bantly A, Vergilio JA, Klein P, Luger S, Bagg A. Peripheral blood MDS score: a new flow cytometric tool for the diagnosis of myelodysplastic syndromes. Cytometry B Clin Cytom. 2005;64:9–17. doi: 10.1002/cyto.b.20041. [DOI] [PubMed] [Google Scholar]
- 21.Tortorella C, Simone O, Piazzolla G, Stella I, Antonaci S. Age-related impairment of GM-CSF-induced signalling in neutrophils: role of SHP-1 and SOCS proteins. Ageing Res Rev. 2007;6:81–93. doi: 10.1016/j.arr.2006.10.001. [DOI] [PubMed] [Google Scholar]
- 22.Cho JH. The genetics and immunopathogenesis of inflammatory bowel disease. Nat Rev Immunol. 2008;8:458–66. doi: 10.1038/nri2340. [DOI] [PubMed] [Google Scholar]
- 23.Nikolaus S, Schreiber S. Diagnostics of inflammatory bowel disease. Gastroenterology. 2007;133:1670–89. doi: 10.1053/j.gastro.2007.09.001. [DOI] [PubMed] [Google Scholar]
- 24.Dubinsky MC. Clinical perspectives in Crohn’s disease. Serologic and prognostic biomarkers: who, when, and how? Rev Gastroenterol Disord. 2007;7 (Suppl 2):S3–7. [PubMed] [Google Scholar]
- 25.Melmed GY, Targan SR. Future biologic targets for IBD: potentials and pitfalls. Nat Rev Gastroenterol Hepatol. 2010;7:110–7. doi: 10.1038/nrgastro.2009.218. [DOI] [PubMed] [Google Scholar]


