Abstract
Blood flow restriction (BFR) to contracting skeletal muscle during low-intensity resistance exercise training increases muscle strength and size in humans. However, the mechanism(s) underlying these effects are largely unknown. We have previously shown that mammalian target of rapamycin complex 1 (mTORC1) signaling and muscle protein synthesis (MPS) are stimulated following an acute bout of BFR exercise. The purpose of this study was to test the hypothesis that reactive hyperemia is the mechanism responsible for stimulating mTORC1 signaling and MPS following BFR exercise. Six young men (24 ± 2 yr) were used in a randomized crossover study consisting of two exercise trials: low-intensity resistance exercise with BFR (BFR trial) and low-intensity resistance exercise with sodium nitroprusside (SNP), a pharmacological vasodilator infusion into the femoral artery immediately after exercise to simulate the reactive hyperemia response after BFR exercise (SNP trial). Postexercise mixed-muscle fractional synthetic rate from the vastus lateralis increased by 49% in the BFR trial (P < 0.05) with no change in the SNP trial (P > 0.05). BFR exercise increased the phosphorylation of mTOR, S6 kinase 1, ribosomal protein S6, ERK1/2, and Mnk1-interacting kinase 1 (P < 0.05) with no changes in mTORC1 signaling in the SNP trial (P > 0.05). We conclude that reactive hyperemia is not a primary mechanism for BFR exercise-induced mTORC1 signaling and MPS. Further research is necessary to elucidate the cellular mechanism(s) responsible for the increase in mTOR signaling, MPS, and hypertrophy following acute and chronic BFR exercise.
Keywords: BFR, KAATSU, vascular occlusion training, fractional synthetic rate, resistance exercise
skeletal muscle atrophy is associated with a variety of negative outcomes. Not only is skeletal muscle required for locomotion and posture, but also, its vast amino acid reservoir serves as a critical defense against disease, starvation, malnutrition, injury, or burns (31). In fact, skeletal muscle constitutes between 50% and 75% of total body protein. A decrement of 30% of muscle mass can result in impaired respiration, circulation, and immune function due to muscle weakness and lack of nutrition (31). Thus measures to preserve or increase muscle mass, such as resistance exercise, have gained much attention, especially in clinical and diseased populations. Unfortunately, high-intensity resistance exercise, albeit effective, is not suitable for all populations, including those who are frail; have arthritis, osteoporosis, or ligament injuries; or are undergoing postoperation rehabilitation. When coupled with some of these conditions, high-intensity resistance exercise could lead to increased susceptibility to stress or strain on joints and ultimately, promote unsafe exercise practice. Additionally, there appears to be an age-related decrement in the sensitivity of skeletal muscle to resistance exercise, whereby muscles from older individuals have an attenuated muscle protein anabolic response to exercise (17). Consequently, there is a need to identify novel interventions that can be safely used in such populations to maintain or promote increases in muscle size and strength for the maintenance of muscle function and overall health.
Low-intensity resistance exercise coupled with local vascular occlusion, termed “blood flow restriction (BFR) exercise”, has emerged as a potential rehabilitation tool for individuals unable to withstand high-resistance loads. We have reported that low-intensity exercise with BFR can increase that rate of muscle protein synthesis (MPS) and stimulate mammalian target of rapamycin complex 1 (mTORC1) and MAPK-mediated anabolic signaling (18, 19). These acute anabolic effects may contribute to increased muscle hypertrophy (1–3, 28, 37) and strength (1–3, 16, 28, 33, 37, 50) following BFR exercise training. In contrast, work-matched, low-intensity resistance exercise training without BFR does not increase MPS (18, 19), muscle size (3, 28), or strength (3, 16, 28), but it should be noted that low-intensity exercise carried out to volitional fatigue also stimulates an increase in MPS and anabolic cell signaling (8). Recently, it has been shown that BFR exercise can restore the muscle protein anabolic response in older adults (18). However, the literature on BFR exercise has merely been descriptive or correlational, whereas a mechanistic explanation for how BFR exercise promotes an anabolic environment within skeletal muscle is lacking. Identifying how BFR exercise promotes muscle growth may be helpful in elucidating the mechanisms underlying muscle hypertrophy and may provide an understanding as to why aging appears to be associated with an anabolic impairment for muscle proteins.
We have recently shown that increased blood flow and nutritive delivery are critical for an anabolic stimulus, such as insulin, to increase MPS (38, 39). Our aim was to determine whether reactive hyperemia following BFR exercise plays a major role in stimulating anabolic and catabolic cell signaling and MPS. To test this, we compared the effect of low-intensity exercise with BFR and low-intensity exercise with pharmacologically induced hyperemia on MPS and mTORC1, MAPK signaling, and the ubiquitin proteosome pathway, using a randomized, crossover design in young, healthy men. We hypothesized that pharmacologically induced hyperemia following low-intensity exercise would mimic the muscle protein anabolic effects of BFR exercise.
EXPERIMENTAL PROCEDURES
Subjects
Six young, healthy, recreationally active males (24 ± 2 yr; 181 ± 1 cm; 82 ± 5 kg) volunteered for this study. Each subject gave written, informed consent before participating in the study, which was approved by the Institutional Review Board of the The University of Texas Medical Branch. Screening was performed with clinical history and physical exams, ECG, and laboratory tests, including complete blood count with differential liver, kidney, and thyroid function tests; coagulation profile; fasting blood glucose; oral glucose-tolerance test; hepatitis B and C screening; human immunodeficiency virus test; urinalysis; and drug screening. A variety of anthropometric measurements were taken, along with a Dual Energy X-Ray Absorptiometry scan (QDR-4500W, Hologic, Bedford, MA) and a one-repetition-maximum (1RM) leg-extension strength test. The strength test was performed on two occasions (>5 days apart) on a bilateral leg-extension machine (Cybex VR2, Cybex International, Medway, MA), located in the Institute for Translational Sciences Clinical Research Center (ITS-CRC) Exercise Laboratory, The University of Texas Medical Branch (Galveston, TX). The strength test consisted of an initial warm-up phase, with the subject performing 10 repetitions at a moderate weight to get acclimated with the machine. Following the warm-up, subjects attempted to complete one repetition of the leg-extension exercise at progressively greater resistance until a full repetition could no longer be performed. The weight of the last complete, unassisted repetition was recorded as the 1RM. The highest weight achieved from the two strength tests was deemed their 1RM. Any subjects who lifted the entire weight stack during the strength test would continue repetitions to complete failure. In this case, the 1RM would be calculated by the formula: 1RM = W/1.0138 − (0.0267123) (R), where “W” represents the weight lifted in kilograms and “R” represents the number of successive repetitions (25). The average 1RM was 135 ± 16 kg.
Study Design
Each subject was randomized to initially undergo one of two treatments: 1) low-intensity exercise with BFR or 2) low-intensity exercise followed by pharmacologically induced hyperemia using the vasodilator, sodium nitroprusside (SNP). At least 3 wk were allowed between trials.
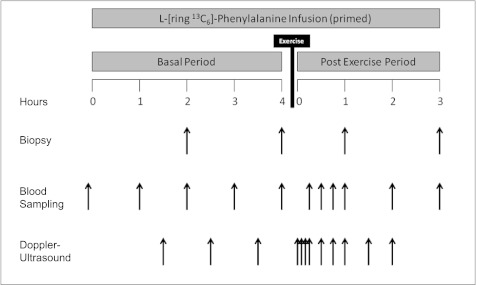
On both occasions, the subjects were admitted to the ITS-CRC the evening before the exercise study. They were fed a standard research dinner (10 kcal/kg body wt; 60% carbohydrate, 20% fat, and 20% protein) and snack before 10 p.m. They were fasted overnight under basal conditions and were given ad libitum access to water. The morning of the study at 6 a.m., a polyethylene catheter was inserted into an antecubital vein for tracer infusion, and another polyethylene catheter was inserted retrogradely into a hand vein of the opposite arm and kept under a heating pad for arterialized blood sampling. After drawing a background blood sample, a primed, continuous infusion of l-[ring-13C6] phenylalanine (Isotec, Sigma-Aldrich, Miamisburg, OH) was begun and maintained at a constant rate until the end of the experiment (Fig. 1.) The priming dose for the labeled phenylalanine was 2 μmol/kg, and the infusion rate was 0.05 μmol·kg−1·min−1.
Fig. 1.
Infusion study protocol. Doppler ultrasound measurements; blood and muscle samples are indicated by arrows. The study design was identical for both groups.
Exercise.
After a 4-h basal period, subjects were transported from the bed to the leg-extension exercise machine, where they performed four sets of bilateral leg extensions at 20% of their 1RM. The four sets consisted of 30, 15, 15, and 15 repetitions, respectively, with 30 s of rest between sets. Verbal encouragement was used to ensure each subject completed the full exercise protocol. Blood pressure and heart rate were measured and recorded immediately before and after exercise.
BFR trial.
Immediately prior to the commencement of exercise, subjects performing the BFR trial were fitted with 11 cm-wide pressure cuffs (SC10, Hokanson, Bellevue, WA), placed on the most proximal portion of the upper thighs and attached to a Hokanson E20 rapid cuff inflater and AG101 air source. Subjects were gradually acclimated to the pressure cuff in increments of 20 mmHg, starting at 120 mmHg, to a final pressure of 200 mmHg. During the acclimation phase, each increment consisted of 30 s of pressure, followed by 10 s of no pressure. Exercise commenced once the final pressure of 200 mmHg was reached. The pressure was not released until the completion of the final set of exercise. Reactive hyperemia occurs immediately after the cuff pressure is released; therefore, the subjects were promptly moved back into bed to capture the postexercise blood flow response using Doppler ultrasound.
SNP trial.
This group was designed to mimic the reactive hyperemia induced following BFR exercise by pharmacologically vasodilating the femoral artery after low-intensity resistance exercise performed without BFR. During this trial only, a polyethylene catheter was placed in the common femoral artery of the same leg designated for muscle sampling and blood flow measurements. Prior to exercise, SNP was prepared with a concentration of 4 mg/60 ml in a syringe and connected to the femoral artery catheter. Following completion of the identical exercise protocol without BFR, SNP was infused into the femoral artery for 1 h, initially at a rate of 0.14 μg·100 ml−1·min−1 of leg volume and then modified based on blood flow measurements to closely simulate the average reactive hyperemic response from BFR exercise. As a precaution, heart rate and blood pressure were closely monitored from the femoral artery catheter and at the brachial artery for the duration of the 1-h SNP infusion.
Muscle sampling.
The muscle biopsies were performed with a 5-mm Bergström biopsy needle, using sterile procedures and local anesthesia (1% lidocaine). Prior to exercise, two muscle biopsies were obtained from the lateral portion of the vastus lateralis muscle between 15 and 25 cm superior to the mid-patella (Fig. 1). The first biopsy was collected 2 h after the initiation of the tracer infusion to allow for steady-state enrichments and again, 2 h later to determine basal mixed-muscle fractional synthetic rate (FSR). Both biopsies were sampled from a common incision, although the orientation of the needle was angled so that samples were taken ∼5 cm from each other. The third and fourth biopsies were taken 1 and 3 h postexercise from a second incision site, proximal to the first incision on the same leg. Our laboratory has demonstrated that sequential biopsies from the same incision do not interfere with MPS measurements (42). Muscle tissue was blotted immediately, frozen in liquid nitrogen, and stored at −80°C until analysis. Right and left legs were randomly assigned to either trial; the opposing leg was used when crossing over to the other trial.
Blood flow measurements.
Three blood flow measurements were conducted during the basal period and averaged together to establish a pre-exercise basal blood flow value. Flow measurements were taken 3 min after the completion of exercise to allow time to remove the BFR apparatus and allow the subject to return to bed. Subsequent measurements were made every minute during the first 15-min period to capture the immediate vascular response to BFR exercise. Thereafter, measurements were taken every 15 min for the remainder of the 1st h postexercise, and additional measurements were made at 90 and 120 min postexercise to verify blood flow had returned to baseline. Blood flow measurements were performed on the same leg where the muscle biopsies were taken.
Femoral artery blood flow (Q) was determined using a two-dimensional Doppler ultrasound machine (HDI-500 ultrasound system, Philips ATL Ultrasound, Andover, MA). Online calipers were used to measure the diameter (d) of the longitudinal view of the femoral artery in quadruplicate with a high-definition zoom image. Additionally, the time-averaged mean velocity (TAM) was determined using pulsed-wave Doppler with angle correction and analysis software. Femoral artery blood flow was calculated by the formula: Q = TAM·π(d/2)2.
Mixed-Muscle Protein FSR
Muscle intracellular-free amino acids and muscle proteins were extracted as described previously (43, 44). Muscle intracellular-free concentration and enrichment of phenylalanine were determined by GC-MS (6890 Plus GC, 5973N mass selective detector, 7683 Autosampler, Agilent Technologies, Santa Clara, CA) using an appropriate internal standard (l-[15N]phenylalanine) (43, 44). Mixed-muscle, protein-bound phenylalanine enrichment was analyzed by GC-MS after protein hydrolysis and amino acid extraction with the external standard curve approach (9). The FSR of mixed-muscle proteins was calculated by measuring the incorporation rate of the phenylalanine tracer into the proteins (ΔEp/t) and using the precursor-product model to calculate the synthesis rate: FSR = (ΔEp/t)/(EM1 + EM2/2)·60·100, where ΔEp is the increment in protein-bound phenylalanine enrichment between two biopsies, t is the time between the two biopsies, and EM1 and EM2 are the phenylalanine enrichments in the free intracellular pool in the two biopsies. Data are expressed as percent/h.
Blood sampling.
Arterialized blood was collected from the retrograde hand catheter 12 times during the study (Fig. 1). Each time, 9 ml was aliquoted for analysis of plasma glucose and lactate (Yellow Springs Instruments, Yellow Springs, OH) and for the determination of the enrichment of labeled phenylalanine in blood using GC-MS. Phenylalanine concentration was calculated using an internal standard approach, as described by Wolfe and Chinkes (49), and nutrient delivery was calculated by (blood concentration) × (femoral arterial blood flow).
SDS-PAGE and Western Blot Analysis
Details of the immunoblotting procedures have been published previously (11). Briefly, ∼30–50 mg frozen tissue was homogenized (1:9 wt/vol) and centrifuged at 6,000 RPM for 10 min at 4°C, followed by the removal of the supernatant. Total protein concentrations were determined in supernatant by using a Bradford assay (SmartSpec Plus spectrophotometer, Bio-Rad, Hercules, CA). The supernatant was diluted (1:1) in a sample buffer mixture containing 125 mM Tris (pH 6.8), 25% glycerol, 2.5% SDS, 2.5% β-mercaptoethanol, and 0.002% bromphenol blue and then boiled for 3 min at 100°C. Total protein (50 μg) was loaded into each lane of a 7.5% or 15% polyacrylamide gel (Criterion, Bio-Rad), along with a molecular weight marker (Precision Plus Protein standard, Bio-Rad), and separated by electrophoresis at 150V for 60 min. Protein was then transferred to a polyvinylidene difluoride membrane (Bio-Rad) at 50V for 60 min. Blots were blocked in Tris-buffered saline with Tween 20 and 5% nonfat dairy milk and then incubated in a single primary antibody overnight at 4°C (antibody concentrations are described below). The next day, blots were incubated in anti-rabbit IgG horseradish peroxidase-conjugated secondary antibody (Amersham Biosciences, Piscataway, NJ) for 1 h at room temperature. Chemiluminescent solution (ECL plus, Amersham Biosciences) was applied to each blot for 5 min, optical density measurements were obtained with a phosphoimager (Bio-Rad), and densitometric analysis was performed with Quantity One software (version 4.5.2, Bio-Rad). Data are expressed as the fold change from baseline.
Antibodies.
The following primary antibodies were purchased from Cell Signaling Technology (Danvers, MA) and diluted in 5% BSA: phospho-mTOR (Ser2448, 1:500), phospho-p70 S6 kinase 1 (S6K1; Thr389, 1:250), phospho-ribosomal protein S6 (rpS6; Ser240/244, 1:250), phospho-eukaryotic initiation factor 4E-binding protein 1 (4E-BP1; Thr37/46, 1:1,000), phospho-MAPK-interacting kinase 1 (Mnk1; Thr197/202, 1:500), phospho-ERK1/2 (Thr202/Tyr204, 1:1,000), phospho-eukaryotic elongation factor 2 (eEF2; Thr56, 1:2,000), and phospho-Akt (Thr308, 1:1,000). The following primary antibodies were purchased from ECM Biosciences (Versailles, KY) and diluted in 1% nonfat dairy milk in Tris-buffered saline with Tween 20: muscle atrophy F-box protein-1 (Atrogin1; 1:1,000) and muscle really interesting new gene finger protein-1 (MuRF1; 1:1,000).
Gene Expression
Details of RNA isolation, cDNA synthesis, and real-time quantitative PCR have been described previously (15). Briefly, 20–30 mg muscle was homogenized in 1 ml Tri Reagent (Molecular Research Center, Cincinnati, OH), separated using 0.2 ml chloroform, precipitated using 0.5 ml isopropanol, and washed with 75% ethanol. RNA concentration was determined using the NanoDrop 2000 spectrophotometer (Thermo Fisher Scientific, Wilmington, DE). To eliminate any potential DNA contamination, all samples were treated with DNase, using a commercially available kit (DNA-free, Ambion, Life Technologies, Grandisland, NY), according to the manufacturer's directions. RNA templates were reverse transcribed into cDNA, and all isolated RNA and cDNA samples were stored at −80°C until analysis. Primer sequences used in this experiment have been published previously by Drummond et al. (14). GAPDH was used as a housekeeping gene, as it remained stable across time and after exercise for both trials. Real-time RT-PCR was performed using an iQ5 Multicolor Real-Time PCR cycler (Bio-Rad), using SYBR Green fluorescence (iQ SYBR Green Supermix, Bio-Rad). Relative fold changes were determined using the 2−ΔΔCt method, as described by Livak and Schmittgen (26) using the equation Fold = 2(Ct target gene − Ct housekeeping gene) (time x) − (Ct mean target gene − Ct mean housekeeping gene) (baseline).
Statistical Analysis
All values are expressed as means ± SE. Comparisons were performed using a two-way ANOVA with repeated measures, and the effects were trial (BFR, SNP) and time. Post hoc analysis was performed with Bonferroni when appropriate. Natural log transformations were performed to establish normality where necessary. Significance was set at P ≤ 0.05. All analyses were done with SigmaStat 11.0 (Systat Software, San Jose, CA).
RESULTS
Cardiovascular Response
There were no significant differences in exercise heart rate (96 ± 10 vs. 94 ± 13), systolic pressure (143 ± 6 vs. 125 ± 8), or diastolic pressure (71.5 ± 4.5 vs. 71 ± 5) between BFR and SNP trials, respectively (P > 0.05). Heart rate increased significantly from rest only in the BFR exercise group (P < 0.05; data not shown). Blood pressure and heart rate were monitored continuously during the SNP infusion with no significant fluctuations observed for any of the subjects.
Blood Flow Response
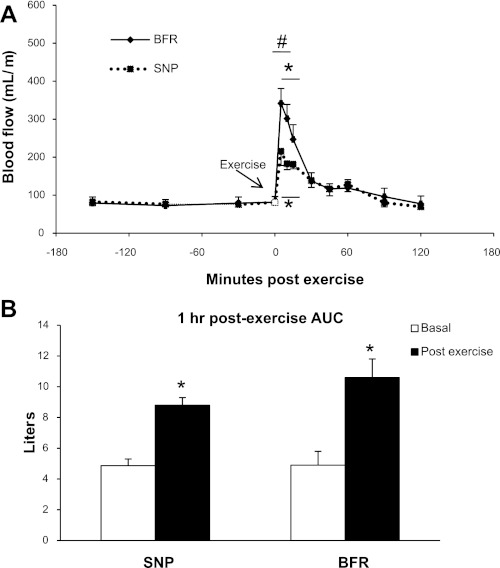
Femoral artery blood flow was elevated significantly postexercise during both trials (P < 0.05). Blood flow remained elevated significantly above basal values in both groups at 5, 10, and 15 min postexercise (P < 0.05; Fig. 2A). SNP infusion increased blood flow immediately postexercise; however, the initial response in the BFR trial was greater than in the SNP trial for the first 10 min postexercise (P < 0.05). On the other hand, the total blood flow was not different (P > 0.05) between trials, as calculated by the area under the blood flow response curve for 1 h (Fig. 2B) and 2 h postexercise (data not shown).
Fig. 2.
A: femoral artery blood flow measured by Doppler ultrasound. Data are presented as ml/min. Error bars represent SE. *P < 0.05 vs. baseline; #P < 0.05 vs. sodium nitroprusside (SNP). Open symbol represents the cumulative, average basal blood flow as a reference point prior to exercise. BFR, Blood flow restriction. B: total femoral arterial blood flow within the 1st h following exercise, as calculated by the blood flow rate area under the curve (AUC). Presented as liters of blood through the femoral artery over the hour. Error bars represent SE. *P < 0.05 vs. baseline.
Arterialized Plasma Concentrations
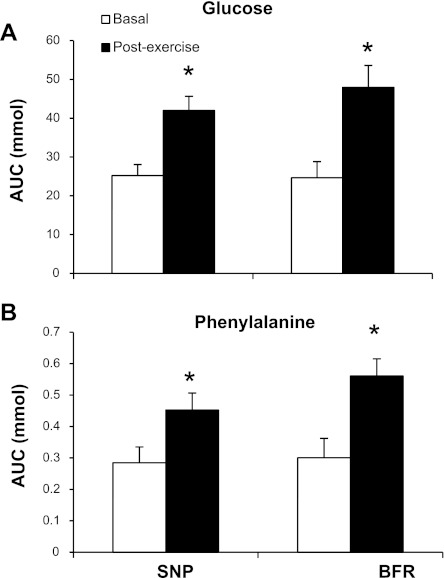
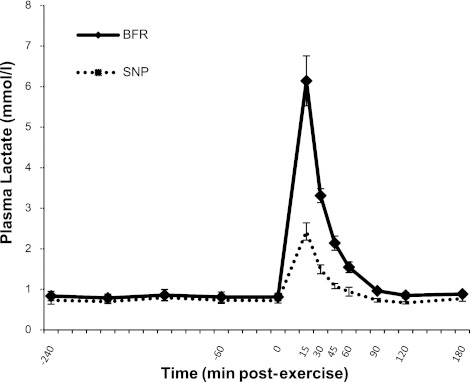
Glucose (Fig. 3A) and phenylalanine (Fig. 3B) delivery (substrate concentration × blood flow) increased significantly during the 1st h following exercise in both trials, as determined by the area under each delivery curve (P < 0.05). There were no differences between trials for either glucose or phenylalanine delivery. The plasma lactate concentration increased by 3.3-fold following exercise, relative to basal values during the SNP trial, and remained elevated for 45 min (P < 0.05). Plasma lactate during the BFR trial increased by 7.3-fold following exercise, relative to basal values, and remained elevated above baseline for 1 h postexercise (P < 0.05). Plasma lactate concentrations during the BFR trial were significantly greater compared with the SNP trial for 90 min postexercise (P < 0.05; Fig. 4).
Fig. 3.
A: total glucose delivery (blood glucose × blood flow) within the 1st h postexercise, as calculated by the glucose delivery AUC. Presented as mmol of glucose through the femoral artery over the hour. Error bars represent SE. *P < 0.05 vs. baseline. B: total phenylalanine delivery (blood phenylalanine × blood flow) within the 1st h postexercise, as calculated by the phenylalanine delivery AUC. Presented as mmol of phenylalanine through the femoral artery over the hour. Error bars represent SE. *P < 0.05 vs. baseline.
Fig. 4.
Plasma lactate concentrations. Data are presented as mmol/l. Error bars represent SE. At 15 min, 30 min, and 45 min postexercise, lactate values were significantly greater than basal and between trials (P < 0.05). At 1 h postexercise, plasma lactate was still elevated above basal during the BFR trial and was higher during the BFR trial than the SNP trial (P < 0.05). At 1.5 h postexercise, plasma lactate was not different from basal (P > 0.05), although lactate concentrations during the BFR trial were higher than the SNP trial (P < 0.05). No other time or group differences were detected (P > 0.05).
MPS
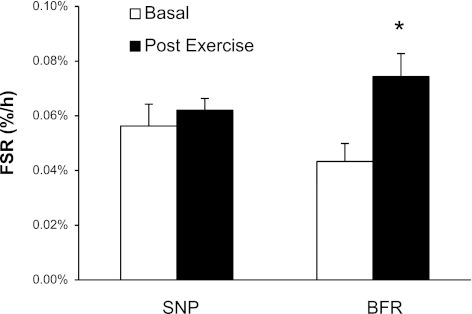
Mixed-muscle protein FSR was not different between trials at basal (P > 0.05). FSR, during the 3-h postexercise, was elevated above basal, only during the BFR trial (P < 0.05; Fig. 5).
Fig. 5.
Mixed-muscle fractional synthetic rate (FSR) at baseline and 3 h postexercise. Presented in %/h. Error bars represent SE. *P < 0.05 vs. baseline; #P < 0.05 vs. SNP.
Anabolic and catabolic cell signaling
mTORC1 signaling.
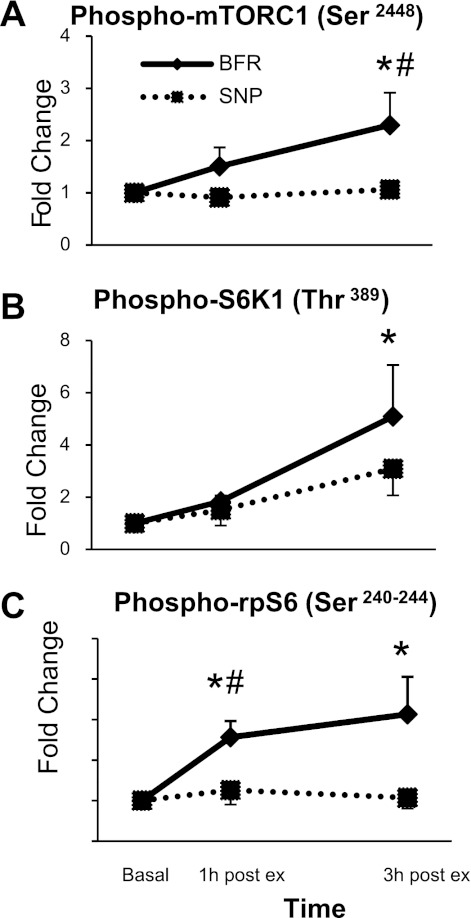
Phosphorylation of Akt at Thr308 was higher at 1 h postexercise during the BFR trial compared with baseline (P < 0.05; Table 1). Akt phosphorylation did not increase during the SNP trial at any time point (P > 0.05). Phosphorylation of mTOR at Ser2448 was greater at 3 h postexercise in the BFR trial compared with the SNP trial and basal values (P < 0.05; Fig. 6A). Phosphorylation of mTOR did not increase at any time point during the SNP trial (P > 0.05). Phosphorylation of S6K1 at Thr389 was elevated above basal at 3 h postexercise during the BFR trial (P < 0.05; Fig. 6B). S6K1 phosphorylation did not increase at any time point during the SNP trial (P > 0.05). Phosphorylation of rpS6 at Ser235/236 was elevated above basal at 1 h postexercise during the BFR trial and was greater compared with the SNP trial (P < 0.05). rpS6 phosphorylation remained elevated above basal at 3 h postexercise during the BFR trial (P < 0.05; Fig. 6C). Phosphorylation of rpS6 at 1 and 3 h postexercise did not change from basal during the SNP trial (P > 0.05). Phosphorylation of 4E-BP1 at Thr37/46 did not change during either trial, 1 h postexercise (P > 0.05); however, phosphorylation of 4E-BP1 was slightly reduced at 3 h postexercise during the SNP trial (P < 0.05; Table 1). Phosphorylation of eEF2 at Thr56 remained unchanged during both trials for the duration of the study (Table 1).
Table 1.
Protein phosphorylation and expression during postexercise recovery
| 1 h Post | 3 h Post | |
|---|---|---|
| Akt /mTORC1 signaling | ||
| Akt (Thr308) | ||
| BFR | 1.29 ± 0.05* | 1.12 ± 0.11 |
| SNP | 1.20 ± 0.06 | 0.79 ± 0.08 |
| 4E-BP1 (Thr37/46) | ||
| BFR | 0.87 ± 0.15 | 0.83 ± 0.13 |
| SNP | 1.02 ± 0.15 | 0.66 ± 0.10* |
| eEF2 (Thr56) | ||
| BFR | 1.33 ± 0.44 | 0.90 ± 0.10 |
| SNP | 1.01 ± 0.24 | 0.98 ± 0.12 |
Data are from Western blot analyses, presented as fold change from baseline. mTORC1, mammalian target of rapamycin complex 1; BFR, blood flow restriction; SNP, sodium nitroprusside; 4E-BP1, 4E-binding protein 1; eEF2, eukaryotic elongation factor 2.
P < 0.05 vs. baseline.
Fig. 6.
Protein phosphorylation during postexercise (post ex) recovery of the mammalian target of rapamycin complex 1 (mTORC1) pathway from Western blot analysis (A), S6 kinase 1 (S6K1; B), and ribosomal protein S6 (rpS6; C). Presented as a fold change from baseline. *P < 0.05 vs. baseline; #P < 0.05 vs. SNP.
MAPK signaling.
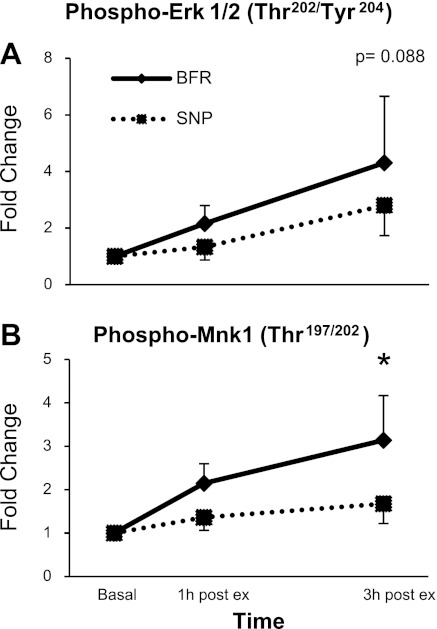
There was a tendency for an increase in phosphorylation of ERK1/2 at Thr202/Tyr204, 3 h postexercise during the BFR trial compared with basal (P = 0.088; Fig. 7A). Phosphorylation of Mnk1 at Thr197/202 was higher at 3 h postexercise during the BFR trial compared with basal (P < 0.05; Fig. 7B). Phosphorylation of ERK1/2 or Mnk1 was not different at any time point during the SNP trial (P > 0.05).
Fig. 7.
Protein phosphorylation during postexercise recovery of the MAPK pathway from Western blot analysis. Presented as a fold change from baseline. Mnk1, MAPK-interacting kinase 1. *P < 0.05 vs. baseline; #P < 0.05 vs. SNP.
E3 ligases.
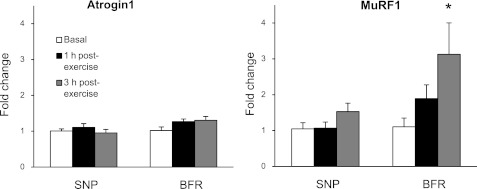
Atrogin1 and MuRF1 protein expression did not change in either trial at any time point during the study (Table 1), although the mRNA expression of MuRF1 was increased at 3 h postexercise during the BFR trial (P < 0.05; Fig. 8). Atrogin1 mRNA expression was not different at any time point during either trial (P > 0.05; Fig. 8).
Fig. 8.
mRNA expression of the E3 ligases during postexercise recovery. Presented as fold change from baseline using the 2−ΔΔCt method. Atrogin1, atrophy F-box protein-1; MuRF1, muscle really interesting new gene finger protein-1. *P < 0.05 vs. baseline.
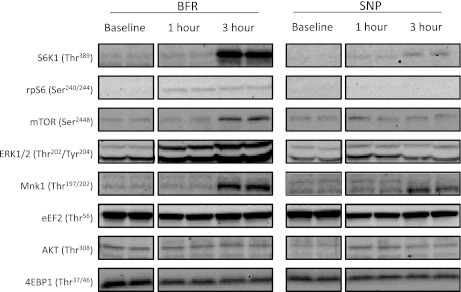
Representative blots for each protein are displayed in Fig. 9.
Fig. 9.
Representative Western blots for all proteins measured. eEF2, eukaryotic elongation factor 2; 4EPB1, 4E-binding protein 1.
DISCUSSION
The purpose of the study was to ascertain whether reactive hyperemia is a primary mechanism to induce muscle growth. We simulated the reactive hyperemic response from BFR exercise using a pharmacological vasodilator, SNP, following nonrestricted, low-intensity exercise and compared the acute metabolic responses with traditional BFR exercise. To our knowledge, this study is the first investigation designed to test a proposed mechanistic hypothesis of the anabolic response to BFR exercise. With the use of this approach, we were able to demonstrate that whereas BFR exercise elicits an increase in MPS and anabolic signaling, a hyperemic response is not sufficient to induce these stimulatory responses when coupled with low-intensity exercise.
Specifically, we were successful in our ability to simulate the overall reactive hyperemic response of BFR exercise using SNP, although it is important to note that whereas the overall 1-h elevation in leg blood flow was accurately reproduced, the immediate post-BFR exercise response (the first 10 min) was more difficult to reproduce precisely. Thus a limitation to the study is the inability to ascertain whether the initial peak blood flow response (first 10 min) is responsible for the BFR-induced MPS. However, although the BFR trial elicited a higher initial peak in blood flow, the total blood flow and nutrient delivery during the 1st h were not different between trials. Thus we were capable of determining whether the total postexercise increase in blood flow and the concomitant increase in nutritive delivery are responsible for the anabolic effects of BFR exercise. Despite the equivalent increase in blood flow, BFR exercise elicited a 49% increase in the 3-h postexercise FSR response, whereas the SNP-induced hyperemia, following low-intensity exercise, did not change the postexercise FSR response from basal values. The increase in FSR due to BFR exercise is comparable with previous research with BFR exercise (18, 19) and traditional, high-intensity resistance exercise (17). Likewise, the increase in FSR was associated with an increase in mTORC1 and MAPK pathway activation. Both of these pathways are widely accepted to be regulators of the rate-limiting steps of protein translation following resistance exercise (12, 45, 48); however, the relative contributions of each are unknown. An increase in extracellular amino acid availability is known to stimulate mTORC1 pathway activation (4, 5), a process required for an increase in MPS, induced via amino acid supplementation (10). Furthermore, extensive research has shown that increased amino acid availability (44), in conjunction with carbohydrates (20) or coupled with resistance exercise (6, 7, 32, 35, 40, 41), increases MPS to a greater extent compared with resistance exercise alone. However, a major finding of this study is that an increased amino acid delivery through hyperemia is not sufficient to stimulate an anabolic response or increase mTORC1 activation. Whereas the mTORC1 pathway has been shown to be indispensible in stimulating MPS following high-intensity resistance exercise (13) and nutritional supplementation (10), it is still unclear whether BFR exercise follows the same pattern and requires mTORC1 activation or whether a unique pathway is used, possibly relying heavier on MAPK pathway activation.
Although emphasis typically is placed on protein anabolic processes, overall muscle growth occurs when protein synthesis rates over time are higher compared with the average rate of protein breakdown. Thus understanding muscle degradation is important from not only a growth standpoint but also a therapeutic perspective. Of the catabolic processes, the proteasomal system plays a key role and involves the E3 ligases: Atrogin1 and MuRF1. Muscle proteins are targeted for degradation by these ligases and directed to the 26S proteasome through polyubiquitination (36). A study analyzing the time course of proteolytic gene expression demonstrated that the mRNA levels of MuRF1 but not Atrogin1 are elevated following high-intensity resistance exercise and endurance exercise between 1 and 4 h postexercise, after which, values are returned to basal conditions (27). A concurrent increase in protein synthesis and proteolysis is thought to be beneficial to enhance muscle quality via an overall increase in muscle protein turnover, as opposed to a futile counteraction (36). Accordingly, in a previous study, we have demonstrated that the mRNA transcript of MuRF1 increases 3 h post-BFR exercise (14). Therefore, a secondary aim of our research was to investigate whether reactive hyperemia exerts any influence on the transcription of the E3 ligases. Data in the current study confirm a similar increase in MuRF1 compared with our previous study and also indicate that reactive hyperemia was insufficient to induce any changes in MuRF1 and Atrogin1. Recently, Manini et al. (30) showed a decrease in Atrogin1 and MuRF1 mRNA expression, 8 h after BFR exercise, when fed a standard meal. This does not necessarily contradict our study, considering the differences between protocols. Variations in results are mostly likely due to the differing nutritional status of subjects and the time points analyzed. To date, no research has analyzed the muscle protein fractional breakdown rate post-BFR exercise. Therefore, these results are only an initial look into the catabolic events following BFR exercise.
Although reactive hyperemia is not the primary mechanism involved in the acute anabolic or catabolic responses from BFR exercise, specifically in the young-adult population, it certainly does not rule out the possibility that enhanced blood flow is required as a supplementary variable. Evidence shows that there is an age-related decline in anabolic sensitivity to traditional, high-intensity resistance exercise (17, 24). Most recently, we have shown that older subjects have a reduced ability to activate MPS and mTORC1 signaling after traditional, high-intensity resistance exercise compared with younger subjects (17). Interestingly, BFR exercise has been shown to elicit similar increases in MPS in both young (19) and older subjects (18), indicating that BFR exercise is capable of restoring the normal muscle protein anabolic response following exercise in older adults. Research from our laboratory has found a positive correlation between an increase in blood flow and the response to an anabolic stimulus (38, 39), which could potentially explain the age-related difference in responses, since older adults naturally have a compromised endothelial responsiveness (21, 22, 34). Recently, we demonstrated that the restoration of blood flow in older adults rescued the age-related decline in the muscle protein anabolic response to insulin (39). We also reported that increased blood flow was required for young subjects to elicit a full muscle protein anabolic response to insulin (38). Together, data in these previous studies suggest that hyperemia is a crucial component to a maximal response in MPS when coupled to an anabolic stimulus. This evidence encourages the speculation that reactive hyperemia from BFR exercise supersedes the compromised endothelial responsiveness in the elderly and thereby eliminates the age-related differences in anabolic responses to resistance exercise. Future research is needed to further explore the necessity of hyperemia to induce an anabolic response from BFR exercise.
As suggested in a review by Wernbom et al. (46), it is likely that BFR exercise responses are caused by multiple mechanisms. In the current study, BFR exercise triggered a pronounced, 7.3-fold increase in lactic acid production, which may be the cause and/or the effect of early muscle fatigue, leading to enhanced fiber recruitment (29, 30, 37). Particularly, hydrogen ion accumulation via lactic acid may potentially act as an allosteric regulator in other pathways that alter MPS. Research by Burd et al. (8) has demonstrated that exercise to volitional fatigue at any intensity is sufficient to stimulate an increase in MPS. Indeed, BFR exercise may simply be an accelerated method to induce muscle fatigue and therefore, produce similar results, as suggested by Burd et al. (8). However, unlike BFR exercise, low-intensity exercise until fatigue has not been tested to increase muscle hypertrophy and strength with training. Clearly, muscle fatigue is associated with evidence of muscle growth, although the role it plays is not clearly understood. It should not be overlooked, however, that despite an increase in MPS following these unique training regimes, the physiological adaptation on a functional level may still be different. For instance, in a 12-wk training study, Holm et al. (23) discovered that 10 sets of 36 repetitions at 15.5% 1RM were sufficient to increase muscle cross-sectional area but also resulted in a loss of myosin heavy chain type IIx. Furthermore, although electromyography data suggest that all motor units are recruited prior to fatigue (47), it is unknown what physiological differences still exist within fiber types when fatiguing exercises occur at different intensities.
In summary, we have demonstrated that BFR exercise elicits a dramatic increase in blood flow postexercise, which enhances nutrient delivery to the working muscles. Furthermore, we have established that enhanced nutrient delivery does not appear to be the primary mechanism responsible for the stimulation of mTORC1 signaling and MPS following BFR exercise. Future studies are needed to determine the precise mechanisms responsible for stimulating MPS and promoting growth following BFR exercise and whether mTORC1 activation is required.
GRANTS
Support for this study was provided by grants from National Institute of Arthritis and Musculoskeletal and Skin Diseases AR049877, National Institute on Aging P30 AG024832, National Institute of Child Health and Human Development T32-HD07539, and National Center for Advancing Translation Sciences 1UL1RR029873-01.
AUTHOR CONTRIBUTIONS
Author contributions: D.M.G., E.V., and B.B.R. conception and design of research; D.M.G., C.S.F., J.M.D., D.K.W., K.L.T., M.J.D., E.V., and B.B.R. performed experiments; D.M.G., C.S.F., J.M.D., D.K.W., K.L.T., M.J.D., E.V., and B.B.R. analyzed data; D.M.G., K.L.T., M.J.D., E.V., and B.B.R. interpreted results of experiments; D.M.G. and B.B.R. prepared figures; D.M.G. and B.B.R. drafted manuscript; D.M.G., C.S.F., J.M.D., D.K.W., K.L.T., M.J.D., and B.B.R. edited and revised manuscript; D.M.G., C.S.F., J.M.D., D.K.W., K.L.T., M.J.D., E.V., and B.B.R. approved final version of manuscript.
DISCLOSURES
No conflicts of interest, financial or otherwise, are declared by the authors.
ACKNOWLEDGMENTS
We thank Shaheen Dhanani, Jennifer Timmerman, and the CRC nurses for their assistance in screening admitting and assisting with the subjects during data collection. We also thank Shelley Medina, Ming-Qian Zheng, and Junfung Hao for technical assistance.
REFERENCES
- 1. Abe T, Kearns CF, Sato Y. Muscle size and strength are increased following walk training with restricted venous blood flow from the leg muscle, Kaatsu-walk training. J Appl Physiol 100: 1460–1466, 2006 [DOI] [PubMed] [Google Scholar]
- 2. Abe T, Sakamaki M, Fujita S, Ozaki H, Sugaya M, Sato Y, Nakajima T. Effects of low-intensity walk training with restricted leg blood flow on muscle strength and aerobic capacity in older adults. J Geriatr Phys Ther 33: 34–40, 2010 [PubMed] [Google Scholar]
- 3. Abe T, Sato Y, Inoue K, Midorikawa T, Yasuda T, Kearns CF, Koizumi K, Ishii N. Muscle size and IGF-1 increased after two weeks of low-intensity “Kaatsu” resistance training. Med Sci Sports Exerc 36: S353–S353, 2004 [Google Scholar]
- 4. Avruch J, Long X, Ortiz-Vega S, Rapley J, Papageorgiou A, Dai N. Amino acid regulation of TOR complex 1. Am J Physiol Endocrinol Metab 296: E592–E602, 2009 [DOI] [PMC free article] [PubMed] [Google Scholar]
- 5. Beugnet A, Tee AR, Taylor PM, Proud CG. Regulation of targets of mTOR (mammalian target of rapamycin) signalling by intracellular amino acid availability. Biochem J 372: 555–566, 2003 [DOI] [PMC free article] [PubMed] [Google Scholar]
- 6. Borsheim E, Aarsland A, Wolfe RR. Effect of an amino acid, protein, and carbohydrate mixture on net muscle protein balance after resistance exercise. Int J Sport Nutr Exerc Metab 14: 255–271, 2004 [DOI] [PubMed] [Google Scholar]
- 7. Borsheim E, Tipton KD, Wolf SE, Wolfe RR. Essential amino acids and muscle protein recovery from resistance exercise. Am J Physiol Endocrinol Metab 283: E648–E657, 2002 [DOI] [PubMed] [Google Scholar]
- 8. Burd NA, West DW, Staples AW, Atherton PJ, Baker JM, Moore DR, Holwerda AM, Parise G, Rennie MJ, Baker SK, Phillips SM. Low-load high volume resistance exercise stimulates muscle protein synthesis more than high-load low volume resistance exercise in young men. PLoS One 5: e12033, 2010 [DOI] [PMC free article] [PubMed] [Google Scholar]
- 9. Calder AG, Anderson SE, Grant I, McNurlan MA, Garlick PJ. The determination of low D5-phenylalanine enrichment (0.002–0.09 atom percent excess), after conversion to phenylethylamine, in relation to protein turnover studies by gas chrommatography/electron ionization mass spectrometry. Rapid Commun Mass Spectrom 6: 421–424, 1992 [DOI] [PubMed] [Google Scholar]
- 10. Dickinson JM, Fry CS, Drummond MJ, Gundermann DM, Walker DK, Glynn EL, Timmerman KL, Dhanani S, Volpi E, Rasmussen BB. Mammalian target of rapamycin complex 1 activation is required for the stimulation of human skeletal muscle protein synthesis by essential amino acids. J Nutr 141: 856–862, 2011 [DOI] [PMC free article] [PubMed] [Google Scholar]
- 11. Dreyer HC, Fujita S, Cadenas JG, Chinkes DL, Volpi E, Rasmussen BB. Resistance exercise increases AMPK activity and reduces 4E-BP1 phosphorylation and protein synthesis in human skeletal muscle. J Physiol 576: 613–624, 2006 [DOI] [PMC free article] [PubMed] [Google Scholar]
- 12. Drummond MJ, Dreyer HC, Fry CS, Glynn EL, Rasmussen BB. Nutritional and contractile regulation of human skeletal muscle protein synthesis and mTORC1 signaling. J Appl Physiol 106: 1374–1384, 2009 [DOI] [PMC free article] [PubMed] [Google Scholar]
- 13. Drummond MJ, Fry CS, Glynn EL, Dreyer HC, Dhanani S, Timmerman KL, Volpi E, Rasmussen BB. Rapamycin administration in humans blocks the contraction-induced increase in skeletal muscle protein synthesis. J Physiol 587: 1535–1546, 2009 [DOI] [PMC free article] [PubMed] [Google Scholar]
- 14. Drummond MJ, Fujita S, Takash A, Dreyer HC, Volpi E, Rasmussen BB. Human muscle gene expression following resistance exercise and blood flow restriction. Med Sci Sports Exerc 40: 691–698, 2008 [DOI] [PMC free article] [PubMed] [Google Scholar]
- 15. Drummond MJ, Miyazaki M, Dreyer HC, Pennings B, Dhanani S, Volpi E, Esser KA, Rasmussen BB. Expression of growth-related genes in young and older human skeletal muscle following an acute stimulation of protein synthesis. J Appl Physiol 106: 1403–1411, 2009 [DOI] [PMC free article] [PubMed] [Google Scholar]
- 16. Evans C, Vance S, Brown M. Short-term resistance training with blood flow restriction enhances microvascular filtration capacity of human calf muscles. J Sports Sci 28: 999–1007, 2010 [DOI] [PubMed] [Google Scholar]
- 17. Fry CS, Drummond MJ, Glynn EL, Dickinson JM, Gundermann DM, Timmerman KL, Walker DK, Dhanani S, Volpi E, Rasmussen BB. Aging impairs contraction-induced skeletal muscle mTORC1 signaling and protein synthesis. Skelet Muscle 1: 11, 2011 [DOI] [PMC free article] [PubMed] [Google Scholar]
- 18. Fry CS, Glynn EL, Drummond MJ, Timmerman KL, Fujita S, Abe T, Dhanani S, Volpi E, Rasmussen BB. Blood flow restriction exercise stimulates mTORC1 signaling and muscle protein synthesis in older men. J Appl Physiol 108: 1199–1209, 2010 [DOI] [PMC free article] [PubMed] [Google Scholar]
- 19. Fujita S, Abe T, Drummond MJ, Cadenas JG, Dreyer HC, Sato Y, Volpi E, Rasmussen BB. Blood flow restriction during low-intensity resistance exercise increases S6K1 phosphorylation and muscle protein synthesis. J Appl Physiol 103: 903–910, 2007 [DOI] [PubMed] [Google Scholar]
- 20. Fujita S, Dreyer HC, Drummond MJ, Glynn EL, Cadenas JG, Yoshizawa F, Volpi E, Rasmussen BB. Nutrient signalling in the regulation of human muscle protein synthesis. J Physiol 582: 813–823, 2007 [DOI] [PMC free article] [PubMed] [Google Scholar]
- 21. Fujita S, Glynn EL, Timmerman KL, Rasmussen BB, Volpi E. Supraphysiological hyperinsulinaemia is necessary to stimulate skeletal muscle protein anabolism in older adults: evidence of a true age-related insulin resistance of muscle protein metabolism. Diabetologia 52: 1889–1898, 2009 [DOI] [PMC free article] [PubMed] [Google Scholar]
- 22. Fujita S, Rasmussen BB, Cadenas JG, Drummond MJ, Glynn EL, Sattler FR, Volpi E. Aerobic exercise overcomes the age-related insulin resistance of muscle protein metabolism by improving endothelial function and Akt/mammalian target of rapamycin signaling. Diabetes 56: 1615–1622, 2007 [DOI] [PMC free article] [PubMed] [Google Scholar]
- 23. Holm L, Reitelseder S, Pedersen TG, Doessing S, Petersen SG, Flyvbjerg A, Andersen JL, Aagaard P, Kjaer M. Changes in muscle size and MHC composition in response to resistance exercise with heavy and light loading intensity. J Appl Physiol 105: 1454–1461, 2008 [DOI] [PubMed] [Google Scholar]
- 24. Kumar V, Selby A, Rankin D, Patel R, Atherton P, Hildebrandt W, Williams J, Smith K, Seynnes O, Hiscock N, Rennie MJ. Age-related differences in the dose-response relationship of muscle protein synthesis to resistance exercise in young and old men. J Physiol 587: 211–217, 2009 [DOI] [PMC free article] [PubMed] [Google Scholar]
- 25. Lander J. Maximums based on reps. Natl Str Cond Assoc J 6: 60–61, 1985 [Google Scholar]
- 26. Livak KJ, Schmittgen TD. Analysis of relative gene expression data using real-time quantitative PCR and the 2(-Delta Delta C(T)) method. Methods 25: 402–408, 2001 [DOI] [PubMed] [Google Scholar]
- 27. Louis E, Raue U, Yang Y, Jemiolo B, Trappe S. Time course of proteolytic, cytokine, and myostatin gene expression after acute exercise in human skeletal muscle. J Appl Physiol 103: 1744–1751, 2007 [DOI] [PubMed] [Google Scholar]
- 28. Madarame H, Neya M, Ochi E, Nakazato K, Sato Y, Ishii N. Cross-transfer effects of resistance training with blood flow restriction. Med Sci Sports Exerc 40: 258–263, 2008 [DOI] [PubMed] [Google Scholar]
- 29. Manini TM, Clark BC. Blood flow restricted exercise and skeletal muscle health. Exerc Sport Sci Rev 37: 78–85, 2009 [DOI] [PubMed] [Google Scholar]
- 30. Manini TM, Vincent KR, Leeuwenburgh CL, Lees HA, Kavazis AN, Borst SE, Clark BC. Myogenic and proteolytic mRNA expression following blood flow restricted exercise. Acta Physiol (Oxf) 201: 255–263, 2011 [DOI] [PMC free article] [PubMed] [Google Scholar]
- 31. Matthews D. Proteins and Amino Acids. Baltimore, MD: Williams & Wilkins, 1999, p. 11–48 [Google Scholar]
- 32. Miller SL, Tipton KD, Chinkes DL, Wolf SE, Wolfe RR. Independent and combined effects of amino acids and glucose after resistance exercise. Med Sci Sports Exerc 35: 449–455, 2003 [DOI] [PubMed] [Google Scholar]
- 33. Patterson SD, Ferguson RA. Increase in calf post-occlusive blood flow and strength following short-term resistance exercise training with blood flow restriction in young women. Eur J Appl Physiol 108: 1025–1033, 2010 [DOI] [PubMed] [Google Scholar]
- 34. Rasmussen BB, Fujita S, Wolfe RR, Mittendorfer B, Roy M, Rowe VL, Volpi E. Insulin resistance of muscle protein metabolism in aging. FASEB J 20: 768–769, 2006 [DOI] [PMC free article] [PubMed] [Google Scholar]
- 35. Rasmussen BB, Tipton KD, Miller SL, Wolf SE, Wolfe RR. An oral essential amino acid-carbohydrate supplement enhances muscle protein anabolism after resistance exercise. J Appl Physiol 88: 386–392, 2000 [DOI] [PubMed] [Google Scholar]
- 36. Reid MB. Response of the ubiquitin-proteasome pathway to changes in muscle activity. Am J Physiol Regul Integr Comp Physiol 288: R1423–R1431, 2005 [DOI] [PubMed] [Google Scholar]
- 37. Takarada Y, Takazawa H, Sato Y, Takebayashi S, Tanaka Y, Ishii N. Effects of resistance exercise combined with moderate vascular occlusion on muscular function in humans. J Appl Physiol 88: 2097–2106, 2000 [DOI] [PubMed] [Google Scholar]
- 38. Timmerman KL, Lee JL, Dreyer HC, Dhanani S, Glynn EL, Fry CS, Drummond MJ, Sheffield-Moore M, Rasmussen BB, Volpi E. Insulin stimulates human skeletal muscle protein synthesis via an indirect mechanism involving endothelial-dependent vasodilation and mammalian target of rapamycin complex 1 signaling. J Clin Endocrinol Metab 95: 3848–3857, 2010 [DOI] [PMC free article] [PubMed] [Google Scholar]
- 39. Timmerman KL, Lee JL, Fujita S, Dhanani S, Dreyer HC, Fry CS, Drummond MJ, Sheffield-Moore M, Rasmussen BB, Volpi E. Pharmacological vasodilation improves insulin-stimulated muscle protein anabolism but not glucose utilization in older adults. Diabetes 59: 2764–2771, 2010 [DOI] [PMC free article] [PubMed] [Google Scholar]
- 40. Tipton KD, Borsheim E, Wolf SE, Sanford AP, Wolfe RR. Acute response of net muscle protein balance reflects 24-h balance after exercise and amino acid ingestion. Am J Physiol Endocrinol Metab 284: E76–E89, 2003 [DOI] [PubMed] [Google Scholar]
- 41. Tipton KD, Ferrando AA, Phillips SM, Doyle D, Wolfe RR. Postexercise net protein synthesis in human muscle from orally administered amino acids. Am J Physiol Endocrinol Metab 276: E628–E634, 1999 [DOI] [PubMed] [Google Scholar]
- 42. Volpi E, Chinkes DL, Rasmussen BB. Sequential muscle biopsies during a 6-h tracer infusion do not affect human mixed muscle protein synthesis and muscle phenylalanine kinetics. Am J Physiol Endocrinol Metab 295: E959–E963, 2008 [DOI] [PMC free article] [PubMed] [Google Scholar]
- 43. Volpi E, Ferrando AA, Yeckel CW, Tipton KD, Wolfe RR. Exogenous amino acids stimulate net muscle protein synthesis in the elderly. J Clin Invest 101: 2000–2007, 1998 [DOI] [PMC free article] [PubMed] [Google Scholar]
- 44. Volpi E, Kobayashi H, Sheffield-Moore M, Mittendorfer B, Wolfe RR. Essential amino acids are primarily responsible for the amino acid stimulation of muscle protein anabolism in healthy elderly adults. Am J Clin Nutr 78: 250–258, 2003 [DOI] [PMC free article] [PubMed] [Google Scholar]
- 45. Walker DK, Dickinson JM, Timmerman KL, Drummond MJ, Reidy PT, Fry CS, Gundermann DM, Rasmussen BB. Exercise, amino acids and aging in the control of human muscle protein synthesis. Med Sci Sports Exerc 43: 2249–2258, 2011 [DOI] [PMC free article] [PubMed] [Google Scholar]
- 46. Wernbom M, Augustsson J, Raastad T. Ischemic strength training: a low-load alternative to heavy resistance exercise? Scand J Med Sci Sports 18: 401–416, 2008 [DOI] [PubMed] [Google Scholar]
- 47. Wernbom M, Jarrebring R, Andreasson MA, Augustsson J. Acute effects of blood flow restriction on muscle activity and endurance during fatiguing dynamic knee extensions at low load. J Strength Cond Res 23: 2389–2395, 2009 [DOI] [PubMed] [Google Scholar]
- 48. Williamson D, Gallagher P, Harber M, Hollon C, Trappe S. Mitogen-activated protein kinase (MAPK) pathway activation: effects of age and acute exercise on human skeletal muscle. J Physiol 547: 977–987, 2003 [DOI] [PMC free article] [PubMed] [Google Scholar]
- 49. Wolfe RR, Chinkes DL. Isotope Tracers in Metabolic Research Principles and Practice of Kinetic Analysis. Hoboken, NJ: Wiley-Liss, 2005 [Google Scholar]
- 50. Yasuda T, Fujita S, Ogasawara R, Sato Y, Abe T. Effects of low-intensity bench press training with restricted arm muscle blood flow on chest muscle hypertrophy: a pilot study. Clin Physiol Funct Imaging 30: 338–343, 2010 [DOI] [PubMed] [Google Scholar]


