Abstract
Data partitioning has long been regarded as an important parameter for phylogenetic inference. The division of heterogeneous multigene data sets into partitions with similar substitution patterns is known to increase the performance of probabilistic phylogenetic methods. However, the effect of the partitioning scheme on divergence time estimates has generally been ignored. To investigate the impact of data partitioning on the estimation of divergence times, we have constructed two genomic data sets. The first one with 15 nuclear genes comprising 50,928 bp were selected from the OrthoMam database; the second set was composed of complete mitochondrial genomes. We studied two partitioning schemes: concatenated supermatrices and partitioned gene analysis. We have also measured the impact of taxonomic sampling on the estimates. After drawing divergence time inferences using the uncorrelated relaxed clock in BEAST, we have compared the age estimates between the partitioning schemes. Our results show that, in general, both schemes resulted in similar chronological estimates, however the concatenated data sets were more efficient than the partitioned ones in attaining suitable effective sample sizes.
Keywords: relaxed molecular clock, data partitioning, timescale, molecular dating
Introduction
Divergence time estimation has been revolutionized by the application of models that relax the assumption of the strict molecular clock by decomposing branch lengths into absolute times and evolutionary rates.1,2 Such an approach has been successfully implemented in a Bayesian framework in which complex models of evolutionary rate evolution may be feasibly used because the marginal distributions of divergence times are obtained via a Markov chain Monte Carlo method.3 Although this approach is widely used, several aspects of molecular dating by such relaxed clock methods require detailed scrutiny. For example, it is still unclear which modeling strategy for describing the change in rates along lineages is more appropriate for biological data.4,5 Another unsolved issue is the possible impact of taxonomic sampling on the estimates of evolutionary rates.6–8
In addition to the modeling of evolutionary rates and taxonomic sampling, the effect of the data-partitioning scheme on the estimation of divergence times has attracted relatively little attention. Curiously, this issue has been addressed frequently over the past decade in the context of topological estimation only, mainly because of the increased availability of multigene data sets.9–12 Researchers may study multigene data sets as a single concatenated supermatrix or may set a predefined number of partitions. Evidently, the estimation of the optimal number of partitions to be used in phylogenetic analysis is a subject of theoretical interest.13,14 Although the effect of data partitioning on the estimation of divergence time has rarely been investigated, the few existing studies show that divergence times are influenced by the partitioning scheme used in multigene data sets.11
In this sense, evaluations of the effects of data partitioning on divergence time inference are needed. Ideally, such analyses must be conducted via simulation or by the analysis of biological data in which there exists considerable empirical evidence of the values of the parametric estimates. The advantage of the latter approach is that the complexity of the evolutionary process is captured. Mammalian timescales have been intensively investigated,15–17 and the availability of molecular data for the lineage is unrivalled among vertebrates because of the hundreds of mitochondrial genomes that have been sequenced and the more than 30 nuclear genomes that are being assembled (http://www.ensembl.org). In addition, the rich fossil record of mammals provides several sources of calibration information that can be used in molecular dating analyses.18
In this paper, we compared the impact on divergence time estimation of concatenated and partitioned schemes using nuclear and mitochondrial data sets of mammals with the relaxed molecular clock. Our analyses showed that, although both of the partitioning schemes yielded similar divergence time estimates, the concatenated data were more efficient than the partitioned scheme because the former allowed effective sample sizes to increase more rapidly. This finding indicates that the concatenated data yielded parametric estimates with better mixing of the Markov chain. The effectiveness of concatenated data is probably due to the smaller number of model parameters, which facilitates exploration of the parametric space by the MCMC sampler.
Materials and Methods
Sequences, alignments and tree topologies
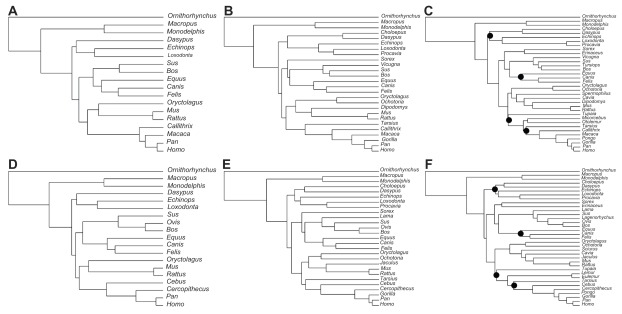
We have constructed two phylogenomic data sets to investigate the impact of data partitioning on mammalian divergence times. In each data set, chronological inferences were obtained by concatenating all of the genes in a single supermatrix or by allowing the partitions to have independent evolutionary parameters. To evaluate the behavior of the chronological estimates with increasing taxonomic sampling, we have studied three species compositions with increasing numbers of terminals in each data set (Fig. 1).
Figure 1.
Phylogenies used in this study. Topologies (A–C) refer to the taxonomic compositions 1 (A), 2 (B) and 3 (C) of the nuclear data set. Topologies (D–F) refer to the taxonomic compositions 1 (C), 2 (D) and 3 (F) of the mitochondrial data set. Phylogenies (C and F) were inferred in PhyML.
Note: Black circles indicate nodes in which aLRT value was lower than 0.9, otherwise aLRT statistics = 1.
The first data set was composed of 15 nuclear genes that were selected from the OrthoMam database.19 Genes were selected according to their relative rates (varying from 0.25 to 1.25), calculated following the approach of Criscuolo et al.20 The 15 genes were sampled in order to obtain an alignment with approximately 50,000 nucleotides (Table 1), which is close to the total sequence length used in recent mammalian phylogenomic studies.21,22 Only genes with the full species sampling were selected. The final concatenated supermatrix contained 50,928 nucleotides, and the corresponding taxonomic compositions included 18, 26 and 34 species (Fig. 1).
Table 1.
Orthologous gene groups downloaded from the OrthoMam database used to compose the nuclear dataset.
| Ensembl code | Gene name (OrthoMam) |
|---|---|
| ENSG00000070961 | ATP2B1 |
| ENSG00000144290 | SLC4A10 |
| ENSG00000160551 | TAOK1 |
| ENSG00000163939 | PBRM1 |
| ENSG00000198408 | MGEA5 |
| ENSG00000071794 | HLTF |
| ENSG00000102385 | DRP2 |
| ENSG00000115839 | RAB3GAP1 |
| ENSG00000157680 | DGKI |
| ENSG00000166387 | PPFIBP2 |
| ENSG00000075856 | SART3 |
| ENSG00000122025 | FLT3 |
| ENSG00000127463 | KIAA0090 |
| ENSG00000143924 | EML4 |
| ENSG00000157404 | KIT |
The second data set was composed of mitochondrial genomes of the same lineages present in the nuclear data set. When the genome of the same species was not available, we used a close sister taxa. For instance, Callithrix was used in the nuclear data set and Cebus was used in the mitochondrial data set. The taxonomic compositions contained 19, 27 and 35 species respectively (Fig. 1). We used all 13 mitochondrial coding genes, resulting in a supermatrix of 11,763 nucleotides. Mitochondrial genes were partitioned into three classes containing first, second and third codon positions, as opposed to the nuclear. This is the partitioning scheme commonly applied to mitochondrial data and is intended to reduce evolutionary rate variability within the partitions studied.23 Accession numbers of the mitochondrial genomes of the species shown in Figure 1D–F are available in Table 2.
Table 2.
Accession numbers of the mitochondrial genomes used in this study.
| Taxon | Accession |
|---|---|
| Bos | NC_006853 |
| Canis | NC_002008 |
| Cavia | NC_000884 |
| Cebus | NC_002763 |
| Cercopithecus | NC_007009 |
| Choleopus | NC_006924 |
| Dasypus | NC_001821 |
| Echinops | NC_002631 |
| Equus | NC_001640 |
| Erinaceus | NC_002080 |
| Eulemur | NC_012771 |
| Felis | NC_001700 |
| Gorilla | NC_001645 |
| Homo | NC_012920 |
| Jaculus | NC_005314 |
| Lagenorhynchus | NC_005278 |
| Lama | NC_012102 |
| Lemur | NC_004025 |
| Loxodonta | NC_000934 |
| Macropus | NC_001794 |
| Monodelphis | NC_006299 |
| Mus | NC_005089 |
| Ochotona | NC_003033 |
| Ornithorhynchus | NC_000891 |
| Oryctolagus | NC_001913 |
| Ovis | NC_001941 |
| Pan | NC_001643 |
| Pongo | NC_002083 |
| Procavia | NC_004919 |
| Rattus | NC_012374 |
| Sciurus | NC_002369 |
| Sorex | NC_005435 |
| Sus | NC_000845 |
| Tarsius | NC_012774 |
| Tupaia | NC_002521 |
The genes were aligned individually in PRANK under default parametric settings.24 The phylogenetic inference was performed with supermatrices of the nuclear and mitochondrial data sets under the taxonomically richer species composition (Fig. 1C and F). These trees were then pruned to obtain the topologies of the compositions with reduced numbers of terminals. Maximum likelihood tree topology search was performed in PhyML 325 under the GTR + Γ4 + I model of sequence evolution. Branch support was measured with the aLRT statistics.26 The tree topologies shown in Figure 1 were fixed throughout the analyses to eliminate topological variance of the inferred divergence times.
Divergence time analysis
Divergence times were estimated in BEAST 1.6.23 using the uncorrelated lognormal model of evolutionary rate evolution. In all of the analyses, the Yule process was used as the tree topology prior, and the GTR + Γ4 + I model of evolution was applied to each partition independently. We have chosen a parameter-rich model to incorporate the complexity of the substitution process of the sequences. Posterior distributions of node ages was achieved by Markov chain Monte Carlo (MCMC) using 2 × 27,000 samples obtained by visiting two independent chains every 1,000nd cycle for 3 × 10⁷ generations and discarding 10% of the collected trees from each chain as burn-in.
The calibration information was obtained from Benton and Donoghue.18 Sixteen normal priors for the age of selected nodes were used (Table 3). The means of the normal distributions were calculated by averaging the minimum of the maximum recommended values for the age of the splits according to that study. We have set the standard deviations so that the minimum and maximum boundary values delimited the 95% highest probability interval (HPD) of the prior.
Table 3.
Calibration information used as divergence time priors.
| Divergence | Normal prior mean | Normal prior SD |
|---|---|---|
| Homo/Pan | 8.3 | 0.9 |
| Mus/Rattus | 11.7 | 0.4 |
| Bovinae/Antilopinae | 23.4 | 2.6 |
| Hominoidea/Cercopithecoidea | 28.5 | 2.8 |
| Ruminantia/Tylopoda–Suiformes | 50.9 | 1.3 |
| Caniformia/Feliformia | 53.3 | 2.6 |
| Ameridelphia/Australidelphia | 66.4 | 2.5 |
| Carnivora/Perissodactyla | 66.8 | 2.2 |
| Afrosoricida/Tubulidentata–Paenungulata | 80.7 | 16.5 |
| Glires | 81.0 | 10.0 |
| Archonta/Glires | 81.0 | 10.0 |
| Ferungulata | 104.2 | 4.5 |
| Euarchontoglires/Laurasiatheria | 104.2 | 4.5 |
| Boreoeutheria/Xenarthra | 104.2 | 4.5 |
| Eutheria/Metatheria | 131.5 | 3.5 |
| Theriimorpha/Australosphenida | 176.8 | 7.3 |
Note: For each divergence represented in the first column, a normal prior distribution was assigned with the respective mean and standard deviation (SD).
As commonly used in molecular dating, the effective sample size (ESS) of parameters was used to examine the mixing of the chains. The convergence of the MCMC algorithm was checked by calculating the potential scale reduction factor statistics27 and the Heidelberger and Welch test,28 all MCMC output analyses were implemented in the CODA package of the R programming environment (http://www.r-project.org).
Comparison procedure
Empirical studies of methods present limitations that do not arise during classical simulation analysis. Because the true mammalian timescale is unknown, one cannot calculate the accuracy of the age estimates. However, empirical data offer the advantage of studying methods with realistic data sets. In this study, the comparison between the partitioning schemes was implemented to investigate whether the schemes yield the same chronological estimates. Therefore, our analyses were guided by the following four key questions: Do both partitioning schemes yield the same divergence estimates of nodes? In which scheme do the posterior estimates depart more from the priors? Which scheme yields estimates with greater precision? Which partitioning scheme more rapidly reaches ESS values suitable for analysis? To answer the first three questions, we have estimated the correlation coefficients and fitted a simple linear regression model, without variable transformation, to the estimates of the cases to be compared, whereas the fourth question was addressed using a cumulative sliding-window strategy. According to this strategy, the size of the sample analyzed increased by units of 100 MCMC samples. For each new window, ESSs were calculated for all of the parameters and then averaged; the average ESS was then used to monitor the cumulative increase of the effective sample size.
Results
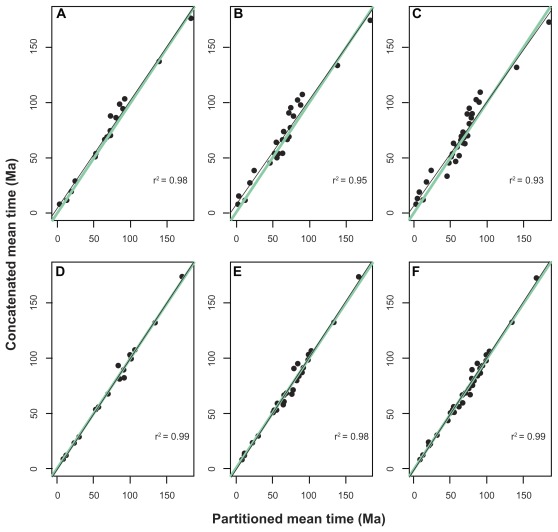
The means of the posterior distributions of the divergence times were similar in the concatenated and partitioned schemes for both nuclear and mitochondrial data sets (Fig. 2). The chronological estimates of the partitioning schemes from the nuclear set were significantly correlated, and all of the node ages were similar (Fig. 2A–C). The slopes of the regression lines varied from 0.98 to 0.95 for the smaller and larger taxonomic compositions, respectively. In the first taxonomic arrangement of the nuclear set, the greatest difference between the concatenated and partitioned schemes was found for the (Bos, Sus)/(Equus, (Canis, Felis)) split (15.1 Ma). In the second nuclear arrangement, the greatest difference was found for the separation of Sorex from other laurasiatherians (19.6 Ma). Lastly, in the third nuclear taxon composition, the basal Laurasiatheria split, the divergence of (Sorex, Erinaceus) from other laurasiatherians was also inferred to present the greatest difference between the partitioning schemes (19.3 Ma).
Figure 2.
Linear regressions between the means of the posterior distributions of the node ages of the phylogenies in Figure 1.
Notes: The solid green lines represent the regressions with a slope equal to 1. The solid black lines represent the regressions between the concatenated and partitioned schemes. Regression coefficients (r2) are all significant at P < 0.001.
In the mitochondrial data set, the posterior distributions of the divergence times of the concatenated and partitioned schemes were also significantly correlated (a product-moment correlation greater than 0.98) (Fig. 2D–F), and were statistically identical because the slope of the regression line was estimated to be 1.0 in all of the taxonomic compositions. In general, the age estimates obtained from both schemes using the mitochondrial set were more similar to each other than those inferred using the nuclear genes. For instance, the greatest discrepancy between the posterior means of the schemes in the first taxonomic arrangement was 10.1 Ma, which was also inferred for the separation between (Bos, Sus) and (Equus, (Canis, Felis)). In contrast to the result for the nuclear data set, the increased taxonomic sampling did not significantly affect the difference between the posterior distributions of the divergence times. Although the same evolutionary split continued to show the greatest difference between the schemes, namely, the Cetartiodactyla/(Carnivora, Perissodactyla) separation, the magnitude of the discrepancy remained constant: 11.1 and 10.5 Ma for the second and third taxonomic arrangements, respectively.
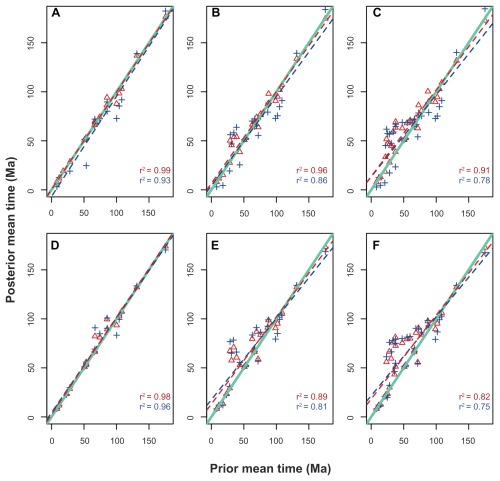
In the nuclear data sets, the comparison between the prior and posterior distributions revealed strong correlations between the estimates (Fig. 3A–C). However, as taxon sampling increased, the difference between the prior and posterior means of the chronological estimates became larger. For example, under the smallest taxonomic arrangement, the means of the posterior distributions of the concatenated scheme were more similar to their priors than to the posterior means of the partitioned scheme. The same was true for the comparison between the priors and posteriors of the partitioned scheme (Fig. 3A). However, when comparing the slopes of the regression lines in the second nuclear taxonomic composition, the posterior divergence time means of both of the partitioning schemes were more similar to each other than to their respective priors (Fig. 3B). This scenario was intensified in the more species-rich nuclear arrangement (Fig. 3C).
Figure 3.
Linear regressions between the means of the prior and posterior distributions of the node ages of the phylogenies in Figure 1.
Notes: The solid green lines represent the regressions with a slope equal to 1. The dashed blue lines represent the regression between the prior and posterior under the partitioned scheme, whereas the dashed red lines represent the regression between the prior and posterior under the concatenated scheme. Regression coefficients (r2) are all significant at P < 0.001.
The assessment of the difference between the prior and posterior distributions in the mitochondrial set showed that the posterior distribution of the divergence time estimates diverged considerably from the priors in the mitochondrial set (Fig. 3D–F). Moreover, the extent of the departure from the prior increased on larger taxonomic sampling.
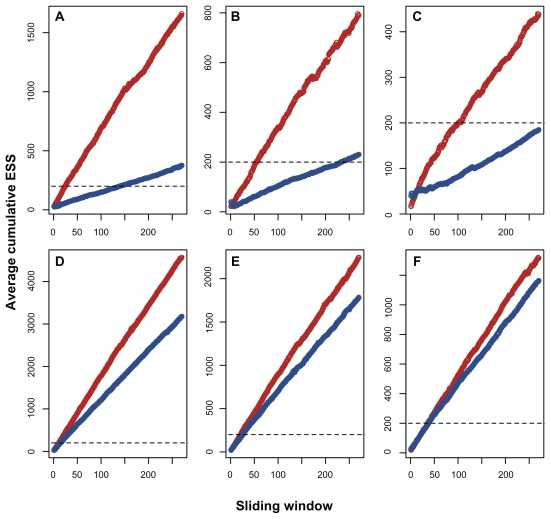
The evaluation of the average cumulative ESS clearly showed that, for all the cases studied, in the concatenated scheme, the average ESS increased at a faster rate than the partitioned scheme estimates (Fig. 4). However, the nuclear and mitochondrial sets showed very different rates of ESS increase. In the nuclear data set, only the concatenated scheme was similarly efficient, and the average ESS of the nuclear partitioned data increased very slowly and required more than 15,000 MCMC samples to reach 200 in the first and second taxonomic arrangements (Fig. 4A and B). In the third nuclear taxonomic composition, the partitioned scheme only approached 200 after 30,000 MCMC samples (Fig. 4C). On the other hand, all of the mitochondrial taxonomic compositions yielded an average ESS of 200, with fewer than 5,000 MCMC samples, independent of the partitioning scheme (Fig. 4D–F).
Figure 4.
Plot of the average cumulative ESS along the sliding window of the MCMC samples.
Notes: The red points represent the concatenated data sets, and the blue points represent the partitioned analysis.
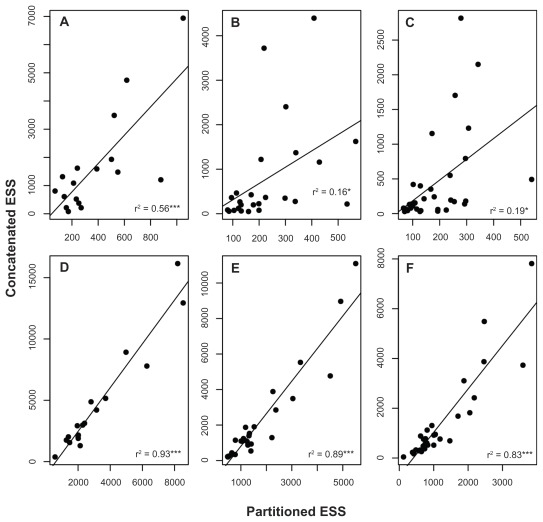
The efficiency of the concatenated scheme is confirmed by the comparison of the ESSs of each divergence time estimate between the concatenated and partitioned schemes (Fig. 5). Although the correlation coefficients were significant and the slopes of the regression lines were greater than 3.0 in the nuclear set, the coefficients were low (varying from 0.58 to 0.16). These findings indicate that the increased slopes were influenced by a few age estimates (points above the regression line) for which the discrepancy between the ESSs of the partitioned and concatenated schemes was large (Fig. 5A–C). Generally, the individual ESSs of node ages are higher in the concatenated schemes, and this tendency is more clearly observed in the mitochondrial data set (Fig. 5D–F) in which the correlation coefficients were greater than 0.8 and the slopes of the regression lines were greater than 1.0.
Figure 5.
Linear regressions between the effective sample sizes of the node age estimates based on the concatenated and partitioned schemes.
Notes: (r2) regression coefficients. Asterisks represent statistical significance at P < 0.001 (***), 0.01 (**) and 0.5 (*) respectively.
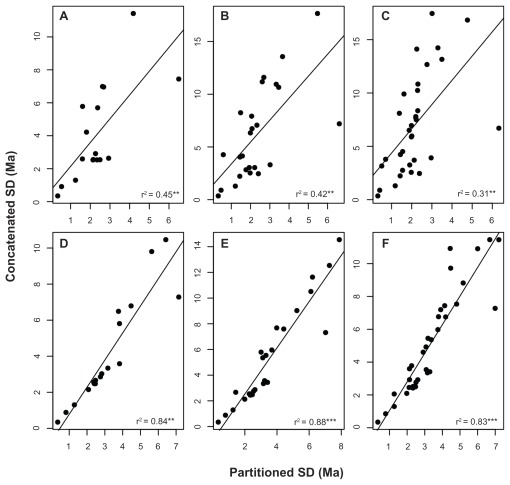
We have also examined the behavior of the precision of the posterior distribution of the divergence times, as measured by the standard deviation of the samples collected during the MCMC analysis. In general, the standard deviations of the posterior distributions of the node ages were significantly correlated between the concatenated and partitioned schemes. However, although the product-moment correlation coefficients were significant, they were not high in the nuclear data set and ranged between 0.43 and 0.76; conversely, the correlations varied from 0.91 to 0.97 for the mitochondrial data set (Fig. 6). Nevertheless, an overall tendency was evident: in both mitochondrial and nuclear data sets, independent of the taxonomic composition, the standard deviations of the posterior distributions of the concatenated supermatrices were greater than those calculated for the partitioned data sets.
Figure 6.
Linear regressions between the standard deviations of the posterior distributions of the node age estimates of the concatenated and partitioned schemes.
Notes: (r2) regression coefficients. Asterisks represent statistical significance at P < 0.001 (***), 0.01 (**) and 0.5 (*) respectively.
Discussion
In this study, we have demonstrated several features of the partitioning scheme applied to nuclear and mitochondrial data sets and its consequence to mammalian divergence time estimates. Essentially, our results showed that the effect of the data partitioning was, on average, statistically negligible, even though the concatenated supematrices were more efficient than the partitioned analysis.
It might be argued that all data sets would eventually converge to the same estimates of divergence times if the Markov chains were run long enough. The differences among data sets observed in this study were, therefore, temporary. However, we think that, realistically, this is exactly the main argument to be considered. Bayesian divergence time inference using relaxed clock methods is computationally demanding, thus, if both partitioning schemes yielded similar estimates, we should assume that the simpler composition, ie, the concatenated scheme, was more efficient.
Nodes with large difference between partitioning schemes
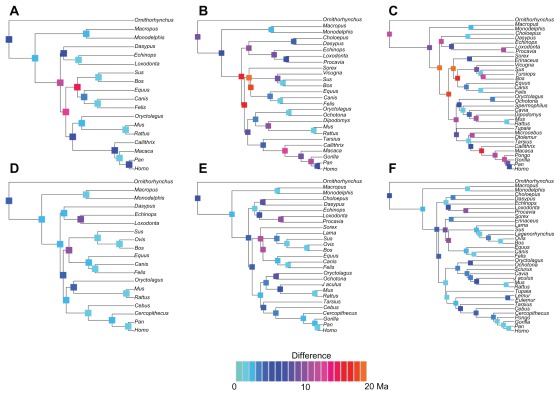
One of our findings was that the greatest difference between the partitioning schemes occurred for the nodes that were close to the basal Laurasiatheria split. In the nuclear data set, these nodes were the Atlantogenata/ Boreoeutheria separation, the basal Boreoeutheria divergence, the split between insectivores and Ferungulata (basal Laurasiatheria), and the basal Ferungulata divergence (Fig. 7). The basal Ferungulata split was also dated at discrepant ages by both of the schemes for the mitochondrial data set (Fig. 7). One of the reasons for the lower efficiency of the nuclear data set for these nodes might be associated with the large variation commonly found in the coalescence times of nuclear genes.29 Actually, the resolution of the phylogenetic branching between the superorders of Mammalia and the early evolution of Laurasiatheria are the most difficult problems in mammalian phylogenomics.16,17,30
Figure 7.
Phylogenies used in this study.
Notes: The magnitude of the difference between the node ages from the concatenated and partitioned schemes is represented in each node using the color scale shown at the bottom of the figure.
In this sense, if the reason for the difference found between the partitioning schemes in the age of these splits is associated with deep coalescence events, we would expect a large standard deviation of the posterior distributions of the partitioned data sets. However, as shown in Figure 6, the standard deviation of divergence time estimates of the partitioned scheme were actually smaller than those obtained from the concatenated analysis. Thus, it appears that the difference might be simply associated with low ESSs values on these nodes found particularly on the partitioned analysis (all bellow 200). This could be caused by the inability of the MCMC algorithm to efficiently explore the parametric space and would lead to spuriously low standard deviations. For instance, in the nuclear data set, the ESS estimated for the age of the Atlantogenata/Boreoeutheria split using the concatenated supermatrix was 419.8, whereas it decreased to 101.9 under the partitioned scheme. The standard deviations of the posterior distributions of this parameter were 3.7 and 2.1 Ma for the concatenated and partitioned schemes, respectively. Not surprisingly, the autocorrelation of the Markov chain was higher in the partitioned scheme (0.68 vs. 0.41 using the concatenated sequence), which indicates a poor mixing of the chain.
Efficiency of mitochondrial data
In our analysis, divergence time estimates based on the mitochondrial coding genes were robust to taxonomic sampling and were also efficient. On average, the ESS of the age estimates rapidly increased along the MCMC run, particularly when genes were concatenated in a single supermatrix. The robustness to the partitioning scheme of the estimates obtained from the mitochondrial data might be a consequence of the smaller number of partitions used in the partitioned data set, which reduced the number of parameters of the model and facilitated MCMC convergence. The robustness of mitochondrial estimates, however, does not indicate that mitochondrial estimates were accurate.
Unfortunately, accuracy cannot be easily accessed on analysis of empirical data. Thus, it is meaningful to ask whether the mitochondrial and nuclear age estimates were similar, because is unlikely that two independent data sets yield the same incorrect estimate. We have calculated the differences between the nuclear and mitochondrial concatenated sets and between the nuclear and mitochondrial partitioned sets for the nodes for which the estimates showed greater irregularity in our results (Table 4). Such an examination demonstrated that the nuclear concatenated age estimates were close to the mitochondrial concatenated estimates. The differences between the concatenated analyses ranged from 0.0 to 5.6 Ma (Table 4); in contrast, the partitioned estimates from the nuclear and mitochondrial genes ranged from 9.4 to 14.6 Ma (Table 4).
Table 4.
Differences between nuclear and mitochondrial divergence time estimates of selected nodes.
| Basal divergence* | Concatenated | Partitioned | ||||
|---|---|---|---|---|---|---|
| C1§ | C2 | C3 | C1 | C2 | C3 | |
| Placentalia | 4.7 | 0.6 | 3.1 | 14.0 | 12.5 | 11.8 |
| Boreoeutheria | 4.2 | 1.3 | 0.1 | 13.9 | 14.6 | 14.3 |
| Laurasiatheria | 5.6 | 0.0 | 0.7 | 10.6 | 9.4 | 11.5 |
| Ferungulata | NA | 0.2 | 0.0 | NA | 6.5 | 6.3 |
Notes: Comparisons were performed by calculating the absolute value of the difference between the nuclear and mitochondrial concatenated schemes and between the nuclear and mitochondrial partitioned schemes.
The nodes analyzed consisted of the basal split of the lineages in the column;
Refers to the taxonomic compositions. C1 is the taxon-poorer taxonomic arrangement, and C3 is the species-richer composition.
NA = Not applicable because the basal Laurasiatheria and Ferungulata nodes were the same after eliminating the insectivores.
Efficiency of nuclear data and other statistical issues
The nuclear divergence times inferred using the concatenated scheme are closer to the ages estimated from the mitochondrial data than they are to the nuclear partitioned set. This finding demonstrates that the nuclear partitioned set yielded the most deviant divergence times. As we have previously suggested, the partitioned analysis of the nuclear data presented small standard deviations (Fig. 6), possibly as a result of poor exploration of the parametric space. It is worth mentioning, however, that the Gelman and Rubin’s27 statistic was close to 1.0 for all divergence times estimated from the three nuclear partitioned data sets. MCMC runs also passed the Heidelberger and Welch’s28 test. Therefore, although the use of a large number of model parameters in the partitioned nuclear data did not permit an exhaustive evaluation of the parametric space, the results would be considered satisfactory by the methods of evaluation of MCMC runs usually available in Bayesian software.
Because we have not conducted a simulation study, our results offer limited power to evaluate the performance of the partitioning schemes. In practical terms, however, when analyzing biological data, researchers generally check for convergence by calculating the ESS of parameters. With respect to ESS, concatenated data sets were superior. Researchers should consider though that the use of concatenated data is biologically meaningless if partitions share different evolutionary histories.31 However, this is not the case of mammalian mitochondrial genomes.
In conclusion, our study showed that, in general, the age estimates of both of the partitioning schemes attained similar values, with the exception of the divergence times of the nodes associated with the basal diversification of placentals, Boreoeutheria, Laurasiatheria and Ferungulata. The posterior distributions of the divergence times based on the partitioned scheme presented smaller standard deviations (they were more precise). This observation, however, might be associated with the poor mixing of the Markov chains. Therefore, in both mammalian genome data sets analyzed, given the same number of MCMC generations, the simpler modeling of the evolutionary process implemented by concatenating genes in supermatrices reached divergence time estimates similar to those inferred from partitioned data sets. Moreover, the MCMC samples obtained from concatenated data sets presented greater ESS and lower autocorrelation.
Footnotes
Author Contributions
Conceived and designed the experiments: CMV, CGS. Analysed the data: CMV, CGS. Wrote the first draft of the manuscript: CMV, CGS. Contributed to the writing of the manuscript: CMV, CGS. Agree with manuscript results and conclusions: CMV, CGS. Jointly developed the structure and arguments for the paper: CMV, CGS. Made critical revisions and approved final version: CMV, CGS. All authors reviewed and approved of the final manuscript.
Disclosures and Ethics
As a requirement of publication author(s) have provided to the publisher signed confirmation of compliance with legal and ethical obligations including but not limited to the following: authorship and contributorship, conflicts of interest, privacy and confidentiality and (where applicable) protection of human and animal research subjects. The authors have read and confirmed their agreement with the ICMJE authorship and conflict of interest criteria. The authors have also confirmed that this article is unique and not under consideration or published in any other publication, and that they have permission from rights holders to reproduce any copyrighted material. Any disclosures are made in this section. The external blind peer reviewers report no conflicts of interest.
Funding
This work was funded by the Brazilian Research Council (CNPq) grant 308147/2009-0 and FAPERJ grants E-26/103.136/2008, 110.838/2010, 110.028/2011 and 111.831/2011 to CGS.
References
- 1.Thorne JL, Kishino H. Divergence time and evolutionary rate estimation with multilocus data. Systematic Biology. 2002;51:689–702. doi: 10.1080/10635150290102456. [DOI] [PubMed] [Google Scholar]
- 2.Drummond AJ, Ho SYW, Phillips MJ, Rambaut A. Relaxed phylogenetics and dating with confidence. Plos Biology. 2006;4:699–710. doi: 10.1371/journal.pbio.0040088. [DOI] [PMC free article] [PubMed] [Google Scholar]
- 3.Drummond AJ, Rambaut A. BEAST: Bayesian evolutionary analysis by sampling trees. BMC Evolutionary Biology. 2007;7 doi: 10.1186/1471-2148-7-214. [DOI] [PMC free article] [PubMed] [Google Scholar]
- 4.Lepage T, Bryant D, Philippe H, Lartillot N. A general comparison of relaxed molecular clock models. Molecular Biology and Evolution. 2007;24:2669–80. doi: 10.1093/molbev/msm193. [DOI] [PubMed] [Google Scholar]
- 5.Battistuzzi FU, Filipski A, Hedges SB, Kumar S. Performance of relaxed-clock methods in estimating evolutionary divergence times and their credibility intervals. Mol Biol Evol. 2010;27:1289–300. doi: 10.1093/molbev/msq014. [DOI] [PMC free article] [PubMed] [Google Scholar]
- 6.Linder HP, Hardy CR, Rutschmann F. Taxon sampling effects in molecular clock dating: An example from the African Restionaceae. Molecular Phylogenetics and Evolution. 2005;35:569–82. doi: 10.1016/j.ympev.2004.12.006. [DOI] [PubMed] [Google Scholar]
- 7.Hug LA, Roger AJ. The impact of fossils and taxon sampling on ancient molecular dating analyses. Molecular Biology and Evolution. 2007;24:1889–97. doi: 10.1093/molbev/msm115. [DOI] [PubMed] [Google Scholar]
- 8.Xiang QY, Thomas DT, Xiang QP. Resolving and dating the phylogeny of Cornales—Effects of taxon sampling, data partitions, and fossil calibrations. Molecular Phylogenetics and Evolution. 2011;59:123–38. doi: 10.1016/j.ympev.2011.01.016. [DOI] [PubMed] [Google Scholar]
- 9.McGuire JA, Witt CC, Altshuler DL, Remsen JV., Jr Phylogenetic systematics and biogeography of hummingbirds: Bayesian and maximum likelihood analyses of partitioned data and selection of an appropriate partitioning strategy. Systematic Biology. 2007;56:837–56. doi: 10.1080/10635150701656360. [DOI] [PubMed] [Google Scholar]
- 10.Li C, Lu G, Orti G. Optimal data partitioning and a test case for ray-finned fishes (Actinopterygii) based on ten nuclear loci. Systematic Biology. 2008;57:519–39. doi: 10.1080/10635150802206883. [DOI] [PubMed] [Google Scholar]
- 11.Poux C, Madsen O, Glos J, de Jong WW, Vences M. Molecular phylogeny and divergence times of Malagasy tenrecs: Influence of data partitioning and taxon sampling on dating analyses. BMC Evolutionary Biology. 2008;8 doi: 10.1186/1471-2148-8-102. [DOI] [PMC free article] [PubMed] [Google Scholar]
- 12.Ward PS, Brady SG, Fisher BL, Schultz TR. Phylogeny and biogeography of dolichoderine ants: effects of data partitioning and relict taxa on historical inference. Systematic Biology. 2010;59:342–62. doi: 10.1093/sysbio/syq012. [DOI] [PubMed] [Google Scholar]
- 13.Nylander JA, Ronquist F, Huelsenbeck JP, Nieves-Aldrey JL. Bayesian phylogenetic analysis of combined data. Syst Biol. 2004;53:47–67. doi: 10.1080/10635150490264699. [DOI] [PubMed] [Google Scholar]
- 14.Brown JM, Lemmon AR. The importance of data partitioning and the utility of Bayes factors in Bayesian phylogenetics. Systematic Biology. 2007;56:643–55. doi: 10.1080/10635150701546249. [DOI] [PubMed] [Google Scholar]
- 15.Arnason U, Adegoke JA, Gullberg A, Harley EH, Janke A, Kullberg M. Mitogenomic relationships of placental mammals and molecular estimates of their divergences. Gene. 2008;421:37–51. doi: 10.1016/j.gene.2008.05.024. [DOI] [PubMed] [Google Scholar]
- 16.Hallstrom BM, Janke A. Mammalian evolution may not be strictly bifurcating. Molecular Biology and Evolution. 2010;27:2804–16. doi: 10.1093/molbev/msq166. [DOI] [PMC free article] [PubMed] [Google Scholar]
- 17.Hallstrom BM, Schneider A, Zoller S, Janke A. A genomic approach to examine the complex evolution of laurasiatherian mammals. PLoS One. 2011;6:e28199. doi: 10.1371/journal.pone.0028199. [DOI] [PMC free article] [PubMed] [Google Scholar]
- 18.Benton MJ, Donoghue PC. Paleontological evidence to date the tree of life. Mol Biol Evol. 2007;24:26–53. doi: 10.1093/molbev/msl150. [DOI] [PubMed] [Google Scholar]
- 19.Ranwez V, Delsuc F, Ranwez S, Belkhir K, Tilak MK, Douzery EJ. OrthoMaM: a database of orthologous genomic markers for placental mammal phylogenetics. BMC Evolutionary Biology. 2007;7:241. doi: 10.1186/1471-2148-7-241. [DOI] [PMC free article] [PubMed] [Google Scholar]
- 20.Criscuolo A, Berry V, Douzery EJ, Gascuel O. SDM: a fast distance-based approach for (super) tree building in phylogenomics. Syst Biol. 2006;55:740–55. doi: 10.1080/10635150600969872. [DOI] [PubMed] [Google Scholar]
- 21.Perelman P, Johnson WE, Roos C, et al. A molecular phylogeny of living primates. Plos Genetics. 2011;7:e1001342. doi: 10.1371/journal.pgen.1001342. [DOI] [PMC free article] [PubMed] [Google Scholar]
- 22.Peters RS, Meyer B, Krogmann L, et al. The taming of an impossible child: a standardized all-in approach to the phylogeny of Hymenoptera using public database sequences. BMC Biology. 2011;9:55. doi: 10.1186/1741-7007-9-55. [DOI] [PMC free article] [PubMed] [Google Scholar]
- 23.Yoder AD, Yang ZH. Divergence dates for Malagasy lemurs estimated from multiple gene loci: geological and evolutionary context. Molecular Ecology. 2004;13:757–73. doi: 10.1046/j.1365-294x.2004.02106.x. [DOI] [PubMed] [Google Scholar]
- 24.Loytynoja A, Goldman N. webPRANK: a phylogeny-aware multiple sequence aligner with interactive alignment browser. BMC Bioinformatics. 2010;11:579. doi: 10.1186/1471-2105-11-579. [DOI] [PMC free article] [PubMed] [Google Scholar]
- 25.Guindon S, Gascuel O. A simple, fast, and accurate algorithm to estimate large phylogenies by maximum likelihood. Systematic Biology. 2003;52:696–704. doi: 10.1080/10635150390235520. [DOI] [PubMed] [Google Scholar]
- 26.Anisimova M, Gascuel O. Approximate likelihood-ratio test for branches: A fast, accurate, and powerful alternative. Syst Biol. 2006;55:539–52. doi: 10.1080/10635150600755453. [DOI] [PubMed] [Google Scholar]
- 27.Gelman A, Rubin DB. Inference from iterative simulation using multiple sequences. Statistical Science. 1992;7:457–511. [Google Scholar]
- 28.Heidelberger P, Welch PD. Simulation run length control in the presence of an initial transient. Opns Res. 1983;31:1109–44. [Google Scholar]
- 29.Edwards SV. Is a new and general theory of molecular systematics emerging? Evolution. 2009;63:1–19. doi: 10.1111/j.1558-5646.2008.00549.x. [DOI] [PubMed] [Google Scholar]
- 30.Hou ZC, Romero R, Wildman DE. Phylogeny of the Ferungulata ( Mammalia: Laurasiatheria) as determined from phylogenomic data. Molecular Phylogenetics and Evolution. 2009;52:660–4. doi: 10.1016/j.ympev.2009.05.002. [DOI] [PMC free article] [PubMed] [Google Scholar]
- 31.Liu L, Yu L, Kubatko L, Pearl DK, Edwards SV. Coalescent methods for estimating phylogenetic trees. Molecular Phylogenetics and Evolution. 2009;53:320–8. doi: 10.1016/j.ympev.2009.05.033. [DOI] [PubMed] [Google Scholar]


