Abstract
Abdominal aortic aneurysm (AAA) is a vascular disease resulting in a permanent, localized enlargement of the abdominal aorta. We previously hypothesized that the progression of AAA may be slowed by altering the hemodynamics in the abdominal aorta through exercise. To quantify the effect of exercise intensity on hemodynamic conditions in 10 AAA subjects at rest and during mild and moderate intensities of lower-limb exercise (defined as 33 ± 10% and 63 ± 18% increase above resting heart rate, respectively), we used magnetic resonance imaging and computational fluid dynamics techniques. Subject-specific models were constructed from magnetic resonance angiography data and physiologic boundary conditions were derived from measurements made during dynamic exercise. We measured the abdominal aortic blood flow at rest and during exercise, and quantified mean wall shear stress (MWSS), oscillatory shear index (OSI), and particle residence time (PRT). We observed that an increase in the level of activity correlated with an increase of MWSS and a decrease of OSI at three locations in the abdominal aorta, and these changes were most significant below the renal arteries. As the level of activity increased, PRT in the aneurysm was significantly decreased: 50% of particles were cleared out of AAAs within 1.36 ± 0.43, 0.34 ± 0.10, and 0.22 ± 0.06 s at rest, mild exercise, and moderate exercise levels, respectively. Most of the reduction of PRT occurred from rest to the mild exercise level, suggesting that mild exercise may be sufficient to reduce flow stasis in AAAs.
Keywords: Cycling exercise, Phase-contrast magnetic resonance imaging, Mean wall shear stress, Oscillatory shear index, Particle residence time, Particle clearance
INTRODUCTION
An abdominal aortic aneurysm (AAA) is defined by a focal enlargement of the abdominal aorta. AAA is closely associated with alteration of the media and elastic tissues in the abdominal aortic wall, a disease process that shares similar mechanisms with atherosclerosis. 6,28 AAA formation and growth are correlated with high peripheral resistance and adverse/pro-inflammatory hemodynamics including low and oscillatory wall shear stress (WSS) and extended clearance time of blood particles, induced by stagnation and recirculation of blood flow in the dilated abdominal aorta.1,6,12,19 Low and disturbed WSS (<4 dyne/cm2 or 0.4 Pa) is hypothesized to induce athero-prone gene expression via mechanoreceptors on endothelial cells, and alter the function of atherosclerosis-associated molecules.5,17 Hemodynamic conditions are hypothesized to induce localization of atherosclerotic lesions in the inner curve of bends and the lateral luminal surfaces of bifurcations, the regions with flow separation, reversal, and stagnation.39 In addition, previous studies using in vivo imaging and computational fluid dynamics (CFD) in human subjects have shown that WSS may be a key contributor to the development of cerebral aneurysms.2 Disturbed blood flow may also be coupled with platelet aggregation and thrombosis. Specifically, areas of turbulence, flow stagnation, or recirculation have been shown to experience prolonged residence time of red blood cells and platelets, activation of adhesion molecules and clotting factors, platelet aggregation and thrombus formation, processes that contribute to local hypoxia and inflammation in the aortic wall.1,9,17 More details of biomechanical evidence of hemodynamic influences on aneurysm formation and progression can be found in previous publications.6,16,30
We previously hypothesized that the prolonged effect of regular exercise may eventually slow AAA growth and that altered hemodynamic conditions in the abdominal aorta achieved by lower-limb exercise may play a mechanistic role in such an effect.6 Indirect support for this hypothesis is provided by cell culture, animal and human studies. In relation to atherosclerotic disease, a shear stress waveform measured from the athero-protective region of the human carotid artery was reported to trigger favorable phenotype modulation of cultured human endothelial cells.5 In rodent studies, artificial augmentation of blood flow led to smaller sized aneurysms compared to aneurysms exposed to low blood flow.11,21 In humans, systemic effects of exercise include an increase in heart rate, cardiac output, and arterial pressure, as well as reduction in peripheral resistance due to local vasodilation of the blood vessels in active muscles. In addition, there is elevation of blood flow rate and WSS, and release of shear-mediated athero-protective factors such as nitric oxide and prostacyclin.33 Cheng et al. reported that during lower-limb cycling exercise with 50% elevation of heart rate, the infrarenal (IR) aorta experienced 5.4- and 11.8-folds increases of blood flow rate and WSS, respectively, in healthy subjects aged 50–70 years.4 Tenforde et al. documented a consistent increase in blood flow and decrease in oscillatory flow during low intensity exercise, with 30–36% elevation of heart rate for AAA subjects.34 In addition, previous computational studies showed reduced stagnation and recirculation of blood flow in the abdominal aorta during simulated exercise.16,31 Regular exercise-induced hemodynamic changes may alter endothelial phenotype, and attenuate the wall degenerative mechanisms. 6,8,17 Moreover, long-term exercise seems to reduce the incidence of platelet aggregation, which may lead to the reduction of thrombus formation in AAA.7
The effect of graded exercise intensity on hemodynamic conditions in AAAs is unknown. The recommended exercise level for older adults provided by American College of Sports Medicine and the American Heart Association (ACSM/AHA) was moderate-intensity aerobic physical activity for a minimum of 30 min, 5 days per week, or vigorous-intensity activity for a minimum of 20 min, 3 days per week.22 However, elderly patients with cardiovascular disease may not be able to perform the recommended exercise regimen due to their limited exercise capacity. These factors demonstrate the need to compare the hemodynamics between graded levels of exercise intensity. Characterization of hemodynamic changes induced by different levels of exercise may contribute to understanding the transient changes of flow features in the aneurysm from rest to moderate exercise, and may provide quantitative data to establish an ideal exercise regimen for elderly patients with AAA.
As a part of a National Institute of Health (NIH)-sponsored clinical trial at Stanford University through the Specialized Center for Clinically Oriented Research (SCCOR) program, our objectives are to quantify the hemodynamic changes in AAAs using physiologically realistic subject-specific simulations and to offer insight into potentially protective effects induced by exercise. We present evidence that exercise may reduce the adverse abdominal aortic hemodynamics that may contribute to aneurysm progression. Our results provide quantitative data to validate the cardiovascular benefit of exercise as an alternative non-invasive therapy to attenuate AAA growth. In this study, we examine the hemodynamics of the abdominal aorta in AAA subjects at three different levels of exercise intensity: (1) rest, i.e., the stationary state sitting in an upright position, (2) mild exercise, which we define as the level of exercise with a heart rate elevated 30–40% above the resting heart rate, and (3) moderate exercise, which we define as the level of exercise with a heart rate elevated 60–70% above the resting heart rate. We simulate the physiologic flow features in the abdominal aorta using MRI and CFD techniques with a subject-specific anatomic model and physiologic boundary conditions. Finally, we compare the hemodynamic conditions during graded levels of exercise intensity by computing mean WSS (MWSS), oscillatory shear index (OSI), and particle residence time (PRT).
METHODS
Image Acquisition
We studied nine male and one female subjects with a mean age of 71.2 ± 7.9 years with known small AAAs (diameter <5 cm), and conducted all image studies under a protocol approved by the local institutional review board. Informed consent was obtained from all subjects prior to participation, and all subjects were screened for contraindications to MR and gadolinium usage including renal insufficiency.
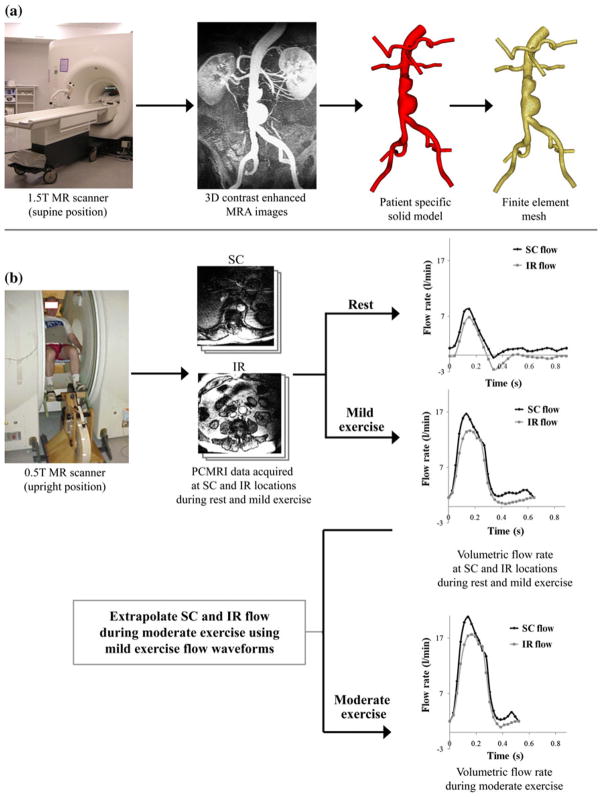
In a first imaging study, we imaged the lumen of the abdominal aorta and adjacent branch vessels using a 3D gadolinium-enhanced magnetic resonance angiography (MRA) sequence (Fig. 1a). Subjects were scanned in the supine position using a 1.5 T GE Signa MR scanner (GE Medical Systems, Milwaukee WI) and an eight-channel cardiac coil. The scan parameters included 3.0–3.3 ms TR (repetition time), 0.7–0.8 ms TE (echo time), a 25° flip angle, 512 × 192 acquisition matrix (reconstructed to 512 × 512) with a 40 cm square field of view. The slice thickness was 3 mm, and 124 slices were included in each volume.
FIGURE 1.
Data acquisition using magnetic resonance imaging (MRI). (a) AAA subjects were scanned in the supine position using a 1.5 T Signa MR scanner (GE Medical Systems, Milwaukee WI). We used a 3D gadolinium-enhanced MRA sequence to image the lumen of the abdominal aorta. Custom software37 was used to process these images, construct a 3D solid model, and generate a finite element mesh based on the model geometry (MeshSim™, Simmetrix, Clifton Park, NY). (b) In a separate imaging study, AAA subjects were scanned in the upright position using a 0.5 T Signa MR scanner (GE Medical Systems, Milwaukee, WI). We acquired cine phase-contrast MRI (PC-MRI) data at supraceliac (SC) and infrarenal (IR) locations during rest and performing lower-extremity mild exercise using an MR-compatible exercise cycle. The PC-MRI images were used to calculate the time-dependent volumetric flow rate at SC and IR locations with 24 time points per cardiac cycle. SC and IR flow waveforms at the moderate exercise level were extrapolated from the SC and IR flow waveforms obtained during mild exercise.
In a second imaging study, we measured abdominal aortic blood flow at seated rest and during seated lower-limb exercise using a one-component cine phase-contrast sequence (PC-MRI) in a 0.5 T scanner (GE Signa SP, GE Medical Systems, Milwaukee, WI) (Fig. 1b). Each subject was positioned in the center of the magnet, and the custom-built MR-compatible cycle was adjusted for subject size and strength.4 Subjects were instructed to elevate their heart rate to 30–40% greater than their resting heart rate, i.e., mild exercise level, and maintain a constant heart rate by adjusting the pedaling speed during the exercise scans performed over 10–15 min. We measured the axial blood velocities at two anatomic locations: the supraceliac (SC) location (superior to the celiac trunk) and an IR location (immediately inferior to the renal arteries). The scan parameters included 25 ms TR (repetition time), 9 ms TE (echo time), a 30° flip angle, 10-mm slice thickness, 256 × 192 image matrix with 26–32 cm square field of view, a 150 cm/s through-plane velocity encoding gradient, and reconstruction to 24 time points per cardiac cycle.
Image Processing
We constructed a three-dimensional patient-specific anatomic model for each subject using custom software 37 from the MRA images acquired from the first imaging study. Each anatomic model included the abdominal aorta, the celiac, hepatic and splenic arteries, the superior mesenteric artery (SMA), renal arteries, and external and internal iliac arteries. Solid models were discretized to generate finite element meshes for 3D flow simulation using a commercial meshing kernel (MeshSim™, Simmetrix, Clifton Park, NY) (Fig. 1a). Time-dependent volumetric flow rates were calculated from PC-MRI data acquired from the second imaging study. We segmented lumen boundaries on the magnitude images in the PC-MRI data for 24 time frames. We then computed the average blood velocities within the segmentations, and multiplied each of the average velocity values by the corresponding segmentation area to obtain the volumetric flow rate at each of the 24 time frames. These flow rates were assembled into time-dependent volumetric flow waveforms over a single cardiac cycle (Fig. 1b).
Flow Waveform Extrapolation for Moderate Exercise Level
During this clinical trial, the same subjects performed treadmill exercise testing at the Veterans Affairs Palo Alto Health Care System (VAPAHC) in the level of moderate exercise with a 60–70% increase in heart rate as well as maximal exercise.20 However, during our imaging studies, we were unable to measure SC and IR flow waveforms at the moderate exercise level since the majority of the subjects could not increase their heart rate 60–70% seating inside the magnet without significant abdominal motion. Therefore, we approximated SC and IR flow waveforms at the moderate exercise level by extrapolating the flow waveforms from the mild exercise level. We approximated the mean IR flow rate during moderate exercise based on an assumed linear trend of increase of mean IR flow as a function of percent elevation of heart rate.15,26 We estimated the mean splanchnic and renal blood flow (SRBF, blood flow to the celiac, mesenteric, and renal arteries) during moderate exercise assuming that the mean SRBF during exercise was decreased proportionally as a function of percent elevation of heart rate with the minimum bound of mean SRBF as 30% of the resting SRBF during maximal exercise.23,26 The mean IR flow and mean SRBF were summed to obtain the mean SC flow. We truncated the diastolic portion of each flow waveform obtained at the mild exercise level, and amplified the flow magnitude to reach the desired mean flow at the moderate exercise level (Fig. 1b).24,27
Systolic and Diastolic Blood Pressures
In order to obtain the physiologic blood pressure range, we measured the brachial systolic blood pressure (SBP) and diastolic blood pressure (DBP) for the resting level immediately after the MR exam using an automatic pressure cuff (Omron Healthcare, Inc., Bannockburn, IL). For the moderate exercise level, SBP and DBP were obtained from treadmill exercise testing at VAPAHC. Finally, for the mild exercise level, SBP and DBP were calculated based on an assumed linear trend of increase of blood pressure as a function of percent elevation of heart rate.15 For the simulations, these SBP and DBP were assumed to be the blood pressures at the inlet of the model. This assumption was based on the literature demonstrating that the differences of SBP and DBP at the brachial artery vs. those at the diaphragm level are about 1 mmHg.10
Simulation and Boundary Conditions
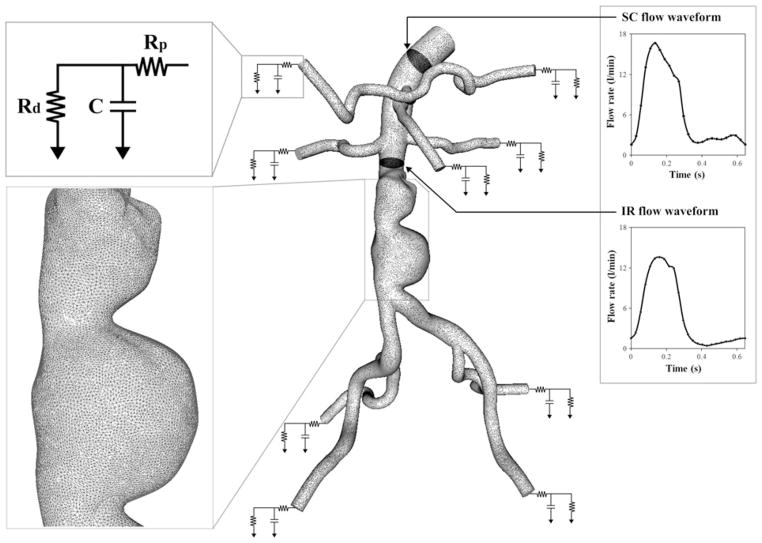
Blood flow in 3D models was simulated by solving the incompressible Navier–Stokes equations. Blood was assumed to be a Newtonian fluid with a density of 1.06 g/cm3 (1.06 × 10³ kg/m3) and a dynamic viscosity of 0.04 Poise (0.004 Pa s). The vessel walls were assumed to be rigid. We used a stabilized finite element method to obtain pressure and velocity fields.32,36 We prescribed the subject-specific boundary conditions at the inlet, and systematically adjusted the outlet boundary condition parameter values to approximate the measured IR flow waveform and blood pressure at the inlet (Fig. 2).29,30 At the inlet, we prescribed the volumetric flow waveform obtained from the PC-MRI data at the SC location using a Womersley velocity profile.38 At each outlet, we applied a three-element Windkessel (RCR) model to approximate the impedance of the downstream vasculature. The RCR model consists of proximal resistance (Rp), representing the resistance of the proximal arteries; capacitance (C), representing the compliance of the proximal arteries; and distal resistance (Rd), which is the resistance of the distal vessels, including arterioles and capillaries. This downstream analytic (RCR) domain was coupled with the upstream numerical domain using the coupled multi-domain method.35 Flow split ratio for each outlet was determined based on literature values.18,25 The shapes of the outlet velocity profiles were constrained to have parabolic velocity profiles to avoid divergence of the solution—a common occurrence with weakly enforced Windkessel boundary conditions.14
FIGURE 2.
A finite element mesh and boundary conditions: the magnified view of the mesh is shown at the aneurysm for subject 10; as an inlet boundary condition, supraceliac (SC) flow waveform was prescribed using a Womersley velocity profile38; For each outlet, a three-element Windkessel (RCR) model was used to represent the downstream impedance. Rp, C, and Rd parameter values represent a proximal resistance (Rp), the resistance of the proximal arteries, capacitance (C), the compliance of the proximal arteries, and distal resistance (Rd), the resistance of the distal vessels including arterioles and capillaries.35 These RCR parameter values for each outlet were initially chosen based on flow splits, total resistance, total compliance, and measured blood pressure; the infrarenal (IR) flow waveform was used as one of the objectives to systematically tune the RCR parameter values of outlets and match the simulated results closely to the measured IR flow waveform and blood pressure.29
Automated tuning algorithms were employed to adjust RCR parameter values and closely replicate the subject-specific IR flow waveform measured in the second imaging study and maximum and minimum blood pressure at the model inlet for each subject.29 With a coarse finite element mesh of linear tetrahedral elements (449,567 ± 173,646 elements), simulations were performed iteratively updating RCR parameter values until the objectives were satisfied within given tolerances: 0.5 mmHg for SBP and DBP, 0.06 L/min for peak-to-peak IR flow amplitude, and 0.03 L/min for diastolic mean IR flow. After we achieved the desired objectives, we ran the final simulation prescribing the tuned RCR parameter values with a refined mesh (2,072,450 ± 488,764 elements). The final simulation was performed for five cardiac cycles, and the simulation results from the last cardiac cycle were used to compute MWSS, OSI, PRT, particle residence index (PRI), and particle half-life time. More detailed descriptions of the flow simulation and automated tuning process can be found in articles by Les et al.,16 Spilker et al.,29 and Suh et al.30
Computation of MWSS and OSI
We computed MWSS by the following equation:
where T is the length of the cardiac cycle, and t⃗s is the wall shear vector which is the in-plane component of the surface traction t⃗ (t⃗s = t⃗ − (t⃗ · n⃗)n⃗). To quantify the unidirectionality of shear stress in the abdominal aorta, OSI was defined as:
OSI ranges from 0 to 0.5, where 0 indicates that the flow is unidirectional, and 0.5 indicates that the flow is purely oscillatory with zero time-average shear stress.4 For quantitative comparison, MWSS and OSI were averaged locally in 1-cm wide rings at three aortic locations: SC (distal edge located above the celiac trunk), IR (proximal edge located below the renal ostia), and mid-aneurysm (MA) (centered at the maximum aneurysm diameter).
Computation of Particle Residence Time
To quantify how long fluid particles stay in the aneurysm, we computed PRT, the minimum time needed for a fluid particle to leave the aneurysm domain.30 We seeded a mesh of particles that spanned the aneurysm domain, calculated the trajectory of each particle, and quantified the transit time of each particle. The particles were monitored for a maximum of 12 s. We assumed that the velocity field data used to integrate the particle trajectories was periodic. The particles were pushed back to the fluid domain when they contacted the lateral surface. For quantitative comparison of particle clearance, PRI was defined as the number of residing particles divided by the total number of initially released particles. Half-life time was defined as the time required for clearance of 50% of the total particles in the aneurysm domain, or the time when PRI became 0.5.
RESULTS
Measured Heart Rates and Blood Flows
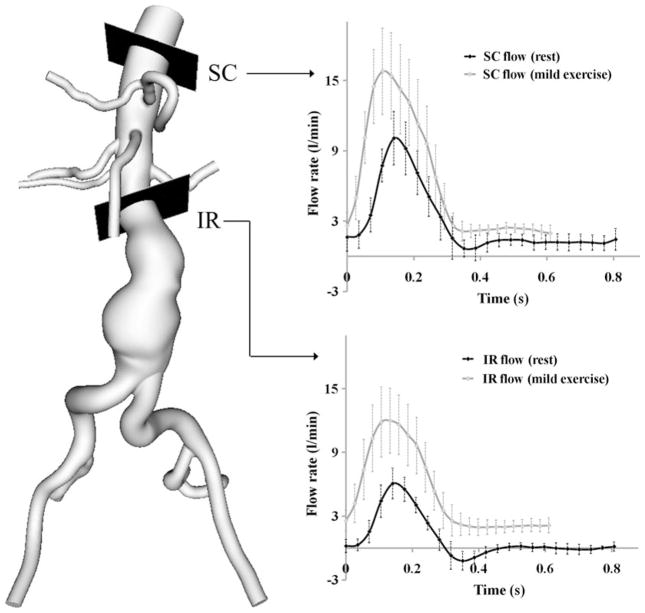
The measured mean resting heart rate was 72 ± 6 bpm. The measured heart rate at the mild exercise level was 95 ± 5 bpm representing a 33 ± 10% increase above the resting heart rate. At the moderate exercise level, heart rate was 116 ± 7 bpm representing a 63 ± 18% increase in the resting heart rate. The measured mean volumetric flow rate at the resting level was 2.8 ± 0.6 and 0.8 ± 0.1 L/min at the SC and IR locations, respectively. At the IR location, we observed retrograde flow during early diastole (Fig. 3). The measured mean volumetric flow rate at the mild exercise level was 6.2 ± 1.3 and 5.1 ± 1.2 L/min at the SC and IR locations. The retrograde IR flow during early diastole was eliminated with mild exercise. The mean SRBF was 1.9 ± 0.5 L/min at the resting level, and 1.1 ± 0.3 L/ min at the mild exercise level with a reduction of 41.1 ± 12.4%. The rest-to-exercise changes of mean SC flow, IR flow, and SRBF were statistically significant (p<0.0001). The rest-to-exercise increase in mean IR flow was greater than that of mean SC flow (p<0.0001).
FIGURE 3.
Measured volumetric flow rate at supraceliac (SC) and infrarenal (IR) locations at rest and mild exercise levels using a phase-contrast magnetic resonance imaging sequence. The flow rates represent the average of the peak-aligned curves for 10 subjects.
Simulation vs. Measurement
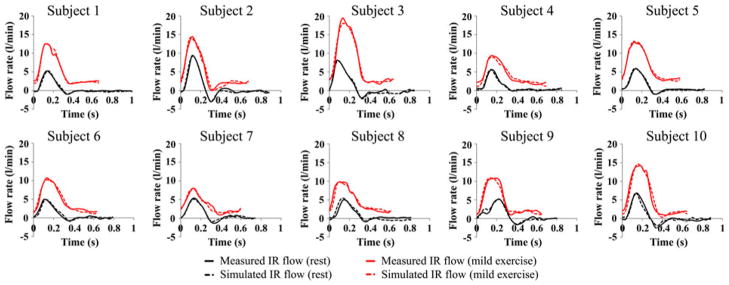
We compared the simulated IR flow waveforms with the measured IR flow waveforms (Fig. 4). The difference between the measured and simulated mean IR flow rate was 0.3 ± 0.2% at the resting level and 0.5 ± 0.4% at the mild exercise level. Comparison of the measured and simulated blood pressure values showed that the simulated maximum and minimum blood pressure values differed with the measured maximum and minimum blood pressure values by 2.5 ± 1.8% and 2.2 ± 4.8% at the resting level, and 2.0 ± 2.2% and 3.1 ± 4.8% at the mild exercise level, respectively.
FIGURE 4.
Comparison of measured infrarenal (IR) flow waveform (solid line) and simulated IR flow waveform (dashed line) during a single cardiac cycle at rest (black) and mild exercise levels (red) for all 10 subjects.
Velocity Magnitude
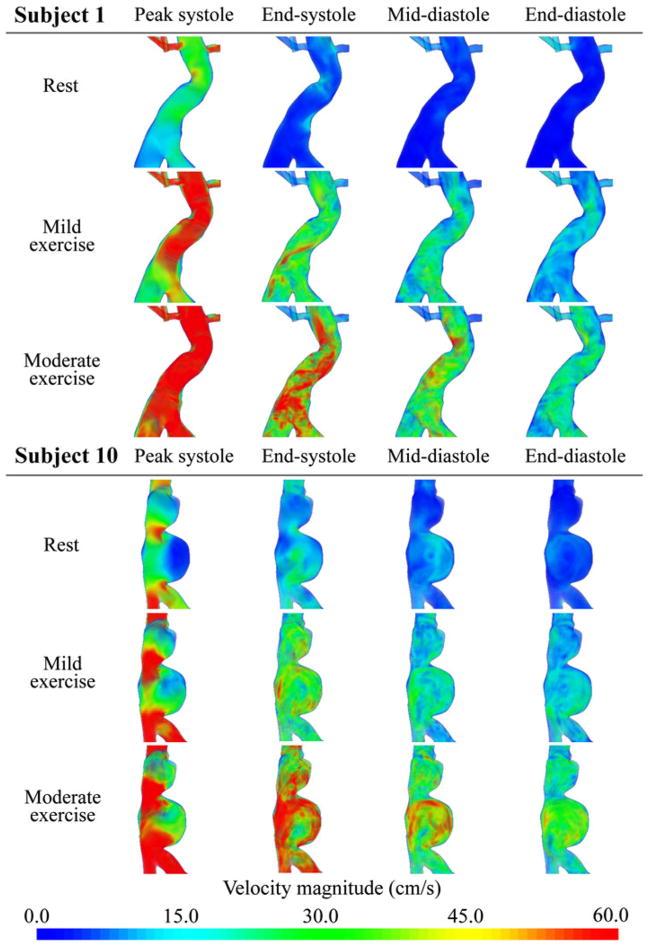
The flow simulations showed increasingly complex flow features as the level of activity increased from resting to mild exercise to moderate exercise. We visualized the magnitude of the ensemble average of the velocity for subjects 1 and 10 in Fig. 5 using a volume-rendering technique at four time points from the cardiac cycle. “Peak systole” was defined as the time point corresponding to the maximum SC flow during the cardiac cycle, “End-systole” was at the end of deceleration of SC flow, “Mid-diastole” was midway between end-systole and end-diastole, and “End-diastole” was right before the initiation of acceleration of SC flow. For subject 1 at rest, the velocity magnitude was nearly zero in the aneurysm during diastole, and there was reversal of flow at end-systole. During mild exercise, velocity magnitudes increased in the overall fluid domain at all four time points. At peak systole, a jet-like flow was observed from the top to MA, at end-systole, there was a spiral forward flow along the serpentine aneurysm geometry, and while the overall velocity magnitude decreased after peak systole, no flow reversal was observed. During moderate exercise, the velocity magnitudes increased further at all time points, and the spiral flow feature was more notable at end-systole compared to the mild exercise level. For subject 10 at the resting level, at endsystole we observed a straight jet flow along the vertical axis of the aneurysm, and flow stasis in the lower lobe of the aneurysm. At end-systole there was flow reversal, while at mid-diastole the flow in the upper lobe remained static as a slow and large counterclockwise vortex was observed in the lower lobe. During mild exercise, the static flow zone was nearly gone at peak systole, and no flow reversal was observed. During diastole, a complex mixing flow was observed in the upper lobe, and the counterclockwise vortex was more pronounced in the lower lobe. At the moderate exercise level, velocity magnitude in the aneurysm exceeded 30 cm/s at all time points, and the jet became stronger at peak systole. The complex flow features during diastole seemed similar to those at the mild exercise level.
FIGURE 5.
Volume rendering visualization of the magnitude of the ensemble average of the velocity field at rest, mild exercise, and moderate exercise levels at peak systole, end-systole, mid-diastole, and end-diastole in the cardiac cycle for subjects 1 and 10.
Mean Wall Shear Stress and Oscillatory Shear Index
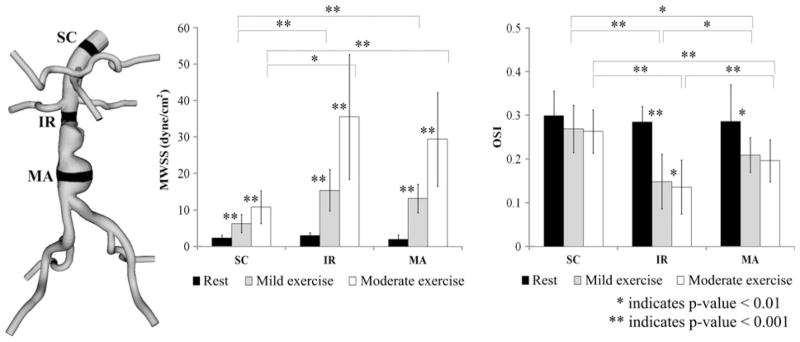
We computed MWSS and OSI from the 10 AAA subjects at three levels of activity. The averaged MWSS and OSI values at SC, IR, and MA locations at the resting, mild exercise, and moderate exercise levels are shown in Fig. 6. MWSS at the resting level was 2.3 ± 0.9, 2.9 ± 0.8, and 1.9 ± 1.2 dyne/cm2 at the SC, IR, and MA locations, respectively. At the mild exercise level, MWSS increased to 6.3 ± 2.5, 15.4 ± 5.7, and 13.2 ± 3.9 dyne/cm2 at the SC, IR, and MA locations, respectively. At the moderate exercise level, MWSS increased to 10.8 ± 4.5, 35.6 ± 17.1, and 29.4 ± 12.8 dyne/cm2 at the SC, IR, and MA locations, respectively. These changes of MWSS were statistically different at all three locations (p<0.001). OSI at the resting level was 0.29 ± 0.06, 0.29 ± 0.04, and 0.28 ± 0.07 at the SC, IR, and MA locations, respectively. OSI at the mild exercise level was 0.25 ± 0.06, 0.15 ± 0.05, and 0.20 ± 0.04 at the SC, IR, and MA locations, respectively. OSI at the moderate exercise level was 0.25 ± 0.05, 0.13 ± 0.05, and 0.19 ± 0.04 at the SC, IR, and MA locations, respectively. Statistically significant differences were observed at the IR location between the levels of activity (p<0.01). At the MA location, statistically significant differences were observed for resting vs. mild exercise levels and resting vs. moderate exercise levels (p<0.01). At the SC location, there were no statistical differences between the levels of activity for OSI. Between the aortic locations, we observed statistically significant differences in MWSS and OSI at mild exercise and moderate exercise (p<0.01 for SC vs. IR and SC vs. MA). At rest, we did not find statistical differences between SC, IR, and MA for MWSS or OSI.
FIGURE 6.
Mean wall shear stress (MWSS) and oscillatory shear index (OSI) values at rest (black), mild exercise (gray) and moderate exercise levels (white), averaged over 10 subjects. For each subject, MWSS and OSI values were computed in 1-cm strips at supraceliac (SC), infrerenal (IR), and mid-aneurysm (MA) locations.
Particle Tracing
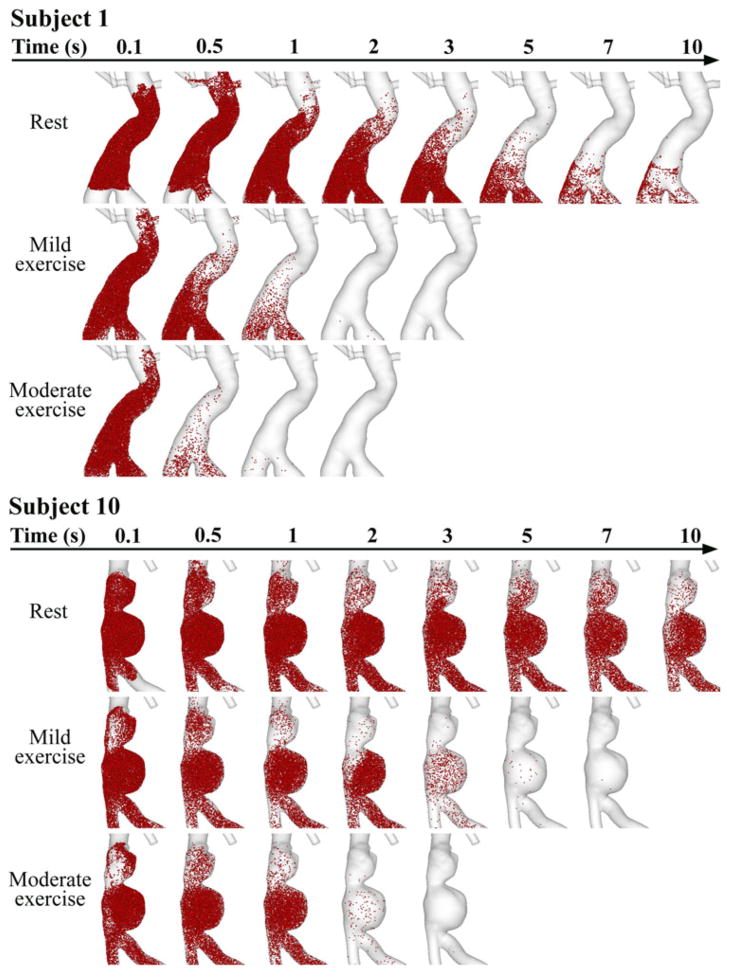
We released particles at 0 s from each aneurysm domain and traced them for 10 s. Particle distribution in the aneurysms of subjects 1 and 10 are visualized at time 0.1, 0.5, 1, 2, 3, 5, 7, and 10 s in Fig. 7. For subject 1 at the resting level, we observed alternating particle movement convected by forward and backward background flow fields, and some of the particles were carried backward to the renal arteries. Over successive cardiac cycles, particles moved slowly forward to downstream of the aneurysm. At 10 s, particles still resided in the lower portion of the aneurysm. At the mild exercise level, immediately after release, some particles moved backward to the renal branches due to SRBF extraction, but within 1 s, most particles moved notably downstream, and evacuated the aneurysm by 2 s. At the moderate exercise level, particle clearance was faster, and most particles were cleared out of the aneurysm within 1 s. For subject 10 at the resting level, alternating particle movement with very slow wash-out was observed, slower than that of subject 1. Particles seemed to reside at the lower lobe of the aneurysm for longer than 10 s. Particles accumulated and recirculated in the lower lobe, moving in the counterclockwise direction. At the mild exercise level, particles remained in the lower lobe at 1 s, some were cleared out at 2 s, and most of them were evacuated at 3–5 s. At the moderate exercise level, we observed particle recirculation in the lower lobe at 1 s, and most particles were cleared out of the aneurysm at 2–3 s.
FIGURE 7.
Particle tracing over successive time during rest, mild exercise, and moderate exercise in the aneurysms of subjects 1 and 10. Particles were released at 0 s, and monitored for 10 s. Note that at rest, a number of particles still resided in the lower portion of the aneurysm lobe at 10 s for both subjects. During mild exercise, most of the particles left the aneurysm at 2 and 5 s for subjects 1 and 10, respectively. During moderate exercise, most of the particles left the aneurysm at 1 and 2 s for subjects 1 and 10, respectively.
Particle Residence Time, Particle Residence Index, and Half-Life Time
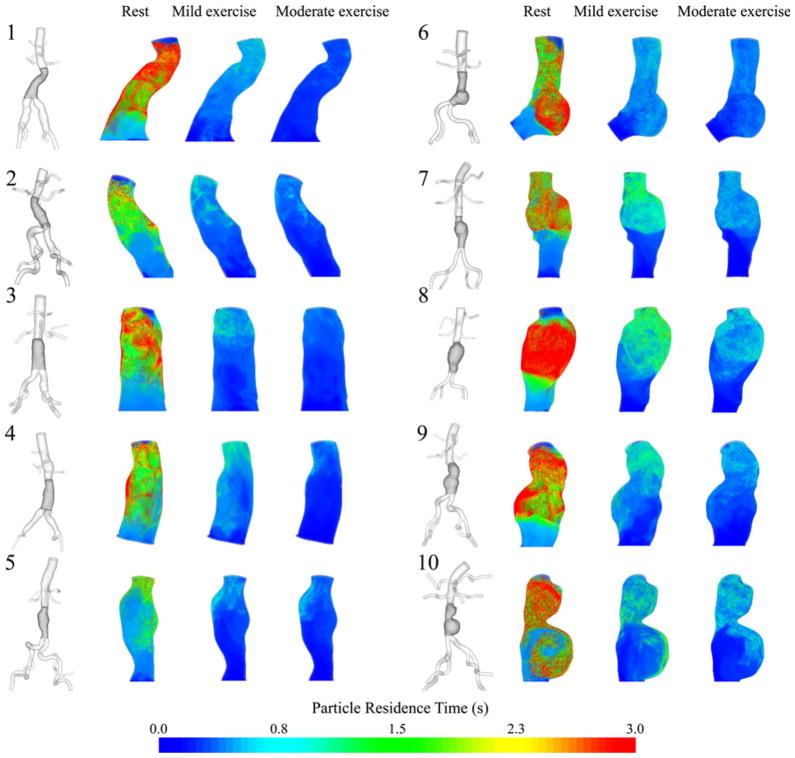
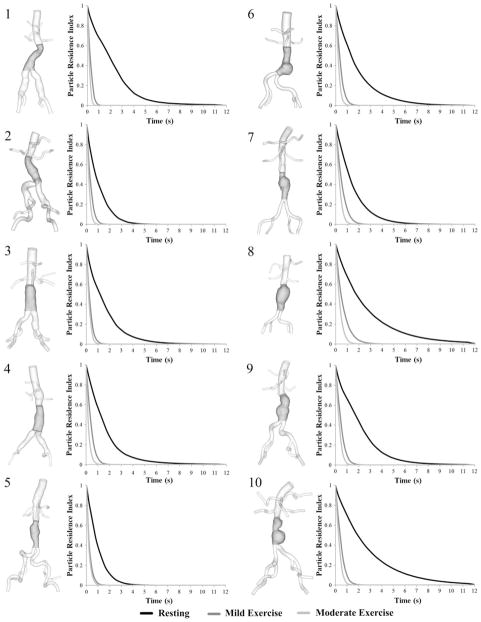
PRT in the aneurysm domain at resting, mild exercise, and moderate exercise levels are shown as contour plots for 10 subjects in Fig. 8. Volume rendering techniques were used to visualize the PRT in the aneurysm. Comparison of PRTs at three levels of activity revealed a notable reduction of PRT from the resting to the mild exercise level. A reduction of PRT from mild exercise to moderate exercise level was observed, however, differences were less remarkable. To quantify the changes in PRT with respect to the levels of activity, we computed PRI and half-life time for all subjects (Fig. 9, Table 1). At rest, particle clearance, the decline in PRI curve, varied by subjects. Subjects 8 and 10 with saccular aneurysms exhibited the slowest particle clearance, whereas subject 5 with a straight fusiform aneurysm exhibited the fastest particle clearance. At the mild exercise level, PRI declined to near zero within 3 s for all subjects. At the moderate exercise level, in most cases, PRI declined to near zero within 1.5 s. Comparing the particle half-life time at the resting level with respect to the length of the cardiac cycle, we observed a longer half-life time relative to the lengths of cardiac cycle for eight of 10 subjects, which means that it took longer than a single cardiac cycle to clear 50% of released particles for each of those eight subjects. At the exercise levels, we observed shorter half-life time compared to the length of the cardiac cycle by 41.8 ± 15.2% at the mild exercise level, and 56.4 ± 11.9% at the moderate exercise level. From the resting to the mild and moderate exercise levels, half-life time decreased by 73.8 ± 6.9% and 83.1 ± 4.7%, respectively.
FIGURE 8.
3D models of 10 subjects with the highlighted aneurysm domain for particle residence time (PRT) computation (left of each pair) and contour plots of PRT at rest, mild exercise, and moderate exercise levels (right of each pair). The contour plots of PRT were colorized based on the seeded positions of the particles. We chose PRT with particles released in mid-diastole.
FIGURE 9.
3D models of 10 subjects (left of each pair) and particle residence index (PRI) vs. time (right of each pair) at rest (black), mild exercise (dark gray) and moderate exercise levels (light gray). PRI were calculated at each second by dividing the number of residing particles by the total number of released particles.
TABLE 1.
Length of cardiac cycle and half-life time of 10 subjects during rest, mild exercise, and moderate exercise.
| Rest
|
Mild exercise
|
Moderate exercise
|
||||
|---|---|---|---|---|---|---|
| Length of cardiac cycle (s) | Half-life time (s) | Length of cardiac cycle (s) | Half-life time (s) | Length of cardiac cycle (s) | Half-life time (s) | |
| Subject 1 | 1.00 | 1.85 | 0.66 | 0.24 | 0.51 | 0.15 |
| Subject 2 | 0.88 | 0.77 | 0.67 | 0.28 | 0.50 | 0.17 |
| Subject 3 | 0.85 | 1.18 | 0.64 | 0.26 | 0.59 | 0.19 |
| Subject 4 | 0.85 | 1.24 | 0.69 | 0.35 | 0.50 | 0.16 |
| Subject 5 | 0.82 | 0.75 | 0.58 | 0.19 | 0.48 | 0.16 |
| Subject 6 | 0.79 | 1.33 | 0.63 | 0.34 | 0.54 | 0.20 |
| Subject 7 | 0.74 | 1.12 | 0.59 | 0.42 | 0.50 | 0.27 |
| Subject 8 | 0.81 | 1.75 | 0.61 | 0.46 | 0.50 | 0.27 |
| Subject 9 | 0.80 | 1.73 | 0.65 | 0.41 | 0.57 | 0.27 |
| Subject 10 | 0.88 | 1.92 | 0.65 | 0.49 | 0.52 | 0.31 |
DISCUSSION
We reported numerical simulation results resolving complex blood flow features and particle clearance in aneurysms at resting, mild exercise, and moderate exercise levels using subject-specific aneurysm morphology and volumetric blood flow waveforms measured at two aortic locations, SC and IR, for 10 AAA subjects. We used physiologic exercise flow waveforms acquired with MRI during actual lower-limb cycling exercise (mild exercise), and generated flow waveforms at a higher-intensity exercise level (moderate exercise) by extrapolating the measured flow data for each subject. In contrast to dramatic hemodynamic changes from the resting to mild exercise levels, differences between mild exercise and moderate exercise were not as significant suggesting that rest-to-exercise changes of OSI and PRT may not have a proportional relationship with respect to exercise intensity.
We observed an augmentation of mean flow at both SC and IR locations and a removal of retrograde diastolic flow at the IR location from the resting to the mild exercise level (Fig. 3). The increase of the mean IR flow was approximately 2.5-fold greater than that of mean SC flow. We observed reduction of SRBF from the resting to the mild exercise level, changes that may result from the local vasoconstriction of arterioles of splanchnic organs and kidneys. Resultant redistribution of blood flow supply more blood to the active muscles. Comparison of the simulated IR flow waveforms and the measured IR flow waveforms showed that our simulated IR flow agreed well with the measured IR flow at the resting and mild exercise levels (Fig. 4). When considering the challenges of matching the downstream flow waveform and blood pressure with the measured data, an automated boundary condition tuning algorithm appears to be a useful tool for simulating subject-specific flow patterns in aneurysms.
We computed three-dimensional velocity fields for each AAA model, and observed notable changes in velocity magnitude and more complex flow patterns as the level of activity increased (Fig. 5). Near-zero or stagnant flow patterns in the aneurysm observed during diastole at the resting level were not seen at the higher levels of activity. Instead, jet-like flow during peak systole, and complex flow patterns during diastole were observed at both levels of exercise for both subjects. Although we only presented two subjects in Fig. 5, we consistently observed the augmentation of velocity magnitude and removal of static flow in other subjects. Moreover, high-speed vortices were formed after peak systole at the saccular aneurysms of subjects 6, 7, 8, 9, and 10 during exercise. Due to the increase in exercise-induced mean blood flow and the elimination of retrograde diastolic flow, the resulting flow field became more complex and the mixing of aneurysmal blood appeared to be enhanced. Les et al. documented a moderate level of turbulence in aneurysms under simulated exercise conditions.16 Such exercise-induced flow patterns with increased flow magnitude and moderate turbulence reduce regions of flow stasis that have been correlated with thrombus development.1,9,17 Comparing flow changes for mild and moderate exercise, we observed similar flow patterns of jet-like flow and eddy formation for both exercise levels, with overall augmentation of velocity magnitudes from mild to moderate exercise.
Computation of MWSS and OSI revealed that the athero-prone shear conditions at the resting level (relatively low MWSS and high OSI), diminished as the level of activity increased (Fig. 6). Changes in MWSS and OSI values during exercise were greater at the IR and MA locations compared to the SC locations. At the IR and MA locations, increases in MWSS from the resting to moderate exercise were greater than the increases from resting to mild exercise due to further augmentation of IR flow. Interestingly, however, changes in OSI were not significantly different between rest to mild exercise vs. rest to moderate exercise transitions. OSI values at the moderate exercise level were barely greater than OSI values at the mild exercise level at the SC, IR, and MA locations. Les et al. reported that OSI values were not reduced to zero in the aneurysm at a simulated exercise level with 50% elevation of heart rate.16 In the aneurysm, it seems that the diametric expansion and exercise-induced turbulence may introduce oscillatory components to the flow during exercise, hence preventing OSI from reducing to zero at higher exercise intensities. This is supported by the presence of moderate turbulence in the aneurysm during exercise.16
To demonstrate the incidence of particle recirculation in AAAs and their response to exercise, we traced the released particles for 10 s at three levels of activity in two distinctly different aneurysm geometries. The particle residence was longer than 10 s for both aneurysms at the resting level, and there were different degrees of particle clearance enhancement at the mild and moderate exercise levels for the two different aneurysms (Fig. 7). At the resting level, a number of particles were not washed out by 5 s possibly due to slow and stagnant flow (subject 1) or recirculating flow (subject 10). In such regions of flow stagnation and recirculation, platelet activation process may be initiated and completed within 1–5 s.3 At the graded exercise levels, most particles were cleared within 5 s, notably faster than that at the resting level. The enhancement of particle clearance (below 5 s) that occurs with mild intensity exercise may be sufficient to decrease the incidence of platelet activation. For subject 1 with the diffuse aneurysm, no particle recirculation was observed in the aneurysm at all levels of physical activity. The lack of recirculation facilitated the bulk flow of particles through the lumen of the diffuse aneurysm. On the other hand, for subject 10 with the bi-lobed saccular aneurysm, particles seemed to be trapped by a rotating flow field for ≥1 s in the lower lobe, not only at the resting level but also at exercise levels. The recirculation zone of subject 10 may be responsible for the differences in particle clearance when compared to that of subject 1.
We observed long PRT (longer than 3 s) regions at the resting level for most of our subjects, and the reduction or absence of those long PRT regions as the level of activity increased to the mild exercise and moderate exercise levels (Fig. 8). A long PRT region localized along the concaved lumen boundaries of the aneurysm demonstrates that particles released from this region stayed in the aneurysm for longer than 3 s. At the mild exercise level, the PRT decreased notably for all subjects. At the moderate exercise level, PRT decreased further, and most of the particles seemed to be cleared out within a second. Further quantitative analysis using PRI and half-life time revealed that the half-life time difference was <0.2 s between the mild and the moderate exercise levels, and the time difference to clear out all of the particles was approximately 1 s or less (Fig. 9, Table 1). Compared to the dramatic enhancement of particle clearance from the resting to the mild exercise level, additional increases in exercise intensity above mild exercise may not enhance the particle clearance significantly.
From these results, both levels of exercise appear to enhance the clearance of particles and reduce flow stasis. Moreover, changes in blood flow at the mild exercise level induced notable reduction of PRT, whereas the further reduction of PRT from mild to moderate exercise was not pronounced. Assuming that reduction in flow stasis is the primary benefit of exercise in AAA, our findings suggest that the therapeutic effect of exercise may not necessarily be proportional to exercise intensity; mild exercise may yield as much benefit for AAA patient as that of moderate exercise. Elderly patients often cannot increase their heart rate up to the usual suggested target exercise level. We demonstrated that major hemodynamic changes occur at the mild exercise level, therefore, patients who are not capable of moderate exercise may also experience attenuated aneurysmal growth by performing mild exercise.
For our flow simulations, we assumed rigid walls and that blood was a Newtonian fluid. The vessel walls of thrombus-burdened AAAs in elderly subjects are reported to be rigid compared to that of abdominal aortas in healthy young subjects. However, the abdominal aorta may play an important role in the Windkessel effect of the vasculature, and outflow phase shifts and attenuation may occur due to abdominal aortic wall compliance, which we were not able to replicate in this study. Moreover, the assumption of a Newtonian fluid may underestimate shear stress values in AAAs. Although non-Newtonian behavior is generally not significant in large arteries, the sudden geometric expansion of an aneurysm may induce complex flow features that may affect local cell aggregation and hence blood viscosity.13
Our extrapolated flow waveforms to simulate the AAA hemodynamics during moderate exercise may not precisely represent real moderate exercise flow waveforms. We compared the estimated vs. measured moderate exercise flow waveforms of one subject who was able to perform moderate exercise in the magnet. We overestimated both SC and IR flow waveforms by about 17%, suggesting that we were simulating a more strenuous exercise condition than reality. However, if the real moderate exercise condition is in between our mild exercise and estimated moderate exercise conditions, we expect similar or lower reductions of OSI and PRT. Also note that the observations of dramatic enhancement of particle clearance and reduction of oscillatory shear during mild exercise are unequivocal.
In addition, our mesh element size may not be sufficiently refined for computation of particle trajectories and wall shear stress. Les et al. demonstrated that MWSS values at resting level for three meshes, 2.2-, 8.3- and 31.8-million elements differed by 4–6 dyne/ cm2 at IR and MA locations, and OSI values for the three meshes differed by 0.1–0.2 at IR and MA locations. Also, the discrepancy of velocity magnitudes at the MA location was observed from the three meshes, suggesting that our mesh should be refined further in order to represent the complex flow features in AAAs, especially during exercise conditions.16 Although our results were based on 2.1-million element mesh due to computational cost and storage issues, finer mesh resolutions may be needed for future work.
CONCLUSIONS
We presented quantitative results on characteristic hemodynamics of AAA at rest and two graded lower-limb exercise levels. At the resting level, we observed relatively low MWSS, high OSI, and long PRT in the abdominal aorta. As the level of activity increased from the resting to mild exercise and moderate exercise levels, MWSS increased and OSI decreased, especially below the renal arteries in the abdominal aorta. PRT was also decreased from the resting to the graded exercise levels. Notable reductions in OSI and PRT occurred from rest to mild exercise, whereas further reduction of OSI and PRT from mild to moderate exercise was not pronounced. We suggest that the mild exercise level may be sufficient to reduce oscillatory and stagnant hemodynamic conditions in AAA. Our results are preliminary and are from a small sample size, so more prospective and quantitative evidence is needed to verify how exercise affects the pathophysiology of AAA. However, we provided data that can be used to explain potential benefits of physical activity in this patient population, and illustrated the relative differences in hemodynamics of the abdominal aorta (blood flow waveform, MWSS, OSI, and PRT), between the resting, mild exercise, and moderate exercise levels.
Acknowledgments
This research was supported by the National Institutes of Health (P50 HL083800, P41 RR09784), the Lucas Center for Magnetic Resonance Imaging, and the Veterans Affairs Palo Alto Health Care System (VAPAHCS) for the acquisition of experimental data, and NSF (CNS-0619926) for computer resources. Allen Chiou, Victoria Yeh, Yash Narang, and Bartlomiej R. Imielski provided assistance with imaging and modeling. Nan Xiao provided help with quantification of PRT data. We thank all research subjects for their participation.
ABBREVIATIONS
- AAA
Abdominal aortic aneurysm
- CFD
Computational fluid dynamics
- DBP
Diastolic blood pressure
- IR
Infrarenal
- MA
Mid-aneurysm
- MRI
Magnetic resonance imaging
- MWSS
Mean wall shear stress
- OSI
Oscillatory shear index
- PRI
Particle residence index
- PRT
Particle residence time
- RCR
Resistance (proximal)–capacitance–resistance (distal)
- SC
Supraceliac
- SBP
Systolic blood pressure
- SRBF
Splanchnic and renal blood flows
References
- 1.Bluestein D, Niu L, Schoephoerster RT, Dewanjee MK. Steady flow in an aneurysm model: correlation between fluid dynamics and blood platelet deposition. J Biomech Eng. 1996;118:280–286. doi: 10.1115/1.2796008. [DOI] [PubMed] [Google Scholar]
- 2.Boussel L, Rayz V, McCulloch C, Martin A, Acevedo-Bolton G, Lawton M, Higashida R, Smith WS, Young WL, Saloner D. Aneurysm growth occurs at region of low wall shear stress: patient-specific correlation of hemodynamics and growth in a longitudinal study. Stroke. 2008;39:2997–3002. doi: 10.1161/STROKEAHA.108.521617. [DOI] [PMC free article] [PubMed] [Google Scholar]
- 3.Cao J, Rittgers SE. Particle motion within in vitro models of stenosed internal carotid and left anterior descending coronary arteries. Ann Biomed Eng. 1998;26:190–199. doi: 10.1114/1.131. [DOI] [PubMed] [Google Scholar]
- 4.Cheng CP, Herfkens RJ, Taylor CA. Abdominal aortic hemodynamic conditions in healthy subjects aged 50–70 at rest and during lower limb exercise: in vivo quantification using MRI. Atherosclerosis. 2003;168:323–331. doi: 10.1016/s0021-9150(03)00099-6. [DOI] [PubMed] [Google Scholar]
- 5.Dai G, Kaazempur-Mofrad MR, Natarajan S, Zhang Y, Vaughn S, Blackman BR, Kamm RD, Garcia-Cardena G, Gimbrone MA., Jr Distinct endothelial phenotypes evoked by arterial waveforms derived from atherosclerosis-susceptible and -resistant regions of human vasculature. Proc Natl Acad Sci. 2004;101(41):14871–14876. doi: 10.1073/pnas.0406073101. [DOI] [PMC free article] [PubMed] [Google Scholar]
- 6.Dalman RL, Tedesco MM, Myers J, Taylor CA. AAA disease: mechanism, stratification, and treatment. Ann NY Acad Sci. 2006;1085:92–109. doi: 10.1196/annals.1383.008. [DOI] [PubMed] [Google Scholar]
- 7.De Meirelles LR, Mendes-Ribeiro AC, Mendes MA, da Silva MN, Ellory JC, Mann GE, Brunini TM. Chronic exercise reduces platelet activation in hypertension: upregulation of the L-arginine-nitric oxide pathway. Scand J Med Sci Sports. 2009;19:67–74. doi: 10.1111/j.1600-0838.2007.00755.x. [DOI] [PubMed] [Google Scholar]
- 8.DeSouza CA, Shapiro LF, Clevenger CM, Dinenno FA, Monahan KD, Tanaka H, Seals DR. Regular aerobic exercise prevents and restores age-related declines in endothelium-dependent vasodilation in healthy men. Circulation. 2000;102:1351–1357. doi: 10.1161/01.cir.102.12.1351. [DOI] [PubMed] [Google Scholar]
- 9.Einav S, Bluestein D. Dynamics of blood flow and platelet transport in pathological vessels. Ann NY Acad Sci. 2004;1015:351–366. doi: 10.1196/annals.1302.031. [DOI] [PubMed] [Google Scholar]
- 10.Hope SA, Tay DB, Meredith IT, Cameron JD. Waveform dispersion, not reflection, may be the major determinant of aortic pressure wave morphology. Am J Physiol Heart Circ. 2005;289:H2497–H2502. doi: 10.1152/ajpheart.00411.2005. [DOI] [PubMed] [Google Scholar]
- 11.Hoshina K, Sho E, Sho M, Nakahashi TK, Dalman RL. Wall shear stress and strain modulate experimental aneurysm cellularity. J Vasc Surg. 2003;37:1067–1074. doi: 10.1016/s0741-5214(03)70052-4. [DOI] [PubMed] [Google Scholar]
- 12.Humphrey JD, Taylor CA. Intracranial and abdominal aortic aneurysms: similarities, differences, and need for a new class of computational models. Annu Rev Biomed Eng. 2008;10:221–246. doi: 10.1146/annurev.bioeng.10.061807.160439. [DOI] [PMC free article] [PubMed] [Google Scholar]
- 13.Khanafer KM, Gadhoke P, Berguer R, Bull JL. Modeling pulsatile flow in aortic aneurysms: effect of nonnewtonian properties of blood. Biorheology. 2006;43:661–679. [PubMed] [Google Scholar]
- 14.Kim HJ, Figueroa CA, Hughes TJ, Jansen KC, Taylor CA. Augmented lagrangian method for constraining the shape of velocity profiles at outlet boundaries for three-dimensional finite element simulations of blood flow. Comput Methods Appl Mech Eng. 2009;198:3551–3566. [Google Scholar]
- 15.Laughlin MH. Cardiovascular response to exercise. Am J Physiol. 1999;277:244–259. doi: 10.1152/advances.1999.277.6.S244. [DOI] [PubMed] [Google Scholar]
- 16.Les AS, Shadden SC, Figueroa CA, Park JM, Tedesco MM, Herfkens RJ, Dalman RL, Taylor CA. Quantification of hemodynamics in abdominal aortic aneurysms during rest and exercise using magnetic resonance imaging and computational fluid dynamics. Ann Biomed Eng. 2010;38:1288–1313. doi: 10.1007/s10439-010-9949-x. [DOI] [PMC free article] [PubMed] [Google Scholar]
- 17.Malek AM, Alper SL, Izumo S. Hemodynamic shear stress and its role in atherosclerosis. J Am Med Assoc. 1999;282:2035–2042. doi: 10.1001/jama.282.21.2035. [DOI] [PubMed] [Google Scholar]
- 18.Moore JE, Jr, Ku DN. Pulsatile velocity measurements in a model of the human abdominal aorta under resting conditions. J Biomech Eng. 1994;116:337–346. doi: 10.1115/1.2895740. [DOI] [PubMed] [Google Scholar]
- 19.Moore JE, Jr, Xu C, Glagov S, Zarins CK, Ku DN. Fluid wall shear stress measurements in a model of the human abdominal aorta: oscillatory behavior and relationship to atherosclerosis. Atherosclerosis. 1994;110:225–240. doi: 10.1016/0021-9150(94)90207-0. [DOI] [PubMed] [Google Scholar]
- 20.Myers JN, White JJ, Narasimhan B, Dalman RL. Effects of exercise training in patients with abdominal aortic aneurysm: preliminary results from a randomaized trial. J Cardiopulm Rehabil Prev. 2010;30:374–383. doi: 10.1097/HCR.0b013e3181ebf2db. [DOI] [PubMed] [Google Scholar]
- 21.Nakahashi TK, Hoshina K, Tsao PS, Sho E, Sho M, Karwowski JK, Yeh C, Yang RB, Topper JN, Dalman RL. Flow loading induces macrophage antioxidative gene expression in experimental aneurysms. Arterioscler Thromb Vasc Biol. 2002;22:2017–2022. doi: 10.1161/01.atv.0000042082.38014.ea. [DOI] [PubMed] [Google Scholar]
- 22.Nelson ME, Rejeski WJ, Blair SN, Duncan PW, Judge JO, King AC, Macera CA, Castaneda-Seppa C. Physical activity and public health in older adults. Recommendation from the American College of Sports and Medicine and the American Heart Association. Circulation. 2007;116:1094–1105. doi: 10.1161/CIRCULATIONAHA.107.185650. [DOI] [PubMed] [Google Scholar]
- 23.Osada T, Katsumura T, Hamaoka T, Inoue S, Esaki K, Sakamoto A, Murase N, Kajiyama J, Shimomitsu T, Iwane H. Reduced blood flow in abdominal viscera measured by Doppler ultrasound during one-legged knee extension. J Appl Physiol. 1999;86:709–719. doi: 10.1152/jappl.1999.86.2.709. [DOI] [PubMed] [Google Scholar]
- 24.Plehn G, Vormbrock J, Butz T, Christ M, Trappe H, Meissner A. Different effect of exercise on left ventricular diastolic time and interventricular dyssnchrony in heart failure patients with and without left bundle branch block. Int J Med Sci. 2008;5:333–340. doi: 10.7150/ijms.5.333. [DOI] [PMC free article] [PubMed] [Google Scholar]
- 25.Raines JK, Jaffrin MY, Shapiro AH. A computer simulation of arterial dynamics in the human leg. J Biomech. 1974;7:77–91. doi: 10.1016/0021-9290(74)90072-4. [DOI] [PubMed] [Google Scholar]
- 26.Rowell LB. Human Cardiovascular Control. New York: Oxford University Press; 1993. p. 212. [Google Scholar]
- 27.Rubler S, V, Fisher J, Schreiber SS, Rothschild MA, Dobin AS. Left ventrivular ejection time during exercise testing with scintigraphy. Arch Intern Med. 1984;144:1386–1391. [PubMed] [Google Scholar]
- 28.Sakalihasan N, Limet R, Defawe OD. Abdominal aortic aneurysm. Lancet. 2005;365:1577–1589. doi: 10.1016/S0140-6736(05)66459-8. [DOI] [PubMed] [Google Scholar]
- 29.Spilker RL, Taylor CA. Tuning multiscale hemodynamic simulations to match physiological measurements. Ann Biomed Eng. 2010;38:2635–2648. doi: 10.1007/s10439-010-0011-9. [DOI] [PubMed] [Google Scholar]
- 30.Suh G, Les AS, Tenforde AS, Shadden SC, Spilker RL, Yeung JJ, Cheng CP, Herfkens RJ, Dalman RL, Taylor CA. Quantification of particle residence time in abdominal aortic aneurysms using magnetic resonance imaging and computational fluid dynamics. Ann Biomed Eng. 2011;29:864–883. doi: 10.1007/s10439-010-0202-4. [DOI] [PMC free article] [PubMed] [Google Scholar]
- 31.Tang BT, Cheng CP, Draney MT, Wilson NM, Tsao PS, Herfkens RJ, Taylor CA. Abdominal aortic hemodynamics in young healthy adults at rest and during lower limb exercise: quantification using image-based computer modeling. Am J Physiol Heart Circ Physiol. 2006;291:668–676. doi: 10.1152/ajpheart.01301.2005. [DOI] [PubMed] [Google Scholar]
- 32.Taylor CA, Hughes TJR, Zarins CK. Finite element modeling of blood flow in arteries. Comput Methods Appl Mech Eng. 1998;158:155–196. [Google Scholar]
- 33.Taylor CA, Hughes TJR, Zarins CK. Effect of exercise on hemodynamic conditions in the abdominal aorta. J Vasc Surg. 1999;29:1077–1089. doi: 10.1016/s0741-5214(99)70249-1. [DOI] [PubMed] [Google Scholar]
- 34.Tenforde AS, Cheng CP, Suh G, Herfkens RJ, Dalman RL, Taylor CA. Quantifying in vivo hemodynamic response to exercise in patients with intermittent claudication and abdominal aortic aneurysms using cine phase-contrast MRI. J Magn Reson Imaging. 2010;31:425–429. doi: 10.1002/jmri.22055. [DOI] [PMC free article] [PubMed] [Google Scholar]
- 35.Vignon-Clementel IE, Figueroa CA, Jensen KE, Taylor CA. Outflow boundary conditions for three-dimensional finite element modeling of blood flow and pressure in arteries. Comput Methods Appl Mech Eng. 2006;195:3776–3796. [Google Scholar]
- 36.Whiting CH, Jansen KC. A stabilized finite element method for the incompressible Navier–Stokes equations using a hierarchical basis. Int J Numer Methods Fluids. 2001;35:93–116. [Google Scholar]
- 37.Wilson N, Wang K, Dutton RW, Taylor CA. A software framework for creating patient specific geometric models from medical imaging data for simulation based medical planning of vascular surgery. Lect Notes Comput Sci. 2001;2208:449–456. [Google Scholar]
- 38.Womersley JR. Method for the calculation of velocity, rate of flow and viscous drag in arteries when the pressure gradient in known. J Physiol. 1955;127:553–563. doi: 10.1113/jphysiol.1955.sp005276. [DOI] [PMC free article] [PubMed] [Google Scholar]
- 39.Zarins CK, Giddens DP, Bharadvaj BK, Sottiurai VS, Mabon RF, Glagov S. Carotid bifurcation atherosclerosis. Quantitative correlation of plaque localization with flow velocity profiles and wall shear stress. Circ Res. 1983;53:502–514. doi: 10.1161/01.res.53.4.502. [DOI] [PubMed] [Google Scholar]


