Abstract
Purpose
Both the prevalence of obesity and urolithiasis in children has increased over time. We sought to evaluate the relationship between body mass and urolithiasis in children.
Methods
We performed a matched case-control study in a network of 30 primary care pediatric practices. Cases included subjects with ICD-9 codes for urolithiasis and controls were matched on age, length of observation time prior to the index date, and clinic practice. Age and sex-specific z-BMI scores at the time of stone episode were calculated. Continuous z-BMI scores and clinical weight categories were evaluated with covariates including race, ethnicity, gender, and payer status. Odds ratios and 95% CIs were calculated using multivariable conditional logistic regression.
Results
We identified 110 cases and 396 matched controls. The proportion of subjects who were overweight or obese was 1.9% and 3.7% among cases and 4.3% and 4.5% among controls. On multivariable conditional logistic regression analysis, continuous z-BMI score (OR 0.84; p=.18; 95% CI 0.63, 1.12), overweight status (OR 0.13; 95% CI 0.01, 1.18) and obese status (OR 0.18; 95% CI 0.02, 1.40) were not associated with urolithiasis. However, African-American race (OR 0.35; 95% CI 0.15, 0.85) and Medicaid payer status (OR 0.47; 95% CI 0.24, 0.93) were both associated with a significant reduction in the odds of urolithiasis.
Conclusion
High body mass was not associated with urolithiasis within our primary care pediatric practice network. However, African-American race and Medicaid payer status were associated with reduced odds of urolithiasis.
Keywords: obesity, pediatric, kidney stone, urolithiasis, race, payer status
INTRODUCTION
A growing body of evidence supports an association between higher body mass and the development of kidney stones in adults.1,2 This association has been observed in the context of both a recent rise in both the prevalence of obesity and adult kidney stone disease.3,4 Several studies have implicated metabolic alterations seen with higher body mass as plausible biologic mechanisms linking obesity and stone formation.5,6
Data from the 2007-2008 National Health and Nutrition Examination Survey (NHANES) showed the rising prevalence of high body mass in children and adolescents has stabilized, but nearly a third of all children and adolescents were still categorized as either overweight or obese.7 Concurrently, reports have suggested a rising burden of kidney stone disease within pediatric populations, leading some to postulate an association between high body mass and stone disease in children and adolescents. 8,9,10
To date, there has been little direct evidence to support the association of high body mass and kidney stone formation in children. To address this, we sought to determine the relationship between body-mass index and a diagnosis of kidney stone disease within a primary care pediatric setting.
METHODS
Study Design
Matched, case-control study.
Setting
Subjects were drawn from the Children’s Hospital of Philadelphia (CHOP) primary care practice network comprised of 30 outpatient clinics which share a common electronic health record (EHR). The protocol was approved by the CHOP Institutional Review Board.
Data Source
We abstracted data from the practice network EHR which contains data on outpatient visits, ER visits, inpatient visits, laboratory data, radiographic data, and medication data, as well as reports scanned from outside the practice network. Demographic information and ICD-9 codes were obtained from administrative data.
To limit the impact of missing data and misclassification, targeted paper chart review was performed to assess information missing from the EHR as a result of the transition from paper to electronic format.
Case/Control Selection
Case were identified as all patients aged 21 years or younger seen between January 1, 2002 and July 1, 2009 with an ICD-9 code for urolithiasis (592.0, 592.1, 594.1, 594.2, 274.11) and at least two visits to one of the outpatient clinic practices.
Validation of a urolithiasis diagnosis was based on corroborating radiographic or clinical documentation. We assigned an index date for each case on the first date a stone came to medical attention. We excluded cases with known abnormal anatomy or complex urinary reconstruction associated with urolithiasis and those on potential lithogenic medication within +/− 30 days of the index date.
We used incidence density sampling to randomly select up to four control subjects for each case from a risk set assembled from the primary practice network cohort without an ICD-9 for urolithiasis and BMI data available within 30 days of the index date. Controls were matched on (1) practice location, (2) age +/− 90 days on the index date, and (3) prior length of observation in a clinic practice within +/− 180 days of the index date. To validate the absence of urolithiasis in controls, a random 20% sample of controls was selected for chart review.
Exposure Variable Construction
The primary exposure variable was BMI normalized for age and sex. BMI was calculated as weight(kg)/height(m)2. Based on age and sex-specific BMI distributions from 276,733 patients within our practice network, BMI nomograms were generated. Calculated BMI was then normalized by subject age and sex to generate a continuous z-BMI score which corresponds directly to a BMI percentile.
Few cases had both height and weight documented on the exact date of stone episode. If both were documented within 90 days of index date, they were used to calculate BMI. If height was not available within 90 days but weight was available, we used linear regression of heights to impute a height to calculate BMI. If neither height nor weight values were available within 90 days, we used linear regression of existing BMIs to impute BMI on the index date.
Data Analysis
Either Pearson’s chi-squared or Fisher’s exact tests were used to test associations between sex, race, ethnicity, payer status, clinical age categories, z-BMI categories and case/control status. Student’s t-test was used for continuous z-BMI score. Non-parametric tests for trend were performed on ordinal variables. We then conducted univariable conditional logistic regression with each covariate as independent predictor. An a priori Wald p-value <0.15 was used for inclusion in a multivariable conditional logistic regression. z-BMI was included in our multivariable model despite a Wald p >0.15. We analyzed BMI as both a continuous variable (z-BMI) and as a categorical variable based on clinical weight categories recommended by Barlow et al: underweight <5%, normal weight ≥5%-<85%, overweight ≥85%-<95%, and obese ≥95%.11
Interaction terms between race/payer status and z-BMI status/age categories were evaluated by a likelihood ratio chi-squared test of nested models.
RESULTS
Assembly of Study Cohort
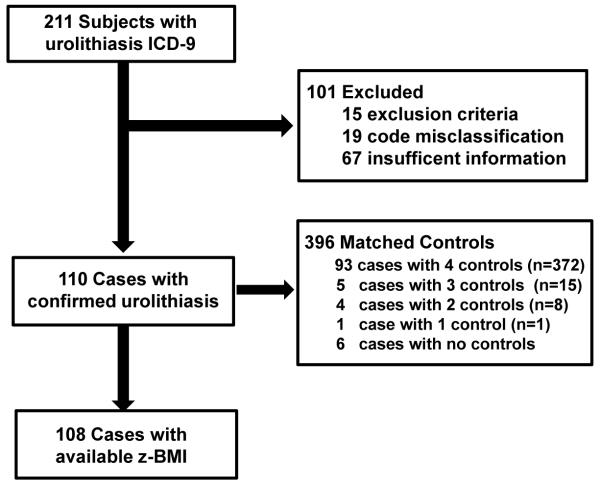
110 cases with a confirmed diagnosis of urolithiasis met selection criteria and underwent matching of controls. A total of 396 controls were identified for analysis. Ninety-three cases (84.5%) had 4 controls, 5 cases (4.5%) had 3 controls, 4 cases (3.6%) had 2 controls, and 1 case (0.9%) had 1 control. Seven cases (6.5%) had no matched controls (Figure 1).
Figure 1. Study Cohort Construction.
Clinical Characteristics of Cases and Controls
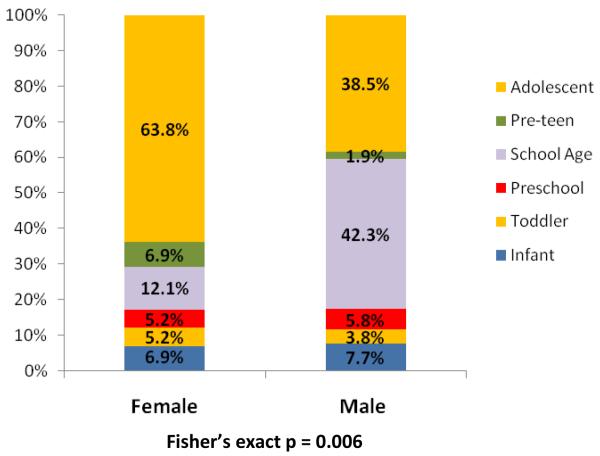
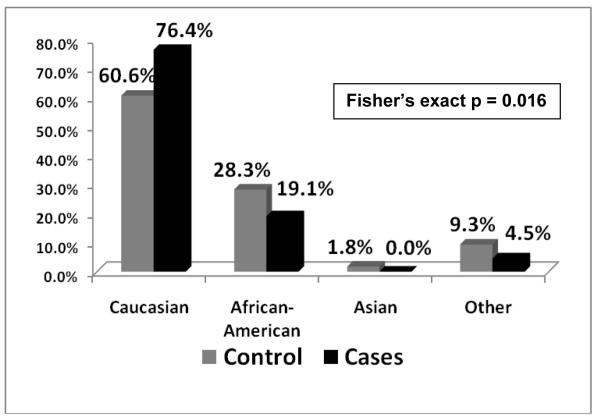
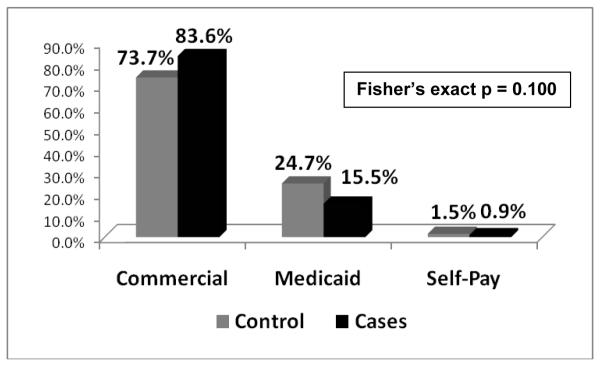
For both cases and controls, median age was 12.4 years. Over half of all subjects were adolescents (>13 years) and a quarter were of school age (5 to 11 years). Amongst cases, a significant difference in age distributions across genders existed that was not seen in controls (p = 0.006). A majority of female cases (63.8%) were adolescents, whereas 42.3% of male cases were school age and only 38.5% were adolescents (Figure 2). There was a lower proportion of African-American cases (19.1%) than controls (28.3%) (p = 0.016, Figure 3). A higher proportion of cases had commercial insurance (83.6%) than controls (73.7%), but this was not statistically different (p = 0.100, Figure 4). There were no differences in gender or ethnicity among cases and controls (Table 2).
Figure 2. Age categories of cases by gender.
Figure 3. Racial distribution of Controls and Cases.
Figure 4. Distribution of payer status for Controls and Cases.
Primary exposure variable: BMI z-scores
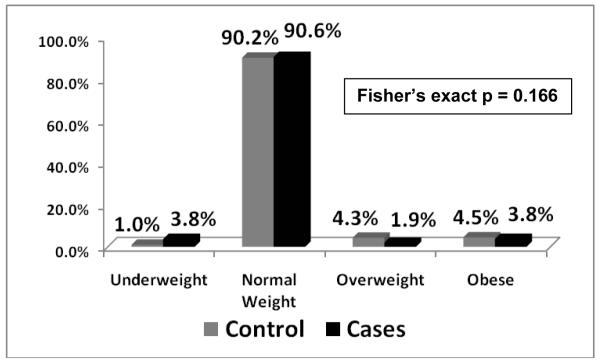
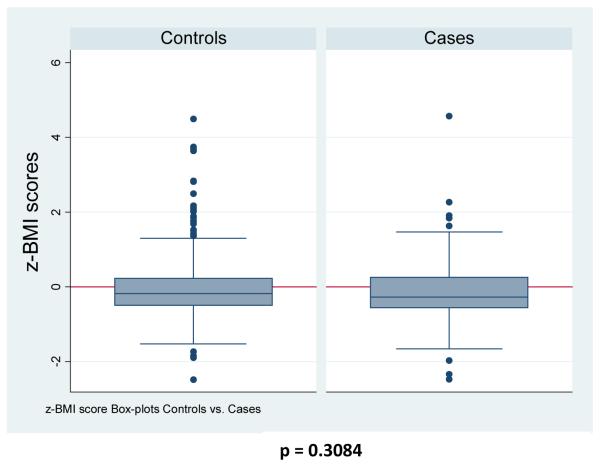
BMI z-scores were available for 108 of 110 cases (98.1%) and for all 396 controls. Among cases, 40 had a BMI within 90 days (36.4%), 28 had a weight within 90 days with an imputable height to calculate BMI (25.4%), 40 cases had sufficient BMI’s outside of 90 days to impute BMI (36.4%), and only 2 cases had insufficient information to reliably impute BMI (1.8%). The overall proportion of subjects who were overweight or obese was 1.9% and 3.7% for cases and 4.3% and 4.5% for controls which was not statistically different (Figure 5, p = 0.166). Median BMI z-score for cases and controls were −0.27805 and −0.12135 and mean BMI z-scores were −0.18398 and −0.03009, respectively (Figure 6). BMI z-scores were not statistically significant for a difference (p = 0.3084). Test for trend for weight categories and case status was not significant (p = 0.177).
Figure 5. Distribution of clinical weight categories for Controls and Cases.
Figure 6. BMI z-score box-plot distributions for Controls and Cases.
Univariable and multivariable conditional logistic regression (CLR)
With univariable CLR, both African-American race (OR=0.31; 95%CI 0.13, 0.73) and Other race (OR=0.36; 95% CI 0.13, 0.99) were associated were a reduced odds of urolithiasis compared with Caucasians. Medicaid payer status (OR=0.46; 95% CI 0.24, 0.89) was also associated with a reduced odds of urolithiasis compared with Commercial insurance. Gender and ethnicity were not statistically significant. Continuous BMI z-score (OR=0.89; 95% CI 0.67, 1.18), overweight category (OR 0.15; 95% CI 0.02, 1.30) and obese category (OR=0.26; 95% CI 0.04, 1.84) were not found to be statistically significant on univariable analysis (Table 1).
TABLE 1. Results.
| Cases (n=110) |
Controls (n=396) |
Univariable(OR) | Multivariable(OR) | |
|---|---|---|---|---|
| Age (yrs)** | ||||
| Mean | 11.394 | 10.644 | -- | -- |
| Median | 12.442 | 12.433 | -- | -- |
| Age Categories**± | ||||
| Infant | 8 (7.3%) | 37 (9.3%) | -- | -- |
| Toddler | 5 (4.6%) | 20 (5.1%) | -- | -- |
| Preschooler | 6 (5.5%) | 17 (4.3%) | -- | -- |
| School Age | 29 (26.4%) | 92 (23.2%) | -- | -- |
| Pre-teen | 5 (4.6%) | 19 (4.8%) | -- | -- |
| Adolescent | 57 (51.8%) | 211 (53.3%) | -- | -- |
| Sex | ||||
| Female | 58 (52.7%) | 208 (52.5%) | reference | -- |
| Male | 52 (47.3%) Chi-sq 0.0014 |
188 (47.5%) p = 0.970 |
0.950 (0.613, 1.472) p = 0.817 |
-- |
| Race | ||||
| White | 84 (76.4%) | 240 (60.6%) | reference | reference |
| Black | 21 (19.1%) | 112 (28.3%) | 0.31 (0.13, 0.73)‡ | 0.35 (0.15, 0.85)‡ |
| Asian | -- | 7 (1.8%) | -- | -- |
| Other | 5 (4.5%) Fisher’s exact |
37 (9.3%) p = 0.016 |
0.36 (0.13, 0.99) p = 0.023 |
0.38 (0.14, 1.05) |
| Ethnicity | ||||
| Non-Hispanic | 106 (96.4%) | 384 (97%) | reference | -- |
| Hispanic | 4 (3.6%) Fisher’s exact |
12 (3%) p = 0.749 |
1.23 (0.39, 3.91) p = 0.726 |
-- |
| Payer Status | ||||
| Commercial | 92 (83.6%) | 292 (73.7%) | reference | reference |
| Medicaid | 17 (15.5%) | 98 (24.8%) | 0.46 (0.24, 0.89)‡ | 0.47 (0.24, 0.94)‡ |
| Self-Pay | 1 (0.9%) Fisher’s exact |
6 (1.5%) p = 0.101 |
0.69 (0.08, 6.37) p = 0.0648 |
1.06 (0.10, 11.25) |
| z-BMI Status† | ||||
| Mean | −0.18398 | −0.03009 | 0.89 (0.67, 1.18) | 0.84 (0.63, 1.12) |
| Median | −0.27805 T-test 1.0197 |
−0.12135 p = 0.3084 |
p = 0.419 | p = 0.242 |
| Underweight | 4 (3.7%) | 4 (1.0%) | reference | reference |
| Normal weight | 98 (90.7%) | 357 (90.2%) | 0.32 (0.06, 1.62) | 0.25 (0.05, 1.39) |
| Overweight | 2 (1.9%) | 17 (4.3%) | 0.15 (0.02, 1.30) | 0.13 (0.01, 1.18) |
| Obese | 4 (3.7%) Fisher’s exact |
18 (4.5%) p = 0.166 |
0.26 (0.04, 1.84) p = 0.3757 |
0.18 (0.02, 1.39) |
match variable
2 cases undefined zBMI
statistically significant
Age Categories: Infant(<1yr), Toddler (≥1 - <3yrs), Preschool (≥3 - <5yrs), School Age(≥5 - <11), Preteen (≥11 - <13yrs), Adolescent (≥13yrs)
Our multivariable CLR model included race, payer status and BMI z-score. African-American race (adjusted OR=0.35; 95% CI 0.15, 0.85) and Medicaid payer status (adjusted OR=0.47; 95% CI 0.24, 0.93) remained statistically significant. Continuous BMI z-score, overweight category, and obese category all remained non-significant (Table 1).
There were no statistically significant interactions between race and payer status (p=0.16), race and weight status (p=0.52), or payer status and weight status (p=0.68).
Additionally, a sensitivity analysis was run without 40 cases who had z-BMI scores imputed from BMI greater than 90 days out. Although this led to a severe reduction in power, no appreciable difference in the general direction or the magnitude of the point estimate was observed. A second sensitivity analysis utilizing only subjects aged less than 18 years yielded no significant change in the results of our multivariable regression model (z-BMI adjusted OR=0.78; 95% CI 0.56, 1.09).
DISCUSSION
Recent evidence suggests that there has been a temporal increase in the overall prevalence of pediatric stone disease within the United States.9 This has been paralleled by a rise in rate of childhood obesity. In conjunction with evidence from adult studies suggesting a causal relationship, these trends have led some to consider whether a similar association exists in children. However, our study did not find a significant association between BMI and stone disease in the pediatric population. Our finding may underscore a critical difference in the causative mechanisms that distinguish pediatric from adult stone disease.
Mounting evidence within the adult literature shows a causal relationship between obesity and kidney stone development. Taylor and colleagues showed a significant increased risk between several measures of increasing body mass and subsequent development of kidney stones in 3 large prospective cohorts.1 A more recent study of a large commercial administrative claims database supported this finding, reporting a statistically significant increased risk for urolithiasis in adults with a BMI greater than 30 kg/m2.2 In explaining the biologic mechanisms promoting stone formation in overweight and obese individuals, the role of body mass on metabolic parameters has been explored. Siener and colleagues showed that increased BMI affected urinary homeostasis by increasing factors which promote stone formation such as decreased urinary pH, increased urinary calcium, and increased urinary uric acid excretion.5 Additional work has implicated hyperinsulinemia as a mediator of obesity’s lithogenic effect on urinary metabolic parameters.12,13 Taylor and Curhan found high BMI to be correlated with decreased urinary pH, increased urinary calcium, oxalate, and uric acid excretion, but with no appreciable difference in urinary supersaturation of calcium oxalate to explain increased stone risk. However, they found an increased level of uric acid supersaturation and concluded that obesity-related stone formation was primarily mediated by uric acid supersaturation.6
Although little is known about the biological mechanisms leading to an increase in pediatric stone disease, initial exploratory studies have assessed the impact and interpretation of urinary metabolic profiles in children who form stones. These studies suggest that urinary metabolic alterations seen in adults may not necessarily be the same causative factors in children. DeFoor characterized the urinary metabolic profiles in a small cohort of normal children and reported significant differences from normal adults. Children were more likely to have normal range urinary calcium, oxalate, citrate, uric acid, and urinary pH than their adult counterparts. Supersaturation levels were significantly lower for uric acid, significantly higher for calcium phosphate, and no different for calcium oxalate.14 A recent study by Eisner examining BMI and urinary metabolic profiles in children with kidney stones, found higher BMI levels were associated with increased urinary pH, increased supersaturation of calcium phosphate, and decreased urinary calcium oxalate level.15 In the largest pediatric case series to date exploring the role of BMI in pediatric stones, Kieran and colleagues found no data to support a direct role of high BMI in the presentation or treatment of kidney stones.21 Our findings add further evidence against a link between BMI and pediatric urolithiasis. These preliminary findings would suggest that the pathophysiology of pediatric stone formation may be distinctly different from the adult population, which would explain our inability to detect an association between obesity and kidney stones.
Our study allowed us to examine other potential factors involved in the epidemiology of pediatric stone disease. Racial and ethnic differences are a known risk for stone disease. Earlier studies have reported a lifetime prevalence of urolithiaisis in African-Americans that is half of their Caucasian counterparts.16,17 Additionally, as the overall prevalence in Caucasians has risen over the past 20 years, stone rates in African-Americans has remained relatively unchanged.4 Our findings that African-American children were at a 65% reduced odds of stone disease confirm these racial differences and speaks largely to underlying genetic variability, but may additionally be a marker for issues regarding access to care. Children who were covered under Medicaid in our study were at a 53% reduced odds of having urolithiasis when compared to children with commercial insurance. Despite a significant association between African-American race and Medicaid payer status, payer status was still independently significant, suggesting issues with access to care.
In further defining the demographics of pediatric stone disease, our study confirms the findings of several recent studies which report a changing gender distribution within both adult and pediatric populations.18,19,20 Our study confirmed an overall shift in gender distribution (47% males, 53% females) previously reported by Novak from a large administrative dataset.18 Gender was not significantly associated with stone disease in our cohort. However, whereas no significant trends are seen with gender across varying age categories within our control group (test for trend, p = 0.939), a statistically significant difference was seen between males and females in their overall age distribution in case subjects (test for trend, p = 0.012). The highest proportion males (42.3%) were seen in school age boys (5 to 11 years), whereas females were predominately (63.8%) adolescents (>13 years). These findings are consistent not only with our own anecdotal evidence from clinical experience, but also with the previous published findings from Novak and colleagues.
Our study has several strengths. First and foremost is the use of an appropriate control group drawn from a large primary care pediatric network, reducing the potential for selection bias. Furthermore, incidence-density sampling was used to randomly select controls with similar “time-at-risk”as cases. Information bias related to outcome (stone disease) and exposure (z-BMI scores) were potential threats to our validity, thus chart abstraction was employed to mitigate potential misclassification. Our main limitation was limited height data in calculating z-BMI scores for an index date. Within-subject imputation was used to calculate z-BMI scores, using heights within 90-days to calculate z-BMI scores. Available heights were used to generate a linear regression to predict height on the index date. A sensitivity analysis excluding cases lacking both heights and weights within 90 days did not show any appreciable changes in direction or magnitude of effect. Other limitations include potentially important unmeasured confounders, such as dietary intake and hereditary traits, which likely play a prominent role in pediatric urolithiasis. Lastly, our findings may only be generalizable to populations with a similar composition to that of our primary care practice network.
CONCLUSIONS
Body mass index was not associated with urolithiasis in children in our study sample. African-American race and Medicaid payer status were associated with reduced odds of pediatric urolithiasis. More prospective research is needed to better understand the determinants of urolithiasis in children.
Acknowledgements
The authors would like to acknowledge Dr. Robert Grundmeier, Jonathan Crossette, and Jason Ramos from the Children’s Hospital of Philadelphia Clinical Reporting Unit (CRU) of the Center for BioMedical Informatics (CBMI) and the Pediatric Research Consortium (PeRC) for their assistance with data acquisition, Katie Tremont for her assistance with data collection, and Dr. Harold Feldman for his mentorship
Funding Source: Dr. Kim was supported by grant T32-DK007785 from the National Institute of Diabetes and Digestive and Kidney Diseases. Principal investigator: Harold I. Feldman, MD, MSCE
Footnotes
Supplementary material:
http://www.chla.org/site/c.ipINKTOAJsG/b.6544949/k.BE5E/Journal_of_Urology.htm
REFERENCES
- 1.Taylor EN, Stampfer MJ, Curhan GC. Obesity, weight gain, and the risk of kidney stones. JAMA. 2005;293(4):455–462. doi: 10.1001/jama.293.4.455. [DOI] [PubMed] [Google Scholar]
- 2.Semins MJ, Shore AD, Makary MA, et al. The association of increasing body mass index and kidney stone disease. J Urol. 2010;183:571–575. doi: 10.1016/j.juro.2009.09.085. [DOI] [PMC free article] [PubMed] [Google Scholar]
- 3. http://www.cdc.gov/chronicdisease/resources/publications/AAG/obesity.htm accessed 5/25/2010.
- 4.Stamatelou KK, Francis ME, Jones CA, et al. Time trends in reported prevalence of kidney stones in the United States: 1976-1994. Kidney Intl. 2003;63:1817–1823. doi: 10.1046/j.1523-1755.2003.00917.x. [DOI] [PubMed] [Google Scholar]
- 5.Siener R, Glatz S, Nicolay C, et al. The role of overweight and obesity in calcium oxalate stone formation. Obesity Res. 2004;12(1):106–113. doi: 10.1038/oby.2004.14. [DOI] [PubMed] [Google Scholar]
- 6.Taylor EN, Curhan GC. Body size and 24-hour urine composition. Am J Kid Disease. 2006;48(6):905–915. doi: 10.1053/j.ajkd.2006.09.004. [DOI] [PubMed] [Google Scholar]
- 7.Ogden CL, Carroll MD, Curtin LR, et al. Prevalence of high body mass index in US children and adolescents, 2007-2008. JAMA. 2010;303(3):242–249. doi: 10.1001/jama.2009.2012. [DOI] [PubMed] [Google Scholar]
- 8.VanDervoort K, Wiesen J, Frank R, et al. Urolithiasis in pediatric patients: a single center study of incidence, clinical presentation and outcome. J Urol. 2007;177(6):2300–2305. doi: 10.1016/j.juro.2007.02.002. [DOI] [PubMed] [Google Scholar]
- 9.Bush NC, Xu L, Brown BJ, et al. Hospitalizations for pediatric stone disease in United States, 2002-2007. J Urol. 2010;183:1151–1156. doi: 10.1016/j.juro.2009.11.057. [DOI] [PubMed] [Google Scholar]
- 10.Sarica K, Eryildirimm B, Yencilek F, et al. Role of overweight status on stone-forming risk factors in children: a prospective study. Urology. 2009;73:1003–1007. doi: 10.1016/j.urology.2008.11.038. [DOI] [PubMed] [Google Scholar]
- 11.Barlow SE, the Expert Committee Expert committee recommendations regarding the prevention, assessment, and treatment of child and adolescent overweight and obesity: summary. Pediatrics. 2007;120(S4):164–192. doi: 10.1542/peds.2007-2329C. [DOI] [PubMed] [Google Scholar]
- 12.Asplin JR. Obesity and urolithiasis. Adv Chronic Kidney Dis. 2009;16(1):11–20. doi: 10.1053/j.ackd.2008.10.003. [DOI] [PubMed] [Google Scholar]
- 13.Sakhaee K, Maalouf NM. Metabolic syndrome and uric acid nephrolithiasis. Semin Nephrol. 2008;28:174–180. doi: 10.1016/j.semnephrol.2008.01.010. [DOI] [PubMed] [Google Scholar]
- 14.DeFoor W, Asplin J, Jackson E, et al. Results of a prospective trial to compare normal urine supersaturation in children and adults. J Urol. 2005;174:1708–1710. doi: 10.1097/01.ju.0000175998.64711.45. [DOI] [PubMed] [Google Scholar]
- 15.Eisner BH, Eisenberg ML, Stoller ML. Influence of body mass index on quantitative 24-hour urine chemistry studies in children with nephrolithiasis. J Urol. 2009;182:1142–1146. doi: 10.1016/j.juro.2009.05.052. [DOI] [PubMed] [Google Scholar]
- 16.Sarmina I, Sprinak JP, Resnick MI. Urinary lithiasis in the black population: an epidemiological study and review of the literature. J Urol. 1987;138(1):14–17. doi: 10.1016/s0022-5347(17)42971-5. [DOI] [PubMed] [Google Scholar]
- 17.Soucie JM, Thun MJ, Coates RJ, et al. Demographic and geographic variability of kidney stones in the United States. Intl Soc Nephrol. 1994;46(3):893–899. doi: 10.1038/ki.1994.347. [DOI] [PubMed] [Google Scholar]
- 18.Novak TE, Lakshmanan Y, Trock BJ, et al. Sex prevalence of pediatric kidney stone disease in the United States: an epidemiologic investigation. Urology. 2009;74:104–108. doi: 10.1016/j.urology.2008.12.079. [DOI] [PubMed] [Google Scholar]
- 19.Strope SA, Wolf JS, Hollenbeck BK. Changes in gender distribution of urinary stone disease. Urology. 2010;75:543–546. doi: 10.1016/j.urology.2009.08.007. [DOI] [PMC free article] [PubMed] [Google Scholar]
- 20.Scales CD, Curtis LH, Norris RD, et al. Changing gender prevalence of stone disease. J Urol. 2007;177:979–982. doi: 10.1016/j.juro.2006.10.069. [DOI] [PubMed] [Google Scholar]
- 21.Kieran K, Giel DW, Morris BJ, et al. Pediatric Urolithiasis – Does Body Mass Index Influence Stone Presentation and Treatment? J Urol. 2010;184:1810–1815. doi: 10.1016/j.juro.2010.03.111. [DOI] [PubMed] [Google Scholar]


