

Genome-wide association studies (GWAS) from the last several years have provided the first unbiased evidence of the genes contributing to common cardiovascular disease traits in European and some Asian populations. The results confirmed the importance of prior knowledge, such as the central role of lipoproteins, but they also revealed that there is still much to learn about the underlying mechanisms of this disease, as most of the associated genes do not appear to be involved in pathways previously connected to atherosclerosis. This review focuses on the common forms of the disease and looks at both human and animal model studies. It summarizes what was known prior to GWAS, highlights how the field has been changed by GWAS, and discusses future considerations, such as the limitations of GWAS and strategies that may lead to a more complete, mechanistic understanding of atherosclerosis.
Genetics and Atherosclerosis
Atherosclerosis is a progressive inflammatory disorder underlying coronary artery disease (CAD) and stroke, major causes of mortality and morbidity worldwide. Figure 1 provides a brief overview of the pathology of atherosclerosis. For a detailed description of the biology of the disease, several recent reviews are available1-3. Most of our understanding of the factors contributing to atherosclerosis has come from epidemiologic studies and from studies of Mendelian forms of the disease, such as familial hypercholesterolemia. These have revealed important roles for plasma lipoprotein, blood pressure, diabetes, and other risk factors. The elaboration of pathways and mechanisms involved in the disease has relied largely on animal models, particularly genetically engineered hypercholesterolemic mice 4, 5. The vast majority of CAD and stroke is complex, involving multiple genetic and environmental factors which, until recently, have largely resisted genetic dissection. Clearly, a detailed mechanistic understanding of the genetic factors contributing to common forms would have important implications for prevention and treatment of atherosclerosis 6.
Figure 1. Stages of coronary artery disease.

Large arteries are bounded on the luminal side by a monolayer of endothelial cells that form tight junctions, insulating the vessel wall from the blood. Underlying that is a region termed the intima, that consists largely of proteoglycans and collagen. This is followed by layers of smooth muscle cells, and then an outer region, the adventitia, consisting of fibrous elements and fibroblasts. The first stages of atherosclerosis are characterized by the accumulation of lipoproteins, particularly low density lipoproteins (LDL), in the intimal region. In response to the lipoprotein accumulation, monocytes, and subsequently, lymphocytes, infiltrate the vessel wall. The monocytes differentiate to macrophages which then take up the lipoproteins to give rise to cholesterol-engorged “foam cells”, a hallmark of early atherogenesis. Some of these foam cells eventually die, resulting in a necrotic core of cholesterol and cellular debris. This is accompanied by the migration and proliferation of smooth muscle cells, which form a fibrous cap that overlies the necrotic core. The most common cause of a myocardial infarction (MI) is the rupture of an atherosclerotic lesion, exposing tissue factor and leading to the formation of a thrombus that blocks the flow of blood. In general, a thick fibrous cap appears to protect against such rupture (from 7)
This review is divided into three sections. The first summarizes efforts to understand the genetics of common forms of atherosclerosis and its risk factors prior to the era of GWAS, before about 2007. In the next section, the results from recent GWAS are described and placed in the context of what was previously known. Lastly, the third section discusses efforts to go beyond association to an understanding of pathways and interactions. At present, the outlook is promising, as the field appears to be poised to identify new genes and new therapeutic targets for atherosclerosis.
Before GWAS
Measures of atherosclerosis, such as myocardial infarction, carotid intima-media thickness, or coronary angiography, have very significant genetic components, as do risk factors such as plasma lipid levels or blood pressure. Estimates of the heritability of the measures of disease, based on familial clustering or twin studies, have varied widely but generally range from 30-60% 4, 7, 8.
Prior to the GWAS era, efforts to identify genes contributing to atherosclerosis and other complex diseases were largely restricted to studies of candidate genes or to analysis of variations in experimental models, particularly mice and rats. Of the many case-control candidate gene studies for CAD that were published, most were greatly underpowered and few were convincingly replicated 9. An exception is the ABO locus, which was first observed to be associated with CAD and thrombosis approximately 50 years ago 10. By contrast, candidate gene studies for less complex and more accurately measured traits, such as plasma lipoproteins, were relatively successful 11, 12. Particularly notable among the latter were the identification the apolipoprotein(a) gene in the control of Lp(a) levels, the apolipoprotein E gene in the control of plasma cholesterol and triglyceride levels, and the apolipoprotein A5 gene in the control of triglyceride levels 11. A large nonparametric (model-free) linkage study for common atherosclerosis in the Icelandic population identified the gene for the lipoxygenase-associated protein 13, which was consistent with other studies implicating the lipoxygenase pathway in atherosclerosis 14. Another linkage study, of the familial combined hyperlipidemia trait, which is strongly associated with atherosclerosis, identified the USF1 transcription factor gene 15. However, neither of these loci were observed in subsequent very large lipid or atherosclerosis GWAS (see below). It is possible that multiple, relatively rare alleles of these genes were responsible for the linkage findings, in which case the loci might not exhibit significant associations with the common single nucleotide polymorphisms (SNPs) studied in GWAS.
Inbred strains of mice exhibit significant differences in susceptibility to atherosclerosis and lipoprotein metabolism, and linkage analyses of genetic crosses led to the robust mapping of numerous quantitative trait loci (QTL) for atherosclerosis 16 (Table 1). The loci thus identified tend to be large, often containing hundreds of genes, and they generally have very modest effect sizes, usually explaining less than 5% of the overall variance in atherosclerosis. Consequently, these studies (like QTL studies of most other complex traits) have yielded few genes 16, 17. The most productive strategy to follow up QTL mapping has been the construction of congenic strains of mice in which the QTL region of interest from one parental strain is transferred, by a series of crosses, onto the background of the second strain. The congenic region can then be subdivided without interference from separate loci contributing to the trait. Such approaches have provided evidence for several genes contributing to atherosclerosis, including apolipoprotein A-II 18, Ox40 ligand 19, and 5-lipoxygenase 20. One gene identified in this way, zinc finger homeoboxes-2 (ZHX2) 21, 22, was recently shown to be the most strongly associated gene with carotid-intima-media thickness, a surrogate marker for atherosclerosis (see below).
Table 1.
Quantitative trait loci for atherosclerosis in mice.*
| Chromosome(Mb) | Cross | Lod | Reference |
|---|---|---|---|
| 1(76) | (C57BL/6J Apoe-/- x C3H/HeJ Apoe-/-)F2 | 6.5 | 63 |
| 1(82) | B x H and C x B RI lines | — — | 64, 65 |
| 1(105) | (12956/SuEuJac Apoe-/- x C57BL/6J Apoe-/- )F2 |
5.0 | 44 |
| 1(160) | (C57BL/6J Apoe-/- x C3H/HeJ Apoe-/-)F2 | 7.1 | 63 |
| 1(163) | (12956/SuEuJac Apoe-/- x C57BL/6J Apoe-/- )F2 |
6.8 | 44 |
| 2(38) | (C57BL/6J Ldlr-/- x BALB/cByJ Ldlr-/-)F2 | 6.2 | 66 |
| 4(149) | (MOLF x C57BL/6J-Ldlr-/-) x B6-Ldlr-/- | 6.2 | 67 |
| 4(150) | (C57BL/6J Apoe-/- x C3H/HeJ Apoe-/-)F2 | 5.0 | 63 |
| 6(127) | (CAST x C57BL/6J)F2 | 6.7 | 68 |
| 6(136) | (MOLF x C57BL/6J-Ldlr-/-) x C57BL/6J- Ldlr-/- |
6.7 | 67 |
| 7(62) | (C57BL/6J Apoe-/- x C3H/HeJ Apoe-/-)F2 | 6.6 | 63 |
| 9(46) | (C57BL/6J Apoe-/- x C3H/HeJ Apoe-/-)F2 | 5.0 | 63 |
| 9(61) | 12956/SuEuJac Apoe-/- x C57BL/6J Apoe-/-)F2 | 6.9 | 44 |
| 9(84) | (C57BL/6J Apoe-/- x C3H/HeJ Apoe-/-)F2 | 8.1 | 63 |
| 10(20) | (C57BL/6J.129-Apoe-/- x FVB.129-Apoe-/-)F2 | 5.1 | 69 |
| 10(21) | (C57BL/6J.129-Ldlr-/- x FVB.129-Ldlr-/- )RpF2 |
13.1 | 70 |
| 10(55) | (C57BL/6J x DBA/2)F2 | 4.5 | 71 |
| 10(67) | (C57BL/6J x 129)F2 | 6.6 | 72 |
| 11(104) | (C57BL/6J Apoe-/- x C3H/HeJ Apoe-/-)F2 | 7.8 | 63 |
| 12(55) | (B6 Ldlr-/- x FVB Ldlr-/-)RpF2 | 4.8 | 70 |
| 13(90) | (C57BL/6J Apoe-/- x C3H/HeJ Apoe-/-)F2 | 7.0 | 63 |
| 15(71) | (C57BL/6J Apoe-/- x C3H/HeJ Apoe-/-)F2 | 6.2 | 63 |
| 15(96) | (129S6/SuEuJac Apoe-/- x C57BL/6J Apoe-/- )F2 |
4.7 | 44 |
| 17(26) | (C57BL/6J Apoe-/- x C3H/HeJ Apoe-/-)F2 | 4.3 | 63 |
| 17(36) | (AKR Apoe-/- x DBA/2 Apoe-/-)RpF2 | 4.3 | 73 |
Unless otherwise indicated, the data are taken from 16. The location of the QTL peak on a chromosome is given in megabases (Mb). RI, recombinant inbred; F2, intercross; “RpF2”, reciprocal F2 cross. Only QTL with lod score values that are significant genome-wide are included. A lod score is a statistical measure of the significance of linkage. It is the log base10 of the “odds ratio” which is the probability of the data given a linkage model divided by the probability of the data given the null hypothesis of no linkage.
In summary, prior to the GWAS era, before 2007, our understanding of the genetics of atherosclerosis was based mostly on studies of candidate genes or rare, Mendelian traits. At the time, the tremendous genetic complexity of atherosclerosis was not fully appreciated, and most human studies were underpowered. Studies in mice were only modestly successful in identifying genes, although they did lead to the mapping of many loci and a demonstration of considerable genetic complexity.
GWAS
The Human Genome Project, the HapMap Project, and subsequent genomic studies led to the identification of many of the common SNPs in the world’s populations. The millions of SNPs with minor allele frequencies of about 5% or greater fell into blocks exhibiting strong linkage disequilibrium (LD) (that is, associations with one another) 23. With the development of array technologies capable of simultaneously genotyping hundreds of thousands of SNPs, it became possible to perform GWAS for common, complex traits, including CAD and its risk factors (Table 2). Recently, various groups involved in such studies have formed collaborations to perform meta-analyses on tens of thousands of subjects 24, 25.
Table 2.
GWAS of CAD and risk factors
| Trait | Population | Number of subjects |
Reference |
|---|---|---|---|
| Early onset MI | European | 19,492 | 33 |
| CAD and MI | European | 12,393 | 39 |
| CAD | European, African American |
>23,000 | 34 |
| CAD | Icelandic | >17,000 | 31 |
| CAD | European | >7,300 | 35 |
| CAD | European | >27,000 | 30 |
| CAD | European, South Asian |
>50,000 | 26 |
| CAD | Chinese Han | >6,000 | 27 |
| CAD | European | >100,000 | 25 |
| Blood lipids | European | >100,000 | 12 |
| Blood pressure | European, others | >200,000 | 57 |
The largest GWAS for CAD, the CARDIoGRAM study, included over 100,000 subjects of European descent 25 (Figure 2), and smaller CAD studies of Asian populations have also been reported 26, 27. Altogether about 30 loci reaching statistical significance were identified, with only slight evidence of ancestry-specific associations. All the loci exhibited modest effect sizes, as the increased likelihood of developing the disease for individuals carrying the risk allele as compared to those carrying the other allele (the “odds ratio”) was generally less than 1.3. A number of the loci included well-known lipid genes such as LDLR and PCSK9, supporting the importance of low density lipoprotines (LDL) in atherosclerosis. A few others, such as CYPA1, CNNM2, and NT5C2, showed evidence of association with hypertension, but most of the loci had no effects on known risk factors and were not involved in pathways previously connected to atherosclerosis. This suggests that we are in the dark about much of what contributes to the disease. It is also interesting that loci with prominent effects on levels of high density lipoproteins (HDL), such as the CETP gene locus 11, 12, did not exhibit significant association with atherosclerosis. Given the clear protective effect of HDL in animal studies 11, 18, it seems likely that this reflects a lack of power. The genes at most of the GWAS loci (Figure 2) are presently simply candidates (see below) and, thus, we will not speculate here about their possible roles in atherosclerosis except in the case of the few genes where there has been follow-up or additional information.
Figure 2. GWAS of CAD in >100,000 Europeans.
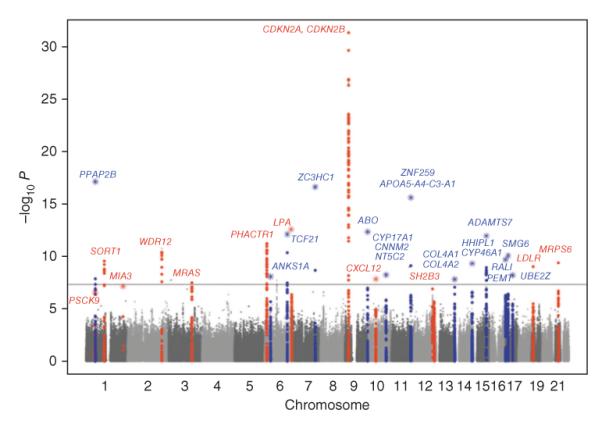
The Y axis shows the significance of the SNP association with CAD (as the negative of the log10 or the P value), while the X axis shows the location of the SNP across the genome, with Chromosomes shown in alternate colors. The most likely candidate genes at the identified loci are indicated using gene symbols and the floating horizontal line represents genome-wide significance using a Bonferroni adjustment. The names of the genes, in alphabetical order, are as follows: ABO, ABO blood group (transferase A, alpha 1-3-N-acetylgalactosaminyl-transferase B, alpha 1-3-galactosyltransferace); ADAMTS7, ADAM metallopeptidase with thrombospondin type motif 1; ANKS1A, (ankyrin repeat and sterile alpha motif domain containing A1; APOA5-A4-C3-A1, Apolipoprotein A5, A4, C3, A1 gene cluster; CDKN2A, cyclin-dependent kinase inhibitor 2A; CDKN2B, cyclin-dependent kinase inhibitor 2B; COL4A1, collagen, type IV, alpha 1; COL4A2, collagen, type IV, alpha 2; CNNM2, cyclin M2; CXCL12, chemokine (C-X-C motif) ligand 12; CYP17A1, cytochrome P450, family 17, subfamily A, polypeptide 1; CYP46A1, cytochrome P450, family 46, subfamily A, polypeptide 1; HHIPL1, hedgehog interacting protein-like 1; LDLR, low density lipoprotein receptor; LPA, lipoprotein, Lp(a); MIA3, melanoma inhibitory activity family, member 3; MRAS, muscle RAS oncogene homolog; MRPS6, mitochondrial ribosomal protein S6; NT5C2, 5′-nucleotidase, cytosolic II; PCSK9, proprotein convertase subtilisin/kexin type 9; PEMT, phosphatidylethanolamine N-methyltransferase; PHACTR1, phosphatase and actin regulator 1; PPAP2B, phosphatidic acid phosphatase type 2B; RASD1, RAS, dexamethasone-induced 1; SH2B3, SH2B adaptor protein 3; SMG6, smg-6 homolog, nonsense mediated mRNA decay factor, SORT1, sortilin 1; TCF21, transcription factor 21; UBE2Z, ubiquitin-conjugating enzyme E2Z; WDR12, WD repeat domain 12; ZC3HC1, zinc finger, C3HC-type containing 1; ZNF259, zinc finger protein 259. (Reprinted from 25 with permission)
Because of LD, it has proven difficult to definitively identify the causal genes at such loci and, in some cases, it is clear that the SNP showing peak association resides many kilobases away from the causal gene. One locus with a strong effect on both CAD and lipids contained 3 genes in LD (SELSR2, PSRC1 andSORT1), none of which were previously known to participate in lipid metabolism. Mechanistic studies in tissue culture and mice identified SORT1 as causal and implicated it in the production of VLDL 28. In this and other studies (see below), analysis of gene expression in tissues has provided evidence for the involvement of a gene in atherosclerosis
In such CAD GWAS, a locus on chromosome 9p21 has proven to be most strongly associated with CAD 29-35. The locus also shows association with aneurysms but does not affect plasma lipid levels 36. The LD block includes only a large noncoding RNA termed ANRIL, and the expression of certain ANRIL splice forms in blood monocytes is associated with the peak SNPs 32. The ANRIL transcript overlaps with some adjacent genes, including some that regulate cell cycle, suggesting that variations in ANRIL expression may affect these genes in cis 32. A mouse QTL for atherosclerosis exhibited altered expression of one of these genes, Cdkn2a, and mice deficient in Cdkn2a exhibited increased atherosclerosis as well as increased monocyte proliferation 37. The region of association is highly enriched for predicted enhancers and two of the peak SNPs disrupt interferon signaling by preventing the binding of the STAT1 transcription factor, suggesting an inflammatory mechanism 38. Thus, although some tantalizing clues have been uncovered, the mechanism by which the 9p21 locus modulates cardiovascular risk remains unclear.
Genetic-epidemiologic studies have shown that the heritability of CAD tends to decrease with the age of the population being studied and, thus, early myocardial infarction should be a particularly informative and clinically significant phenotype. A study of 2967 cases and 3075 controls consisting of men less than 50 years old and women less than 60 years old revealed some of the same loci as observed in the larger CAD studies but no novel loci 33. In addition to SNPs, that study examined copy number variants but failed to identify any additional associations. Thus, whereas copy number variants appear to be very important in certain disorders, such as autism, this is likely not the case for atherosclerosis.
Another study used coronary angiographic phenotyping to perform case/control GWAS 39. A total of 12,393 individuals with angiographic CAD were compared with 7383 healthy individuals. None of the loci identified were novel as compared to the large CAD GWAS discussed above. In the second part of the study, the authors tested whether genetic factors contributed distinctly to the development of coronary atherosclerosis as compared to myocardial infarction (MI). While the most common cause of MI is plaque rupture, MI is not well correlated with the extent of lesions 1. This is likely due to the fact that lesion rupture is more a function of the quality of lesions (fatty versus fibrous) rather than their size (Figure 1). A group of subjects from the first group that had a MI (n=5783) was compared with a group with no MI (n=3644). This analysis suggested that the ABO locus specifically contributes to MI, contrasting with other loci, such as ADAMTS7 and 9p21, which appear to impact primarily lesion development. Consistent with these findings, a previous study showed that the “A” and “B” phenotypes (as compared to “O”) were associated with thromboembolism and MI but not angina 40. The ABO gene encodes glycosyl transferases, with the recessive O allele lacking activity. The O allele was associated in a GWAS with reduced circulating von Willebrand Factor and Factor VIII coagulation factors 39, suggesting that the association of this locus with CAD reflects at least a partial role for the modulation of thrombosis in atherosclerosis.
Carotid-intima media thickness (cIMT) and carotid plaque determined by ultrasonography are established measures of subclinical atherosclerosis. A recent meta-analysis of association data in over 40,000 Europeans identified three loci for cIMT and two loci for carotid plaque41. Only one of the nearby genes, EDNRA, encoding the endothelian receptor type A, also showed association with CAD, as well as with high blood pressure. One of the novel genes exhibiting association with cIMT is ZHX2. Studies in mice with a naturally occurring null mutation exhibited a striking effect on aortic atherosclerosis 21, 22. The lack of overlap between these measures of cIMT and CAD is surprising, suggesting specificity of artery type or stage of disease 42. Studies in mice have revealed clear differences in genetic contributions to lesion development between different arteries 43, and one study suggested that aortic arch curvature contributes to susceptibility 44.
In all of these studies, the fraction of total phenotypic variance explained by the associated SNPs was relatively small. The lead SNPs in the CARDioGRAM study, with over 100,000 Europeans, explained in aggregate about 10% of the additive genetic variance of CAD, assuming the latter is 40% of the total. Even for the highly quantitative traits of plasma lipoprotein levels, for which 95 significant loci have been identified, the fraction of variance explained was small 12. The nature of the “missing heritability” for CAD and other common diseases is unclear. Undoubtedly, it is due in part to many genes with effect sizes too small to reach statistical significance in a GWAS design. Rare variants, some with large effect sizes, will also certainly contribute 45. Analysis of rare variants using exome sequencing, new SNP chips with less common variants, and SNP chips designed to examine candidate genes is underway. Finally, a recent study 46 pointed out that heritability estimates assume an additive mode of inheritance, and if epistasis (i.e., a nonadditive interaction between genes) is prevalent, as animal studies suggest 47, the estimates may be considerably inflated. Thus, there may be much less “missing heritability” (that is, the additive fraction), than widely assumed. Filling in the remainder (the nonadditive fraction) will be difficult in human studies due to low power.
CAD typically affects men at an earlier age than women, and a recent study explored the possible role of Y chromosome variation in this sexual dimorphism 48. The authors studied various haplogroups of the Y chromosome in several thousand British men and observed that one of the common haplogroups exhibited a 50% higher age-adjusted risk of CAD than did men with other Y chromosome lineages (odds ratio 1.56, p = 0.0002). The association between the haplogroup and increased CAD was independent of traditional and socioeconomic risk factors. Analysis of macrophage transcriptomic data in a subset of the men revealed differential gene expression in men with the risk haplogroup as compared to other Y chromosome lineages. These genes were highly enriched for pathways contributing to inflammation and immunity, suggesting a potential mechanism for the association.
Current Studies and Future Prospects
The major goals of genetic studies of cardiovascular disorders are to develop improved preventative measures and more effective treatments. These will best be accomplished through an understanding of the detailed mechanisms underlying the traits. An important lesson of genetic studies thus far is that there is a great deal that we do not know about the fundamental processes involved in CAD. For example, the genes at loci identified in the very large CARDioGRAM CAD study (Figure 2) are mostly novel, with no known connection to atherosclerosis. Clearly, some important on-going and future tasks are to: i) identify the causal genes and DNA variants at the GWAS loci; ii) characterize the functions of the causal genes; iii) extend the search to rare variants. Beyond that are a number of specific questions that may be addressed by genetic studies (Box 1).
Box 1. Outstanding questions.
-What pathways contribute to the initiation and propagation of inflammation in atherosclerosis?
-What are the genetic factors contributing to plaque stability?
-How important are rare mutations with large effect size in common forms of atherosclerosis?
-How important is epistasis in disease susceptibility?
-How can current knowledge of atherosclerosis be translated into prevention and treatment?
-How well do animal studies model human disease?
-How important is maternal environment and epigenetics in atherosclerosis?
-How do diabetes and environmental factors such as air pollution contribute to atherosclerosis?
-How does trimethylamine-N-oxide promote CAD?
-How do gut flora contribute to atherosclerosis?
-What is the basis of sex differences in atherosclerosis?
GWAS identify genes out of context, and to establish their functions in disease is likely to be very challenging. For example, common variants of APOE were shown to be related to late-onset Alzheimer’s disease nearly 20 years ago, but the mechanisms involved remain hypothetical. Clearly, the genes can be studied in mice using transgenic or knockout models, but whether this will provide meaningful answers is uncertain. The common variants identified thus far are likely to influence the structures or expression levels of the gene products very modestly, and the effects may well be nonlinear or dependent on interactions with other variants. A case in point is the contrasting results obtained with over- or under-expression of the SORT1 gene in mice 28, 49. Moreover, it is not clear that certain processes, such as lesion rupture, can be adequately recapitulated in models such as mice or rats.
An alternative approach to understanding mechanisms in complex traits is “systems genetics”. In this approach, intermediate molecular phenotypes and clinical phenotypes are analyzed together in association or linkage studies 50-52. Through the use of high-throughput technologies such as expression arrays, deep sequencing of RNA, or liquid chromatography/mass spectrometry analysis of proteins and metabolites, the relationships of DNA variation, molecular processes, and clinical traits can be integrated using mapping, correlation, and mathematical modeling. In essence, systems genetics provides a means of determining the molecular biological effects downstream of a genetic variant as well as interactions with other variants and with environmental factors.
Systems genetics requires that relevant tissue samples be collected from subjects along with DNA, and this presents a problem in human studies. White cells from the blood have proven useful for examining certain traits, such as the effects of 9p21 alleles and Y chromosome haplogroups on gene expression, as discussed above. Another case in point is LIPA, the lysosomal acid lipase gene, whose risk allele is strongly associated with increased expression levels of LIPA mRNA in circulating monocytes 53. Biopsies or autopsy samples of liver or adipose tissue have also been used to examine the effects of SNPs on the expression of genes at candidate loci 28.
In addition to the study of single genes, intermediate phenotypes can be used to model biologic networks 42, 54. A recent study 51 examined the effects of oxidized phospholipids on human endothelial cell (EC) expression patterns in 162 primary cell lines to model networks and pathways likely to be important in the initiation of inflammation in atherosclerosis (Figure 3). This study revealed widespread occurrence of gene-by-environment interactions and it generated hundreds of hypotheses. Such network models are crude in several respects (for example, they assume that co-expression is a good measure of shared functions), but they can be refined by targeted experimental perturbations. The long-term goal is to develop multi-scale network models that integrate orthogonal datasets (such as transcriptomic, proteomic, and metabolomic).
Figure 3. Systems genetics analysis of human endothelial inflammatory response to oxidized phospholipids.


Atherosclerosis is initiated by the accumulation of lipoproteins in the vessel wall. The phospholipids and cholesterol can undergo oxidative modification to produce a variety of molecular species, some of which have potent pro-inflammatory activities. In this study, model oxidized phospholipids were used to treat 162 primary human aortic endothelial cell lines, and global transcript levels were determined for treated and control cultures using expression arrays. About 2,000 genes whose expression levels were perturbed by the treatment were used to model a co-expression network using the WGCNA algorithm. A total of 11 subnetwork “modules” of highly connected genes were identified (Panel A) and most were found to be highly enriched for certain known pathways such as cell cycle (shaded green) and the unfolded protein response (shaded purple). Examination of the connections of genes within the modules identified novel pro-inflammatory pathways and regulatory interactions. Shown in Panel (B) is a representation of the purple module (indicated by an arrow) enriched for unfolded protein response genes, with darker colored modules indicating hub nodes, and the length of the edges inversely related to the co-variation. Reprinted from 51, with permission.
Blood metabolites are are proving to be another informative intermediate phenotype with respect to CAD 55. Particularly striking was the finding that the metabolite trimethylamine-N-oxide (TMAO) is strongly associated with atherosclerosis in human populations as well as inbred strains of mice 56. TMAO appears to promote the formation of foam cells (macrophages engorged with cholesterol) 56. TMAO is produced by the enzymatic oxidation of trimethylamine 57, a gas produced in the intestine by the action of gut bacteria during the breakdown of choline. TMAO levels are determined by diet, variations in expression of flavin monooxygenases (enzymes that convert TMA to TMAO) and, very likely, variations in the composition of gut flora 58.
As discussed above, QTL studies of cardiovascular traits in mice have been only modestly successful, largely due to the difficulty of identifying causal genes following the mapping of loci. Nevertheless, it is clear that there is a great deal of variation among inbred strains that is relevant to CAD and related traits (Table 1). Of the QTL for aortic atherosclerosis that have been robustly mapped in mice (Table 1), most do not harbor genes identified in human GWAS. Thus, if the underlying genes could be identified, it would greatly add to our understanding of the pathways involved in lesion development. In addition to atherosclerosis, a variety of clinically relevant cardiovascular traits, such as aneurysms, intima formation, and vascular calcification have been mapped in mice 59.
Recently, methods for high resolution mapping of complex trait loci in mice using association analysis of outbred stocks or inbred strains (as contrasted to linkage) have been developed 60. In particular, a panel of about 100 common inbred stains and recombinant inbred strains, the Hybrid Mouse Diversity Panel (HMDP), was shown to have sufficient power to map loci explaining as little as a few percent of the overall trait variance with about an order of magnitude better resolution than linkage analysis 58, 61. Moreover, because the strains are permanent, data generated from the HDMP are cumulative, and gene-by-environment interactions can be analyzed, ideal for a systems genetics resource. Other resources, such as the Collaborative Cross 62 also promise to revitalize the use of mice in the analysis of complex traits.
Concluding Remarks
GWAS of large human populations have identified numerous novel genes/loci for atherosclerosis and related traits. Individually, these loci have very modest effects on disease, with typical odds ratios of 1.3 or less, limiting their predictive value. Despite the modest effect sizes, the genes have the potential to reveal new disease pathways and new targets for therapeutic intervention. However, human GWAS have some important limitations. First, they have low power to identify gene-by-gene environment interactions 46. Second, in aggregate, even very large GWAS have explained only a small fraction of the estimated heritability (although, as discussed above, the additive component of heritability may be inflated). Third, it is difficult in humans to follow up association results to identify the pathways and mechanisms contributing to disease. Animal studies and systems-based approaches are likely to be crucial in overcoming these limitations.
Acknowledgments
My laboratory received support from PO1 HL305685, PO1 HL28481, 1R01 GM0956561, R21 HL110667-01, RO1 HL0943221, and DP3 D094311. Thanks to my colleagues for discussions of this topic and to Ms. Rosa Chen for the preparation of this manuscript.
Footnotes
Publisher's Disclaimer: This is a PDF file of an unedited manuscript that has been accepted for publication. As a service to our customers we are providing this early version of the manuscript. The manuscript will undergo copyediting, typesetting, and review of the resulting proof before it is published in its final citable form. Please note that during the production process errors may be discovered which could affect the content, and all legal disclaimers that apply to the journal pertain.
References
- 1.Hansson GK. Inflammation, atherosclerosis, and coronary artery disease. N Engl J Med. 2005;352:1685–1695. doi: 10.1056/NEJMra043430. [DOI] [PubMed] [Google Scholar]
- 2.Libby P, et al. Progress and challenges in translating the biology of atherosclerosis. Nature. 2011;473:317–325. doi: 10.1038/nature10146. [DOI] [PubMed] [Google Scholar]
- 3.Moore KJ, Tabas I. Macrophages in the pathogenesis of atherosclerosis. Cell. 2011;145:341–355. doi: 10.1016/j.cell.2011.04.005. [DOI] [PMC free article] [PubMed] [Google Scholar]
- 4.Lusis AJ. Atherosclerosis. Nature. 2000;407:233–241. doi: 10.1038/35025203. [DOI] [PMC free article] [PubMed] [Google Scholar]
- 5.Maeda N. Development of apolipoprotein E-deficient mice. Arterioscler Thromb Vasc Biol. 2011;31:1957–1962. doi: 10.1161/ATVBAHA.110.220574. [DOI] [PMC free article] [PubMed] [Google Scholar]
- 6.Holmes MV, et al. Utility of genetic determinants of lipids and cardiovascular events in assessing risk. Nat Rev Cardiol. 2011;8:207–221. doi: 10.1038/nrcardio.2011.6. [DOI] [PubMed] [Google Scholar]
- 7.Lusis AJ, et al. Genetics of atherosclerosis. Annu Rev Genomics Hum Genet. 2004;5:189–218. doi: 10.1146/annurev.genom.5.061903.175930. [DOI] [PubMed] [Google Scholar]
- 8.Marenberg ME, et al. Genetic susceptibility to death from coronary heart disease in a study of twins. N Engl J Med. 1994;330:1041–1046. doi: 10.1056/NEJM199404143301503. [DOI] [PubMed] [Google Scholar]
- 9.Altshuler D, et al. Genetic mapping in human disease. Science. 2008;322:881–888. doi: 10.1126/science.1156409. [DOI] [PMC free article] [PubMed] [Google Scholar]
- 10.Bronte-Stewart B, et al. ABO blood groups in relation to ischaemic heart disease. Br Med J. 1962;1:1646–1650. doi: 10.1136/bmj.1.5293.1646. [DOI] [PMC free article] [PubMed] [Google Scholar]
- 11.Hegele RA. Plasma lipoproteins: genetic influences and clinical implications. Nat Rev Genet. 2009;10:109–121. doi: 10.1038/nrg2481. [DOI] [PubMed] [Google Scholar]
- 12.Teslovich TM, et al. Biological, clinical and population relevance of 95 loci for blood lipids. Nature. 2010;466:707–713. doi: 10.1038/nature09270. [DOI] [PMC free article] [PubMed] [Google Scholar]
- 13.Helgadottir A, et al. The gene encoding 5-lipoxygenase activating protein confers risk of myocardial infarction and stroke. Nat Genet. 2004;36:233–239. doi: 10.1038/ng1311. [DOI] [PubMed] [Google Scholar]
- 14.Dwyer JH, et al. Arachidonate 5-lipoxygenase promoter genotype, dietary arachidonic acid, and atherosclerosis. N Engl J Med. 2004;350:29–37. doi: 10.1056/NEJMoa025079. [DOI] [PubMed] [Google Scholar]
- 15.Pajukanta P, et al. Familial combined hyperlipidemia is associated with upstream transcription factor 1 (USF1) Nat Genet. 2004;36:371–376. doi: 10.1038/ng1320. [DOI] [PubMed] [Google Scholar]
- 16.Chen Y, et al. Genetic and genomic insights into the molecular basis of atherosclerosis. Cell Metab. 2007;6:164–179. doi: 10.1016/j.cmet.2007.07.001. [DOI] [PMC free article] [PubMed] [Google Scholar]
- 17.Flint J, Mott R. Finding the molecular basis of quantitative traits: successes and pitfalls. Nat Rev Genet. 2001;2:437–445. doi: 10.1038/35076585. [DOI] [PubMed] [Google Scholar]
- 18.Castellani LW, et al. Overexpression of apolipoprotein AII in transgenic mice converts high density lipoproteins to proinflammatory particles. J Clin Invest. 1997;100:464–474. doi: 10.1172/JCI119554. [DOI] [PMC free article] [PubMed] [Google Scholar]
- 19.Wang X, et al. Positional identification of TNFSF4, encoding OX40 ligand, as a gene that influences atherosclerosis susceptibility. Nat Genet. 2005;37:365–372. doi: 10.1038/ng1524. [DOI] [PubMed] [Google Scholar]
- 20.Ghazalpour A, et al. Complex inheritance of the 5-lipoxygenase locus influencing atherosclerosis in mice. Genetics. 2006;173:943–951. doi: 10.1534/genetics.106.057455. [DOI] [PMC free article] [PubMed] [Google Scholar]
- 21.Gargalovic PS, et al. Quantitative trait locus mapping and identification of Zhx2 as a novel regulator of plasma lipid metabolism. Circ Cardiovasc Genet. 2010;3:60–67. doi: 10.1161/CIRCGENETICS.109.902320. [DOI] [PMC free article] [PubMed] [Google Scholar]
- 22.Wang X, et al. Hyplip2, a new gene for combined hyperlipidemia and increased atherosclerosis. Arterioscler Thromb Vasc Biol. 2004;24:1928–1934. doi: 10.1161/01.ATV.0000143385.30354.bb. [DOI] [PubMed] [Google Scholar]
- 23.Lander ES. Initial impact of the sequencing of the human genome. Nature. 2011;470:187–197. doi: 10.1038/nature09792. [DOI] [PubMed] [Google Scholar]
- 24.Musunuru K, Kathiresan S. Genetics of coronary artery disease. Annu Rev Genomics Hum Genet. 2010;11:91–108. doi: 10.1146/annurev-genom-082509-141637. [DOI] [PubMed] [Google Scholar]
- 25.Schunkert H, et al. Large-scale association analysis identifies 13 new susceptibility loci for coronary artery disease. Nat Genet. 2011;43:333–338. doi: 10.1038/ng.784. [DOI] [PMC free article] [PubMed] [Google Scholar]
- 26.Peden JF, et al. A genome-wide association study in Europeans and South Asians identifies five new loci for coronary artery disease. Nat Genet. 2011;43:339–344. doi: 10.1038/ng.782. [DOI] [PubMed] [Google Scholar]
- 27.Wang F, et al. Genome-wide association identifies a susceptibility locus for coronary artery disease in the Chinese Han population. Nat Genet. 2011;43:345–349. doi: 10.1038/ng.783. [DOI] [PubMed] [Google Scholar]
- 28.Musunuru K, et al. From noncoding variant to phenotype via SORT1 at the 1p13 cholesterol locus. Nature. 2010;466:714–719. doi: 10.1038/nature09266. [DOI] [PMC free article] [PubMed] [Google Scholar]
- 29.Consortium, W.T.C.C. Genome-wide association study of 14,000 cases of seven common diseases and 3,000 shared controls. Nature. 2007;447:661–678. doi: 10.1038/nature05911. [DOI] [PMC free article] [PubMed] [Google Scholar]
- 30.Erdmann J, et al. New susceptibility locus for coronary artery disease on chromosome 3q22.3. Nat Genet. 2009;41:280–282. doi: 10.1038/ng.307. [DOI] [PMC free article] [PubMed] [Google Scholar]
- 31.Helgadottir A, et al. A common variant on chromosome 9p21 affects the risk of myocardial infarction. Science. 2007;316:1491–1493. doi: 10.1126/science.1142842. [DOI] [PubMed] [Google Scholar]
- 32.Holdt LM, Teupser D. Recent studies of the human chromosome 9p21 locus, which is associated with atherosclerosis in human populations. Arterioscler Thromb Vasc Biol. 2012;32:196–206. doi: 10.1161/ATVBAHA.111.232678. [DOI] [PubMed] [Google Scholar]
- 33.Kathiresan S, et al. Genome-wide association of early-onset myocardial infarction with single nucleotide polymorphisms and copy number variants. Nat Genet. 2009;41:334–341. doi: 10.1038/ng.327. [DOI] [PMC free article] [PubMed] [Google Scholar]
- 34.McPherson R, et al. A common allele on chromosome 9 associated with coronary heart disease. Science. 2007;316:1488–1491. doi: 10.1126/science.1142447. [DOI] [PMC free article] [PubMed] [Google Scholar]
- 35.Samani NJ, et al. Genomewide association analysis of coronary artery disease. N Engl J Med. 2007;357:443–453. doi: 10.1056/NEJMoa072366. [DOI] [PMC free article] [PubMed] [Google Scholar]
- 36.Yasuno K, et al. Genome-wide association study of intracranial aneurysm identifies three new risk loci. Nat Genet. 2010;42:420–425. doi: 10.1038/ng.563. [DOI] [PMC free article] [PubMed] [Google Scholar]
- 37.Kuo CL, et al. Cdkn2a is an atherosclerosis modifier locus that regulates monocyte/macrophage proliferation. Arterioscler Thromb Vasc Biol. 2011;31:2483–2492. doi: 10.1161/ATVBAHA.111.234492. [DOI] [PMC free article] [PubMed] [Google Scholar]
- 38.Harismendy O, et al. 9p21 DNA variants associated with coronary artery disease impair interferon-gamma signalling response. Nature. 2011;470:264–268. doi: 10.1038/nature09753. [DOI] [PMC free article] [PubMed] [Google Scholar]
- 39.Reilly MP, et al. Identification of ADAMTS7 as a novel locus for coronary atherosclerosis and association of ABO with myocardial infarction in the presence of coronary atherosclerosis: two genome-wide association studies. Lancet. 2011;377:383–392. doi: 10.1016/S0140-6736(10)61996-4. [DOI] [PMC free article] [PubMed] [Google Scholar]
- 40.Wu O, et al. ABO(H) blood groups and vascular disease: a systematic review and meta-analysis. J Thromb Haemost. 2008;6:62–69. doi: 10.1111/j.1538-7836.2007.02818.x. [DOI] [PubMed] [Google Scholar]
- 41.Bis JC, et al. Meta-analysis of genome-wide association studies from the CHARGE consortium identifies common variants associated with carotid intima media thickness and plaque. Nat Genet. 2011;43:940–947. doi: 10.1038/ng.920. [DOI] [PMC free article] [PubMed] [Google Scholar]
- 42.Conde L, et al. Novel associations for coronary artery disease derived from genome wide association studies are not associated with increased carotid intima-media thickness, suggesting they do not act via early atherosclerosis or vessel remodeling. Atherosclerosis. 2011;219:684–689. doi: 10.1016/j.atherosclerosis.2011.08.031. [DOI] [PubMed] [Google Scholar]
- 43.Bennett BJ, et al. Genetic regulation of atherosclerotic plaque size and morphology in the innominate artery of hyperlipidemic mice. Arterioscler Thromb Vasc Biol. 2009;29:348–355. doi: 10.1161/ATVBAHA.108.176685. [DOI] [PMC free article] [PubMed] [Google Scholar]
- 44.Tomita H, et al. Aortic arch curvature and atherosclerosis have overlapping quantitative trait loci in a cross between 129S6/SvEvTac and C57BL/6J apolipoprotein E-null mice. Circ Res. 2011;106:1052–1060. doi: 10.1161/CIRCRESAHA.109.207175. [DOI] [PMC free article] [PubMed] [Google Scholar]
- 45.Cohen JC, et al. Multiple rare alleles contribute to low plasma levels of HDL cholesterol. Science. 2004;305:869–872. doi: 10.1126/science.1099870. [DOI] [PubMed] [Google Scholar]
- 46.Zuk O, et al. The mystery of missing heritability: Genetic interactions create phantom heritability. Proc Natl Acad Sci U S A. 2012;109:1193–1198. doi: 10.1073/pnas.1119675109. [DOI] [PMC free article] [PubMed] [Google Scholar]
- 47.Mackay TF, et al. The genetics of quantitative traits: challenges and prospects. Nat Rev Genet. 2009;10:565–577. doi: 10.1038/nrg2612. [DOI] [PubMed] [Google Scholar]
- 48.Charchar FJ, et al. Inheritance of coronary artery disease in men: an analysis of the role of the Y chromosome. Lancet. 2012 doi: 10.1016/S0140-6736(11)61453-0. [DOI] [PMC free article] [PubMed] [Google Scholar]
- 49.Kjolby M, et al. Sort1, encoded by the cardiovascular risk locus 1p13.3, is a regulator of hepatic lipoprotein export. Cell Metab. 2010;12:213–223. doi: 10.1016/j.cmet.2010.08.006. [DOI] [PubMed] [Google Scholar]
- 50.Nadeau JH, Dudley AM. Genetics. Systems genetics. Science. 2011;331:1015–1016. doi: 10.1126/science.1203869. [DOI] [PMC free article] [PubMed] [Google Scholar]
- 51.Romanoski CE, et al. Network for activation of human endothelial cells by oxidized phospholipids: a critical role of heme oxygenase 1. Circ Res. 2011;109:e27–41. doi: 10.1161/CIRCRESAHA.111.241869. [DOI] [PMC free article] [PubMed] [Google Scholar]
- 52.Schadt EE. Molecular networks as sensors and drivers of common human diseases. Nature. 2009;461:218–223. doi: 10.1038/nature08454. [DOI] [PubMed] [Google Scholar]
- 53.Zeller T, et al. Genetics and beyond--the transcriptome of human monocytes and disease susceptibility. PLoS One. 2010;5:e10693. doi: 10.1371/journal.pone.0010693. [DOI] [PMC free article] [PubMed] [Google Scholar]
- 54.Hagg S, et al. Multi-organ expression profiling uncovers a gene module in coronary artery disease involving transendothelial migration of leukocytes and LIM domain binding 2: the Stockholm Atherosclerosis Gene Expression (STAGE) study. PLoS Genet. 2009;5:e1000754. doi: 10.1371/journal.pgen.1000754. [DOI] [PMC free article] [PubMed] [Google Scholar]
- 55.Lewis GD, Gerszten RE. Toward metabolomic signatures of cardiovascular disease. Circ Cardiovasc Genet. 2010;3:119–121. doi: 10.1161/CIRCGENETICS.110.954941. [DOI] [PMC free article] [PubMed] [Google Scholar]
- 56.Wang Z, et al. Gut flora metabolism of phosphatidylcholine promotes cardiovascular disease. Nature. 2011;472:57–63. doi: 10.1038/nature09922. [DOI] [PMC free article] [PubMed] [Google Scholar]
- 57.Ehret GB, et al. Genetic variants in novel pathways influence blood pressure and cardiovascular disease risk. Nature. 2011;478:103–109. doi: 10.1038/nature10405. [DOI] [PMC free article] [PubMed] [Google Scholar]
- 58.Farber CR, et al. Mouse genome-wide association and systems genetics identify Asxl2 as a regulator of bone mineral density and osteoclastogenesis. PLoS Genet. 2011;7:e1002038. doi: 10.1371/journal.pgen.1002038. [DOI] [PMC free article] [PubMed] [Google Scholar]
- 59.Korshunov VA, Berk BC. Genetic modifier loci linked to intima formation induced by low flow in the mouse carotid. Arterioscler Thromb Vasc Biol. 2009;29:47–53. doi: 10.1161/ATVBAHA.108.178111. [DOI] [PMC free article] [PubMed] [Google Scholar]
- 60.Kang HM, et al. Efficient control of population structure in model organism association mapping. Genetics. 2008;178:1709–1723. doi: 10.1534/genetics.107.080101. [DOI] [PMC free article] [PubMed] [Google Scholar]
- 61.Bennett BJ, et al. A high-resolution association mapping panel for the dissection of complex traits in mice. Genome Res. 2010;20:281–290. doi: 10.1101/gr.099234.109. [DOI] [PMC free article] [PubMed] [Google Scholar]
- 62.Philip VM, et al. Genetic analysis in the Collaborative Cross breeding population. Genome Res. 2011;21:1223–1238. doi: 10.1101/gr.113886.110. [DOI] [PMC free article] [PubMed] [Google Scholar]
- 63.Wang SS, et al. Identification of pathways for atherosclerosis in mice: integration of quantitative trait locus analysis and global gene expression data. Circ Res. 2007;101:e11–30. doi: 10.1161/CIRCRESAHA.107.152975. [DOI] [PubMed] [Google Scholar]
- 64.Paigen B, et al. Ath-1, a gene determining atherosclerosis susceptibility and high density lipoprotein levels in mice. Proc Natl Acad Sci U S A. 1987;84:3763–3767. doi: 10.1073/pnas.84.11.3763. [DOI] [PMC free article] [PubMed] [Google Scholar]
- 65.Phelan SA, et al. Confirmation and high resolution mapping of an atherosclerosis susceptibility gene in mice on Chromosome 1. Mamm Genome. 2002;13:548–553. doi: 10.1007/s00335-002-2196-1. [DOI] [PubMed] [Google Scholar]
- 66.Burkhardt R, et al. Cosegregation of aortic root atherosclerosis and intermediate lipid phenotypes on chromosomes 2 and 8 in an intercross of C57BL/6 and BALBc/ByJ low-density lipoprotein receptor-/- mice. Arterioscler Thromb Vasc Biol. 2011;31:775–784. doi: 10.1161/ATVBAHA.110.213843. [DOI] [PubMed] [Google Scholar]
- 67.Welch CL, et al. Localization of atherosclerosis susceptibility loci to chromosomes 4 and 6 using the Ldlr knockout mouse model. Proc Natl Acad Sci U S A. 2001;98:7946–7951. doi: 10.1073/pnas.141239098. [DOI] [PMC free article] [PubMed] [Google Scholar]
- 68.Mehrabian M, et al. Genetic locus in mice that blocks development of atherosclerosis despite extreme hyperlipidemia. Circ Res. 2001;89:125–130. doi: 10.1161/hh1401.093458. [DOI] [PubMed] [Google Scholar]
- 69.Dansky HM, et al. A phenotype-sensitizing Apoe-deficient genetic background reveals novel atherosclerosis predisposition loci in the mouse. Genetics. 2002;160:1599–1608. doi: 10.1093/genetics/160.4.1599. [DOI] [PMC free article] [PubMed] [Google Scholar]
- 70.Teupser D, et al. Atherosclerosis quantitative trait loci are sex- and lineage-dependent in an intercross of C57BL/6 and FVB/N low-density lipoprotein receptor-/- mice. Proc Natl Acad Sci U S A. 2006;103:123–128. doi: 10.1073/pnas.0509570102. [DOI] [PMC free article] [PubMed] [Google Scholar]
- 71.Colinayo VV, et al. Genetic loci for diet-induced atherosclerotic lesions and plasma lipids in mice. Mamm Genome. 2003;14:464–471. doi: 10.1007/s00335-002-2187-2. [DOI] [PubMed] [Google Scholar]
- 72.Korstanje R, et al. Mapping of rabbit microsatellite markers using chromosome-specific libraries. J Hered. 2003;94:161–169. doi: 10.1093/jhered/esg016. [DOI] [PubMed] [Google Scholar]
- 73.Smith JD, et al. Atherosclerosis susceptibility loci identified from a strain intercross of apolipoprotein E-deficient mice via a high-density genome scan. Arterioscler Thromb Vasc Biol. 2006;26:597–603. doi: 10.1161/01.ATV.0000201044.33220.5c. [DOI] [PubMed] [Google Scholar]