Abstract
The aim was to reach consensus in imaging for staging and follow-up as well as for therapy response assessment in patients with gastrointestinal stromal tumours (GIST). The German GIST Imaging Working Group was formed by 9 radiologists engaged in assessing patients with GIST treated with targeted therapy. The following topics were discussed: indication and optimal acquisition techniques of computed tomography (CT), magnetic resonance imaging (MRI) and positron emission tomography (PET)/CT; tumour response assessment considering response criteria and measurement techniques on CT, MRI and PET/CT; result interpretation; staging interval and pitfalls. Contrast-enhanced CT is the standard method for GIST imaging. MRI is the method of choice in case of liver-specific questions or contraindications to CT. PET/CT should be used for early response assessment or inconclusive results on morphologic imaging. All imaging techniques should be standardized allowing a reliable response assessment. Response has to be assessed with respect to lesion size, lesion density and appearance of new lesions. A critical issue is pseudoprogression due to myxoid degeneration or intratumoural haemorrhage. The management of patients with GIST receiving a targeted therapy requires a standardized algorithm for imaging and an appropriate response assessment with respect to changes in lesion size and density.
Keywords: Gastrointestinal stromal tumour, imaging, staging, therapy response, Choi criteria, RECIST
Introduction
Gastrointestinal stromal tumours (GIST) represent the most common mesenchymal malignancy arising from the gastrointestinal tract. Most frequently, GISTs are located in the stomach (60%) and the small bowel (30%) but can occur anywhere from the oesophagus to the rectum and in the omentum, mesentery and retroperitoneum[1,2]. GISTs metastasize most often to the liver, omentum and peritoneum by hematogenous spread and peritoneal seeding[2–4]. During the last century no effective drugs for advanced GISTs were available. For the first time, Joensuu et al.[5] reported in 2001 that the tyrosine kinase inhibitor (TKI) imatinib mesylate revealed striking effects in the treatment of GISTs. Imatinib mesylate, a small molecule, has an antiproliferative and antiangiogenetic effect as it inhibits the mutated subset of the protooncogene cKIT and the platelet-derived growth factor receptor alpha (PDGFRA) that is frequently found in GISTs. Over the last decade, this new approach raised a still ongoing discussion with regard to tumour response assessment: in most patients undergoing imatinib therapy, GIST lesions showed only a minor reduction in size despite an obvious response, but the lesions regularly became hypoattenuated in contrast-enhanced CT[5–7]. Moreover, patients with progressive disease not necessarily present with an increase in lesion size or with new lesions but with a new phenomenon called nodule within a mass[8]. These characteristics are not addressed by the Response Evaluation Criteria in Solid Tumors (RECIST), which are based on measurements of the longest axial lesion diameter and commonly applied to assess therapy response[9,10]. Therefore, Choi et al.[11,12] introduced CT criteria additionally addressing changes in lesion density. Other studies evaluated the use of [18F]fluorodeoxyglucose (FDG)-positron emission tomography (PET) due to the fact that density changes of GIST lesions and therefore tumour vitality might be reflected by changes in the glucose metabolism[13–15].
However, for the optimal management of patients with GIST receiving a targeted therapy, it is required that the applied algorithm in imaging for staging and follow-up as well as for therapy response assessment is widely standardized. But to the best of our knowledge, current reports about the management of patients with GIST are primarily addressed to treatment strategies[4,16,17] and imaging algorithms are not mentioned. Therefore, the German GIST Imaging Working Group was formed and composed this consensus report to build an algorithm for the imaging management of patients with GISTs.
Materials and methods
The German GIST Imaging Working Group was organized by 2 radiologists (S.D., G.A.) who invited German radiologists known for their engagement in the radiological assessment of patients with GISTs at specialized centres. All participants of the German GIST Imaging Working Group have extensive expertise in clinical trials of targeted drugs like imatinib or sunitinib.
The Working Group was supported by an unrestricted grant from Novartis Pharma, Nuremberg, Germany. The summit was performed to address and discuss the following end points: (a) indication and optimal acquisition technique for CT, magnetic resonance imaging (MRI) and [18F]FDG-PET/CT scan at baseline (before onset of a targeted therapy), during and after the end of treatment with respect to the scan region, application of intravenous or oral contrast agent (sort, amount, flow rate), need for dynamic studies, scanning and reconstruction parameters and MRI sequences, respectively; (b) tumour response assessment considering measurement techniques on CT, MRI and [18F]FDG-PET/CT and result interpretation; (c) identifying pitfalls; (d) staging interval. In preparation for the consensus meeting, all participants studied the German and English literature that was selected stepwise. First, a search for the paired key words “imaging” and “gastrointestinal stromal tumo(u)rs” using the US National Library of Medicine PubMed was performed and yielded 127 articles. Second, these articles were screened for topics concerning diagnostic quality of CT, MRI and PET and/or methods to assess therapy response. Sixty-one journal articles remained for systematic review including 24 original contributions that evaluated the diagnostic quality of PET[13,18] and MRI[19] in comparison with CT as well as by histological work-ups for PET[20], CT[19,21,22] and MRI[19]. Methods to assess therapy response by different imaging modalities were explored by CT[6,23–25], PET[14,20,26,27], PET+CT[8,11–13,18,28–30] and MRI[7,31,32]. Benjamin et al.[33] performed the only validating study with regard to the modified CT criteria proposed by Choi et al.[12] In view of this weak data situation, the consensus determined by this Working Group could not be evidence-based and, therefore, is primarily based on the experience of the panellists.
The consensus meeting was led by an independent professional moderator to reach consensus on the end points and to avoid a unilateral consensus formation by individual panellists. The discussion on each end point was started with an introductory presentation by one of the panellists including a review of the literature. The other panellists contributed with information derived from the literature and their experience of imaging GIST patients including examinations within clinical trials. Subsequently, potential controversial aspects were discussed. If panellists disagreed on a specific aspect, resolution was attempted by suggesting a compromise all panellist could agree on. Only if all panellists agreed unanimously was this opinion regarded as a consensus. The results of the German GIST Imaging Working Group are presented here. To our knowledge, these specific radiological end points have not been addressed in earlier statements on GIST management.
Imaging acquisition protocol and indication
Computed tomography
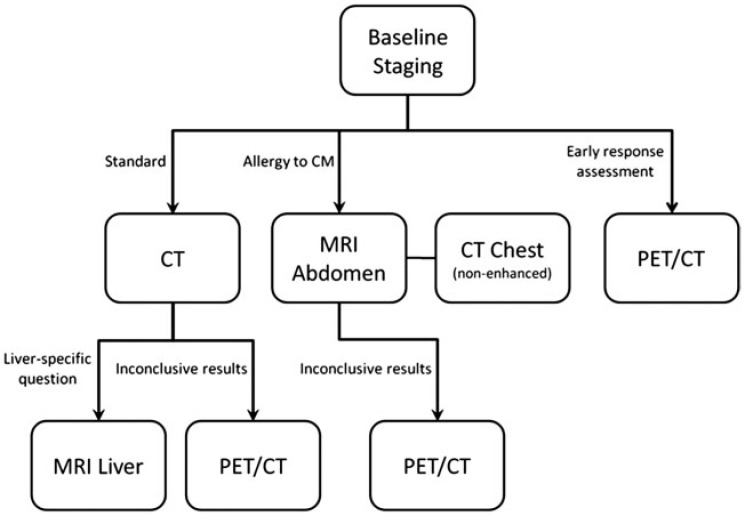
CT is the standard imaging method in patients with GISTs[3,34] (Fig. 1). CT has a high reliability in tumour detection and staging and has been established as the standard method for assessing therapy response. Furthermore, CT is widely available, has high patient comfort and is an economically competitive method. Due to known difficulties in assessing response in GIST patients, it is important to preferably provide the same examination protocol and therapy response assessment to all GIST patients. Therefore, patients with GIST should routinely be staged by CT with a standardized protocol as follows.
Figure 1.
Algorithm for optimal use of different imaging modalities. CM, contrast media.
Thorax. As the incidence of pulmonary metastases at the first presentation is rare (2%)[35], a CT scan of the chest is only recommended at the baseline staging. Patients do not have to be followed up by chest CT if they initially had no pulmonary metastases. Additional CT of the chest is recommended in case of progression of abdominal disease.
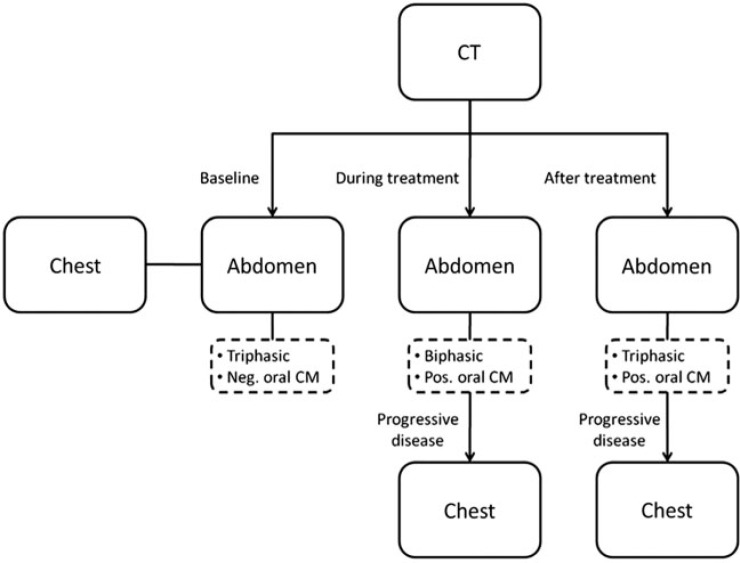
Abdomen. For baseline staging (before onset of therapy), the CT protocol should be triphasic consisting of a non-enhanced phase, an arterial phase, and a portal venous phase of the liver[34] with the portal venous phase covering the complete abdomen and pelvis. During therapy, patients should be followed by biphasic CT containing a non-enhanced and a portal venous phase[4] (Fig. 2). The follow-up CT of patients after the end of therapy should be the same as the protocol at baseline (Fig. 1).
Figure 2.
Overview about the scanning region, the recommended contrast-enhanced CT phases and the choice of negative or positive oral contrast agents (CA) at baseline, during and after treatment. Abdomen always consists of upper abdomen and pelvis. CM, contrast media.
In general, CT should be performed after intravenous administration of 120 ml of a nonionic iodine contrast agent (300 mg/ml) or an equivalent iodine dose followed by 30 ml of a saline bolus. A flow rate of 3–4 ml/s is preferable. The delay ideally should be determined by bolus triggering; thereafter, the portal venous phase should start after 30–40 s. Otherwise, the arterial and portal venous phases should be started after 30–40 s and 60–70 s after injection, respectively.
Patients receiving their baseline staging CT should receive a negative/water-equivalent oral contrast agent allowing for the detection of gastrointestinal tract wall lesions[4,36]. During therapy and after the end of treatment, patients should receive a positive oral contrast agent allowing for detection of recurrent tumour or peritoneal metastases. In these cases, the use of negative oral contrast agents seems to be dispensable (Fig. 2), as metastases most often involve the liver and peritoneum, whereas intramural metastases occur rarely in the intestine[3,4].
The scan parameters (tube voltage, tube current, slice thickness) should be similar for all examinations to afford comparable measurements of Hounsfield units (HU) reflecting density changes[12]. A reconstructed slice thickness of 5 mm and a multiplanar reformation in a second plane (e.g. coronal) is preferable.
The parameters of intravenous contrast agent injection and scan parameters should be ideally registered on images or in the report. A patient presenting with a baseline staging CT that deviates from these requirements should receive a new appropriate CT scan.
Magnetic resonance imaging
MRI should be applied in cases of potential resection of liver metastases due to the higher sensitivity in detecting small liver lesions. Moreover, MRI is an alternative method to CT if contraindications to CT exist (e.g. allergy to iodine contrast agents) (Fig. 1)[4].
Thorax. Patients should receive a non-enhanced CT of the thorax at baseline as CT allows more sensitive lesion detection than MRI (Fig. 1).
Abdomen. Patients with a liver-related question (e.g. potential hepatic resection) should receive an MRI of the liver[4]. Patients with contraindications to CT should receive a scanning protocol that includes the complete abdomen and pelvis (Fig. 1).
MRI of the liver in addition to a CT due to a liver-related question
This protocol should consist of a non-enhanced T1-weighted sequence with an in-phase and opposed-phase acquisition and T2-weighted sequence. One sequence should be acquired with fat saturation. Images should have a maximum slice thickness of 7 mm. If possible, diffusion-weighted imaging (DWI) should be performed. Every patient should undergo a multiphase study of the liver after intravenous administration of a single dose (0.1 mmol/kg) of a gadolinium contrast agent followed by 40 ml of a saline bolus. Thereby a flow rate of 2 ml/s should be used to inject 0.5 M contrast agent, otherwise the flow rate has to be adapted. This study should at least consist of a non-enhanced, an arterial and a portal venous phase and should be acquired as a T1-weighted sequence with fat saturation in an axial plane and with a slice thickness of a maximum of 5 mm (Table 1). In case of an intended resection of a liver lesion, the application of a liver-specific contrast agent is preferable.
Table 1.
List of sequences that should be used in MRI of the liver and abdomen
| Sequence | Slice thickness (mm) | Liver | Abdomen |
|---|---|---|---|
| T1 in-phase/opposed phase, axial | ≤7 | + | + |
| T2 axial | ≤7 | + | + |
| DWI axial | ≤5 | + | |
| Dynamic liver scan T1 fat saturation, axial | ≤5 | + | + |
| T1 fat saturation, axial | ≤7 | + | + |
| T1 fat saturation, coronal | ≤7 | + |
MRI abdomen (liver and pelvis) in patients with contraindication to CT
The required sequences for an MRI of the abdomen are almost similar to the MRI protocol of the liver. Except for the sequence of the multiphase study of the liver, sequences have to be adapted to cover the complete abdomen and pelvis. In addition, a T1-weighted sequence with fat saturation should be performed in a coronal plane with a slice thickness of at most 7 mm (Table 1).
Patients receiving their baseline staging MRI should be prepared with an intravenous spasmolytic agent such as butylscopolamine and an oral contrast agent. Depending on the site of metastases, patients may also receive spasmolysis and/or an oral contrast agent at follow-up or after the end of therapy.
The application data of the intravenous contrast agent and scan parameters should be ideally registered on images or in the report.
Positron emission tomography
PET/CT with [18F]FDG is a potential alternative to CT and is particularly indicated in terms of ambiguous CT or MRI results[4,37]. Furthermore, [18F]FDG-PET allows early response assessment[13–15] (Fig. 1).
At baseline, the PET/CT scan should cover the complete thorax, abdomen and pelvis. During follow-up, a scan of the abdomen is always necessary, while further scans of the thorax are only required in patients with pulmonary metastases or progressive disease.
For PET, [18F]FDG should be applied as the radionuclide of choice and the activity administered should be in accordance with the European Organization for Research and Treatment of Cancer (EORTC) guidelines[38]. Generally, a full-dose CT with an iodine contrast agent should be included according to the CT guidelines introduced above. PET/CT with a low-dose or non-enhanced CT does not compensate for a CT as described above[10]. A low-dose [18F]FDG-PET/CT should only be applied if a short-term follow-up for an early response assessment during therapy is clinically indicated.
Therapy response assessment
Measurement technique
Therapy response is commonly assessed according to RECIST 1.1[9] Therefore, the longest axial lesion diameter (RECIST diameter) of a maximum of 2 target lesions per organ and 5 per patient should be measured (Table 2). The assessment of patients with GIST also requires evaluation of lesion density[11,39,40].
Table 2.
Response criteria and modified CT criteria according to RECIST and Choi
| Response | RECIST 1.1 | Choi |
|---|---|---|
| PD | Increase of at least 20% and 5 mm in SLD | Increase of at least 10% in SLD and decrease of less than 15% in MLDa |
| New lesion(s) | New lesion(s) | |
| Unequivocal progression of non-target lesion(s) | New or increasing nodule(s) within a mass | |
| SD | Decrease of less than 30% and increase of less than 20% in SLD | Decrease of less than 10% and increase of less than 10% in SLD and decrease of less than 15% in MLDa |
| PR | Decrease of at least 30% in SLD | Decrease of at least 10% in SLD and decrease of at least 15% in MLDa |
| CR | Complete remission | Complete remission |
PD, progressive disease; SD, stable disease; PR, partial complete response; CR, complete response; SLD, sum of the longest diameter according to RECIST[9]; MLD, mean lesion density according to modified CT criteria[11].
aComplementary recommendation of the German GIST Working Group: density changes should account for at least 10 HU.
Computed tomography
On CT images, lesion density is reflected by intratumoural attenuation in Hounsfield units (HU) and should be assessed in the portal venous phase. Preferably, the measurement is performed on the level of the RECIST diameter by a polygonal region of interest (ROI) that borders the entire lesion including the hypervascularized rim, if present (Fig. 3). Alternatively, an ellipsoid or circular ROI may be used and should contain the maximum of the target lesion. In inhomogeneous lesions, an additional ROI should be similarly measured in the centre of the upper and/or lower half of the target lesion and the mean value should be calculated. Changes in HU during follow-up should be assessed analogously to RECIST: HU measurements of all lesions should be averaged at each follow-up and the resulting mean HU value should be compared with the nadir of the mean HU measurements during follow-up.
Figure 3.
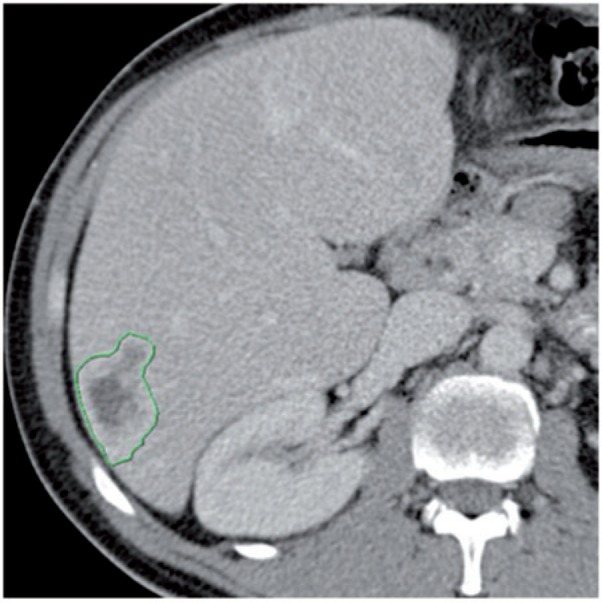
Liver metastasis with hypervascularized rim that should be included in the density measurement by a polygonal ROI.
Magnetic resonance imaging
On MRI, therapy response is assessed by the same methods introduced for CT. So far, assessment of therapy response by changes in signal intensity (SI) has only been explored in 2 studies[7,31]. Compared with measurements of HU at CT, SI changes are less reliably assessable even if standardized MRI protocols are used.
Positron emission tomography
Evaluation of a PET/CT is based on the assessment of the CT component as described above and the PET component. On [18F]FDG-PET/CT, the glucose metabolism is reflected by the maximum standardized uptake value (SUVmax) and recorded by a single ROI covering the entire lesion.
In general, it is highly recommended to reassess the previous measurements of lesion size and density during follow-up although this is different to common requirements of clinical trials.
Interpretation of results
Therapy response assessment in patients with GIST consists of changes in lesion size, in lesion density and the appearance of new lesions[40]. Lesion size should generally be measured according to the RECIST criteria (Table 2)[9]. In addition, the assessment of lesion density is important, as therapy response is commonly reflected by a decrease in lesion attenuation due to myxoid degeneration[1,5]. Therefore, changes in lesion density should be assessed quantitatively and qualitatively by ROI measurements as mentioned above and by a visual analysis regarding lesion homogeneity as described below.
Computed tomography
Choi et al.[12] suggested a threshold of 15% in decrease of lesion attenuation to quantitatively assess response on CT images. However, up to now its validity has not been proven by a large prospective trial. With respect to the measurement variability of a manually drawn ROI, we recommend that the difference in lesion density should account for at least 10 HU and that the standard deviation of ROI measurements should be considered.
Magnetic resonance imaging
Compared with an assessment based on CT, at MRI it is more difficult to obtain reproducible measurements of the SI and up to now, no potential reference values were defined.
Positron emission tomography
In [18F]FDG-PET/CT the baseline SUVmax can be used as a reference to determine therapy response. A decrease of the SUVmax indicates tumour response. PET response criteria introduced by the EORTC group[38] may be applied, however, the reading physician has to be aware that these criteria are discussed controversially. In case of inconsistent results between the evaluation of the CT and PET components, the response has to be determined on an individual basis.
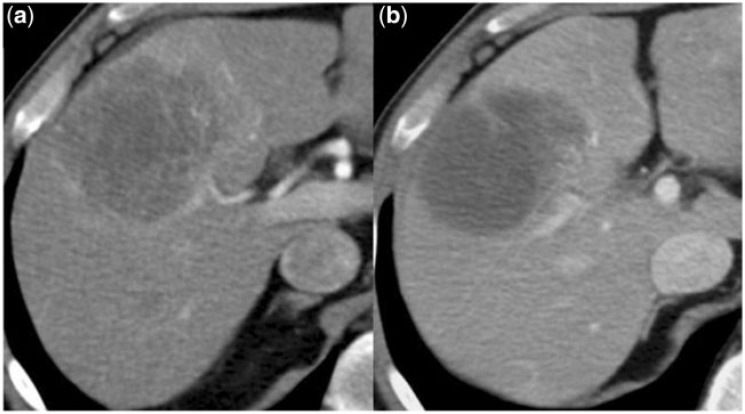
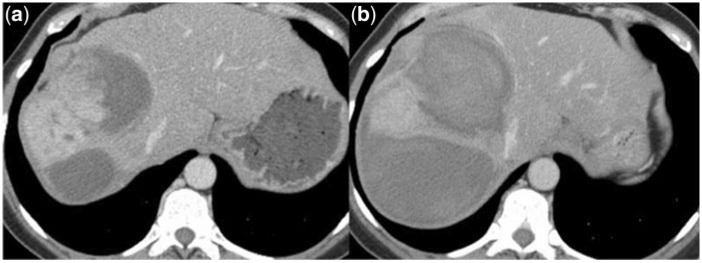
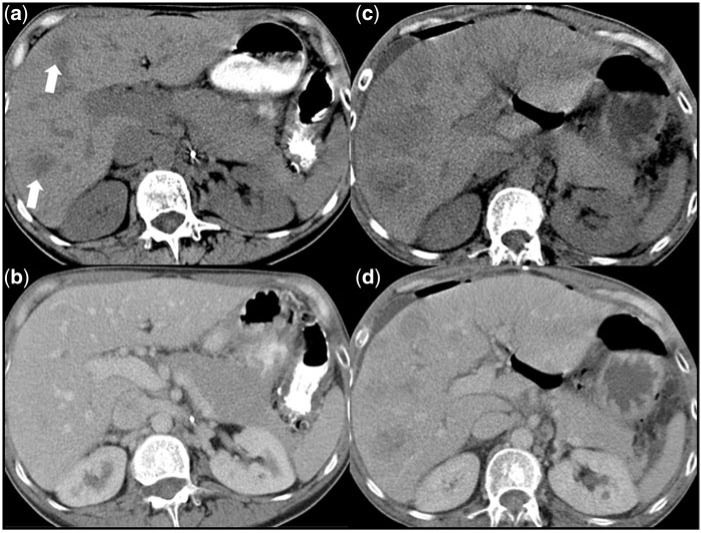
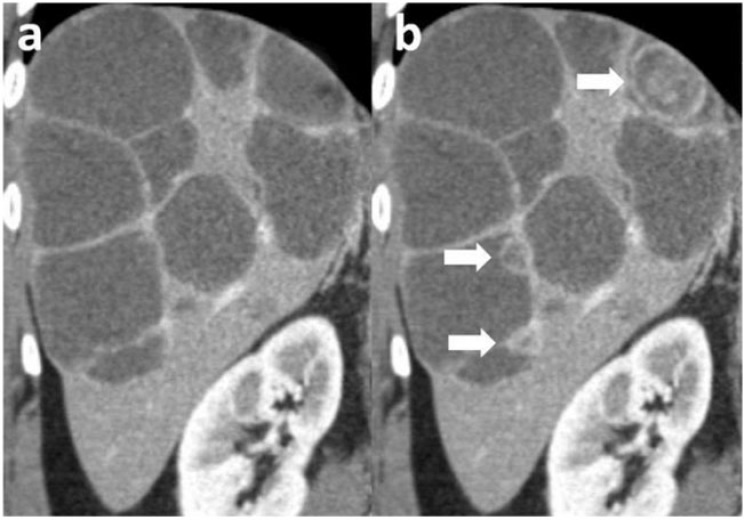
In general, the morphological response assessment of GISTs using CT or MRI is not only based on measurements of lesion size and density. It is important to critically evaluate these measurements with respect to the homogeneity of all lesions that may change due to variations of a hypervascularized rim, the appearance of a nodule within a mass or intratumoural haemorrhage. It is of paramount importance to distinguish pseudoprogression from real disease progression. Pseudoprogression can be caused by an increase in lesion size due to myxoid degeneration (Fig. 4) or intratumoural haemorrhage (Fig. 5). Pseudoprogression can also be caused by the appearance of a pseudo-new lesion that becomes hypoattenuated due to myxoid degeneration after onset of targeted therapy (Fig. 6)[34,37]. In contrast, real disease progression can be reflected by true new lesions, increasing lesion size, increasing attenuation of the rim or the entire lesion as well as the appearance of a new nodule within a mass, which presents a hyperattenuated nodule within a hypoattenuated lesion (Fig. 7)[8].
Figure 4.
(a) Before onset of imatinib therapy, this liver metastasis is hypervascularized and (b) at the next follow-up this lesion presents hypoattenuated reflecting myxoid degeneration.
Figure 5.
(a) Large metastastic liver lesion with hypervascularized center. (b) Twelve days later the patient presented with acute abdominal pain and a decrease in the haemoglobin level of 2.4 mg/l. CT revealed intratumoural haemorrhage and due to this an obvious increase in lesion size.
Figure 6.
(a) A non-enhanced CT phase shows 2 hypoattenuated liver lesions (white arrows). (b) These lesions were not detectable on the simultaneously acquired portal venous CT phase. (c, d) At the next follow-up CT scan, both lesions increased and are visible on the non-enhanced and portal venous CT phase.
Figure 7.
(a) Multiple GIST metastases with myxoid degeneration. (b) In the follow-up CT scan, the size of the lesions was almost stable but new hyperattenuated nodules within a mass (white arrows) appeared within 3 lesions as a sign of progressive disease.
Pitfalls
Response evaluation of GISTs occasionally can be difficult due to specific characteristics of this tumour treated with TKI. Therefore, it is recommended to consider the following characteristics for lesion selection, measurement and overall assessment. In principle, target lesions should represent the largest lesions but should also be well defined allowing accurate measurement. Confluent lesions and lesions that will probably be merged with other lesions at the next follow-up scan should be avoided. GIST lesions are frequently located in the peritoneum or intestine and may change their position between follow-up scans. This causes a misalignment of the lesion and prior measurements are not comparable with current measurements. Intestinal lesions can additionally mimic a decrease in size when liquid contents are drained. In summary, target lesions should preferably be immobile such as liver lesions.
As mentioned above, it is difficult to obtain reproducible measurements of the lesion density. Therefore, it is crucial that density measurements are not affected by adjacent vessels, hollow organs or oral contrast agent in the gastrointestinal tract. In addition, the ROI should avoid areas that are affected by a partial volume effect, otherwise a preferably larger lesion should be chosen. Furthermore, the visual evaluation should particularly attend to intratumoural haemorrhage as well as the nodule within a mass phenomenon. An increase in lesion size and density due to intratumoural haemorrhage does not reflect disease progression. Another incorrect response assessment may result from a missed nodule within a mass that is potentially not reflected by a target lesion or even a density measurement.
Follow-up interval
In general, the follow-up intervals are determined interdisciplinarily. Up to 4 weeks after onset of targeted therapy, the acquisition of an early follow-up CT is only indicated if a disease progression or a potential complication, e.g. haemorrhage is clinically suspected. Therefore, the CT follow-up protocol should be applied. In cases of a contraindication to CT, the indications can similarly be evaluated by the MRI follow-up protocol. PET/CT with [18F]FDG is the method of choice to assess early response[13–15,18] although this requires the existence of a baseline [18F]FDG-PET/CT as reference.
The first regular follow-up imaging is commonly performed at the end of the first month up to the third month after onset of therapy. At this time, therapy response should be primarily based on changes in lesion density. At the same time, changes in lesion size as well as the appearance of new lesions should be critically evaluated with respect to a potential pseudoprogression. PET/CT should only be applied to evaluate inconclusive results obtained by morphological imaging[4,37].
After 3 months of therapy, the response assessment should be based on changes in lesion density, size and the appearance of new lesions. As mentioned above, [18F]FDG-PET/CT should only be applied to evaluate inconclusive results[4,37].
Discussion
The introduction of targeted therapy in metastatic GIST raised new questions regarding imaging and therapy response assessment. Therefore, the German GIST Imaging Working Group elaborated recommendations for the radiological management of GIST patients.
Consensus was reached on all questions related to application and imaging acquisition techniques with respect to the time of imaging (baseline, during and after treatment), scan region, application of contrast agents, need for multiphase studies, postprocessing parameters and sequences. An adequate staging interval has to be determined in an interdisciplinary discussion, but with respect to indication and time of follow-up, the Working Group composed recommendations for the imaging methods.
The standard imaging technique in patients with GIST should be contrast-enhanced CT. CT is widely available, allows high patient comfort, is cost effective and has a high sensitivity in lesion detection[4], particularly for mesenteric and peritoneal metastases[19]. MRI is the method of choice in patients with contraindications to CT or liver-specific questions[17]. Due to the fact that targeted therapies induce metabolic changes in glucose metabolism, the relevance of [18F]FDG-PET/CT was also discussed. In GIST, the primary domain of [18F]FDG-PET or [18F]FDG-PET/CT is to assess an early response if necessary[13–15,18] and as an additional method in the case of inconclusive results on CT or MRI[4,37]. Choi et al.[11] reported that 20% of lesions did not show a significant glucose uptake on pretreatment [18F]FDG-PET. In summary, [18F]FDG-PET/CT is a promising method especially with regard to assessment of therapy response but it suffers from a limited availability and relatively high cost[10,11]. Therefore, the Working Group could not recommend the routine use of PET/CT in GIST patients.
GIST lesions responding to targeted therapy with imatinib commonly show myxoid degeneration[1,5] that is reflected by distinctly hypodense, almost cystic-appearing lesions on imaging. Consequently, CT lesion density should be considered in assessing response. For reproducible results, it is recommended to choose the target lesions according to the common and widely known RECIST criteria and measure the lesion density on the same level as the RECIST diameter. In inhomogeneous lesions, additional ROIs centrically in the upper and lower half should be measured. To further minimize measurement variability, we recommend that patients should always receive the same imaging technique and protocol. On MRI, measurements of SI are possible but less reliable due to large variability in the imaging technique. The response assessment might be difficult in lesions with increased density and size due to bleeding into the target lesion. Similarly, myxoid degeneration could cause an increase in size or a hypoattenuated pseudo-new lesion that has not been visible before[1,4,5]. Finally, it is of paramount importance that the radiologist critically reviews the results of all evaluation criteria. In a case of inconclusive results on CT or MRI, [18F]FDG-PET/CT might allow a more conclusive assessment of therapy response[4]. But as GIST lesions can be negative on [18F]FDG-PET before onset of targeted therapy[11], ideally a baseline [18F]FDG-PET/CT should be available[37].
Conclusion
The management of patients with GIST receiving targeted therapy requires a standardized imaging algorithm for staging and follow-up that allows appropriate response assessment with respect to changes in lesion size and density. Furthermore, response criteria considering HU or SI changes should be validated by futures studies.
Footnotes
This paper is available online at http://www.cancerimaging.org. In the event of a change in the URL address, please use the DOI provided to locate the paper.
References
- 1.Berman J, O'Leary TJ. Gastrointestinal stromal tumor workshop. Human Pathol. 2001;32:578–82. doi: 10.1053/hupa.2001.25484. [DOI] [PubMed] [Google Scholar]
- 2.Miettinen M, Lasota J. Gastrointestinal stromal tumors–definition, clinical, histological, immunohistochemical, and molecular genetic features and differential diagnosis. Virchows Arch. 2001;438:1–12. doi: 10.1007/s004280000338. [DOI] [PubMed] [Google Scholar]
- 3.Chourmouzi D, Sinakos E, Papalavrentios L, Akriviadis E, Drevelegas A. Gastrointestinal stromal tumors: a pictorial review. J Gastrointest Liver Dis. 2009;18:379–83. [PubMed] [Google Scholar]
- 4.Demetri GD, von Mehren M, Antonescu CR, et al. NCCN Task Force report: update on the management of patients with gastrointestinal stromal tumors. J Natl Comprehensive Cancer Network. 2010;8(Suppl 2):S1–41; quiz S42–4. doi: 10.6004/jnccn.2010.0116. [DOI] [PMC free article] [PubMed] [Google Scholar]
- 5.Joensuu H, Roberts PJ, Sarlomo-Rikala M, et al. Effect of the tyrosine kinase inhibitor STI571 in a patient with a metastatic gastrointestinal stromal tumor. N Engl J Med. 2001;344:1052–6. doi: 10.1056/NEJM200104053441404. [DOI] [PubMed] [Google Scholar]
- 6.Chen MY, Bechtold RE, Savage PD. Cystic changes in hepatic metastases from gastrointestinal stromal tumors (GISTs) treated with Gleevec (imatinib mesylate) AJR Am J Roentgenol. 2002;179:1059–62. doi: 10.2214/ajr.179.4.1791059. [DOI] [PubMed] [Google Scholar]
- 7.Stroszczynski C, Jost D, Reichardt P, et al. Follow-up of gastro-intestinal stromal tumours (GIST) during treatment with imatinib mesylate by abdominal MRI. Eur Radiol. 2005;15:2448–56. doi: 10.1007/s00330-005-2867-x. [DOI] [PubMed] [Google Scholar]
- 8.Shankar S, van Sonnenberg E, Desai J, Dipiro PJ, Van Den Abbeele A, Demetri GD. Gastrointestinal stromal tumor: new nodule-within-a-mass pattern of recurrence after partial response to imatinib mesylate. Radiology. 2005;235:892–8. doi: 10.1148/radiol.2353040332. [DOI] [PubMed] [Google Scholar]
- 9.Eisenhauer EA, Therasse P, Bogaerts J, et al. New response evaluation criteria in solid tumours: revised RECIST guideline (version 1.1) Eur J Cancer. 2009;45:228–47. doi: 10.1016/j.ejca.2008.10.026. [DOI] [PubMed] [Google Scholar]
- 10.Therasse P, Arbuck SG, Eisenhauer EA, et al. New guidelines to evaluate the response to treatment in solid tumors. Breast Cancer. 2005:1216–27. [Google Scholar]
- 11.Choi H, Charnsangavej C, de Castro Faria S, et al. CT evaluation of the response of gastrointestinal stromal tumors after imatinib mesylate treatment: a quantitative analysis correlated with FDG PET findings. AJR Am J Roentgenol. 2004;183:1619–28. doi: 10.2214/ajr.183.6.01831619. [DOI] [PubMed] [Google Scholar]
- 12.Choi H, Charnsangavej C, Faria SC, et al. Correlation of computed tomography and positron emission tomography in patients with metastatic gastrointestinal stromal tumor treated at a single institution with imatinib mesylate: proposal of new computed tomography response criteria. J Clin Oncol. 2007;25:1753–9. doi: 10.1200/JCO.2006.07.3049. [DOI] [PubMed] [Google Scholar]
- 13.Antoch G, Kanja J, Bauer S, et al. Comparison of PET, CT, and dual-modality PET/CT imaging for monitoring of imatinib (STI571) therapy in patients with gastrointestinal stromal tumors. J Nucl Med. 2004;45:357–65. [PubMed] [Google Scholar]
- 14.Prior JO, Montemurro M, Orcurto MV, et al. Early prediction of response to sunitinib after imatinib failure by 18F-fluorodeoxyglucose positron emission tomography in patients with gastrointestinal stromal tumor. J Clin Oncol. 2009;27:439–45. doi: 10.1200/JCO.2008.17.2742. [DOI] [PubMed] [Google Scholar]
- 15.Van den Abbeele AD, Badawi RD. Use of positron emission tomography in oncology and its potential role to assess response to imatinib mesylate therapy in gastrointestinal stromal tumors (GISTs) Eur J Cancer. 2002;38(Suppl 5):S60–5. doi: 10.1016/S0959-8049(02)80604-9. [DOI] [PubMed] [Google Scholar]
- 16.Blay JY, von Mehren M, Blackstein ME. Perspective on updated treatment guidelines for patients with gastrointestinal stromal tumors. Cancer. 2010;116:5126–37. doi: 10.1002/cncr.25267. [DOI] [PMC free article] [PubMed] [Google Scholar]
- 17.Reichardt P, Blay JY, Mehren M. Towards global consensus in the treatment of gastrointestinal stromal tumor. Expert Rev Anticancer Ther. 2010;10:221–32. doi: 10.1586/era.09.171. [DOI] [PMC free article] [PubMed] [Google Scholar]
- 18.Gayed I, Vu T, Iyer R, et al. The role of 18F-FDG PET in staging and early prediction of response to therapy of recurrent gastrointestinal stromal tumors. J Nucl Med. 2004;45:17–21. [PubMed] [Google Scholar]
- 19.Sandrasegaran K, Rajesh A, Rushing DA, Rydberg J, Akisik FM, Henley JD. Gastrointestinal stromal tumors: CT and MRI findings. Eur Radiol. 2005;15:1407–14. doi: 10.1007/s00330-005-2647-7. [DOI] [PubMed] [Google Scholar]
- 20.Kaneta T, Takahashi S, Fukuda H, et al. Clinical significance of performing 18F-FDG PET on patients with gastrointestinal stromal tumors: a summary of a Japanese multicenter study. Ann Nucl Med. 2009;23:459–64. doi: 10.1007/s12149-009-0257-1. [DOI] [PubMed] [Google Scholar]
- 21.Da Ronch T, Modesto A, Bazzocchi M. Gastrointestinal stromal tumour: spiral computed tomography features and pathologic correlation. Radiol Med. 2006;111:661–73. doi: 10.1007/s11547-006-0064-x. [DOI] [PubMed] [Google Scholar]
- 22.Lee MW, Kim SH, Kim YJ, et al. Gastrointestinal stromal tumor of the stomach: preliminary results of preoperative evaluation with CT gastrography. Abdom Imaging. 2008;33:255–61. doi: 10.1007/s00261-007-9253-x. [DOI] [PubMed] [Google Scholar]
- 23.Bechtold RE, Chen MY, Stanton CA, Savage PD, Levine EA. Cystic changes in hepatic and peritoneal metastases from gastrointestinal stromal tumors treated with Gleevec. Abdom Imaging. 2003;28:808–14. doi: 10.1007/s00261-003-0021-2. [DOI] [PubMed] [Google Scholar]
- 24.Dudeck O, Zeile M, Reichardt P, Pink D. Comparison of RECIST and Choi criteria for computed tomographic response evaluation in patients with advanced gastrointestinal stromal tumor treated with sunitinib. Ann Oncol. 2011;22:1828–33. doi: 10.1093/annonc/mdq696. [DOI] [PubMed] [Google Scholar]
- 25.Schramm N, Schlemmer M, Englhart E, et al. Dual energy CT for monitoring targeted therapies in patients with advanced gastrointestinal stromal tumor: initial results. Curr Pharm Biotechnol. 2011;12:547–57. doi: 10.2174/138920111795164066. [DOI] [PubMed] [Google Scholar]
- 26.Goerres GW, Stupp R, Barghouth G, et al. The value of PET, CT and in-line PET/CT in patients with gastrointestinal stromal tumours: long-term outcome of treatment with imatinib mesylate. Eur J Nucl Med Mol Imaging. 2005;32:153–62. doi: 10.1007/s00259-004-1633-7. [DOI] [PMC free article] [PubMed] [Google Scholar]
- 27.Heinicke T, Wardelmann E, Sauerbruch T, Tschampa HJ, Glasmacher A, Palmedo H. Very early detection of response to imatinib mesylate therapy of gastrointestinal stromal tumours using 18fluoro-deoxyglucose-positron emission tomography. Anticancer Res. 2005;25:4591–4. [PubMed] [Google Scholar]
- 28.Goldstein D, Tan BS, Rossleigh M, Haindl W, Walker B, Dixon J. Gastrointestinal stromal tumours: correlation of F-FDG gamma camera-based coincidence positron emission tomography with CT for the assessment of treatment response–an AGITG study. Oncology. 2005;69:326–32. doi: 10.1159/000089765. [DOI] [PubMed] [Google Scholar]
- 29.Holdsworth CH, Badawi RD, Manola JB, et al. CT and PET: early prognostic indicators of response to imatinib mesylate in patients with gastrointestinal stromal tumor. AJR Am J Roentgenol. 2007;189:W324–30. doi: 10.2214/AJR.07.2496. [DOI] [PubMed] [Google Scholar]
- 30.Stroobants S, Goeminne J, Seegers M, et al. 18FDG-positron emission tomography for the early prediction of response in advanced soft tissue sarcoma treated with imatinib mesylate (Glivec) Eur J Cancer. 2003;39:2012–20. doi: 10.1016/S0959-8049(03)00073-X. [DOI] [PubMed] [Google Scholar]
- 31.Amano M, Okuda T, Amano Y, Tajiri T, Kumazaki T. Magnetic resonance imaging of gastrointestinal stromal tumor in the abdomen and pelvis. Clin Imaging. 2006;30:127–31. doi: 10.1016/j.clinimag.2005.09.025. [DOI] [PubMed] [Google Scholar]
- 32.Tang L, Zhang XP, Sun YS, et al. Gastrointestinal stromal tumors treated with imatinib mesylate: apparent diffusion coefficient in the evaluation of therapy response in patients. Radiology. 2011;258:729–38. doi: 10.1148/radiol.10100402. [DOI] [PubMed] [Google Scholar]
- 33.Benjamin RS, Choi H, Macapinlac HA, et al. We should desist using RECIST, at least in GIST. J Clin Oncol. 2007;25:1760–4. doi: 10.1200/JCO.2006.07.3411. [DOI] [PubMed] [Google Scholar]
- 34.Blay JY, Bonvalot S, Casali P, et al. Consensus meeting for the management of gastrointestinal stromal tumors. Report of the GIST Consensus Conference of 20–21 March 2004, under the auspices of ESMO. Ann Oncol. 2005;16:566–78. doi: 10.1093/annonc/mdi127. [DOI] [PubMed] [Google Scholar]
- 35.DeMatteo RP, Lewis JJ, Leung D, Mudan SS, Woodruff JM, Brennan MF. Two hundred gastrointestinal stromal tumors: recurrence patterns and prognostic factors for survival. Ann Surg. 2000;231:51–8. doi: 10.1097/00000658-200001000-00008. [DOI] [PMC free article] [PubMed] [Google Scholar]
- 36.Horton KM, Juluru K, Montogomery E, Fishman EK. Computed tomography imaging of gastrointestinal stromal tumors with pathology correlation. J Comput Assisted Tomogr. 2004;28:811. doi: 10.1097/00004728-200411000-00014. [DOI] [PubMed] [Google Scholar]
- 37.Trent JC, Ramdas L, Dupart J, et al. Early effects of imatinib mesylate on the expression of insulin-like growth factor binding protein-3 and positron emission tomography in patients with gastrointestinal stromal tumor. Cancer. 2006;107:1898–908. doi: 10.1002/cncr.22214. [DOI] [PubMed] [Google Scholar]
- 38.Young H, Baum R, Cremerius U, et al. Measurement of clinical and subclinical tumour response using [18F]-fluorodeoxyglucose and positron emission tomography: review and 1999 EORTC recommendations. European Organization for Research and Treatment of Cancer (EORTC) PET Study Group. Eur J Cancer. 1999;35:1773–82. doi: 10.1016/S0959-8049(99)00229-4. [DOI] [PubMed] [Google Scholar]
- 39.Chen G, Ma DQ, He W, Zhang BF, Zhao LQ. Computed tomography perfusion in evaluating the therapeutic effect of transarterial chemoembolization for hepatocellular carcinoma. World J Gastroenterol. 2008;14:5738–43. doi: 10.3748/wjg.14.5738. [DOI] [PMC free article] [PubMed] [Google Scholar]
- 40.Demetri GD, Heinrich MC, Fletcher JA, et al. Molecular target modulation, imaging, and clinical evaluation of gastrointestinal stromal tumor patients treated with sunitinib malate after imatinib failure. Clin Cancer Res. 2009;15:5902–9. doi: 10.1158/1078-0432.CCR-09-0482. [DOI] [PMC free article] [PubMed] [Google Scholar]


