Abstract
Pattern formation in development is a complex process which involves spatially distributed signals called morphogens that influence gene expression and thus the phenotypic identity of cells. Usually different cell types are spatially segregated, and the boundary between them may be determined by a threshold value of some state variable. The question arises as to how sensitive the location of such a boundary is to variations in properties, such as parameter values, that characterize the system. Here, we analyse both deterministic and stochastic reaction-diffusion models of pattern formation with a view towards understanding how the signalling scheme used for patterning affects the variability of boundary determination between cell types in a developing tissue.
Keywords: pattern formation, robustness, stochastic models
1. Introduction
1.1. Morphogenetic fields and positional information
The emergence of new cellular phenotypes during the development of organisms involves both the selection of a particular developmental pathway via transcription of one or more genes, and differentiation, which involves protein production and other downstream steps. Both processes are usually tightly coupled, and hereafter we simply speak of differentiation. Although differentiation is a cell-level process and can occur in isolated cells, our focus is on differentiation in a tissue containing many cells, and in particular, on how reliably the spatial location of the boundary between distinct cell types can be specified under various signalling schemes. Such spatially varying differentiation, or pattern formation, requires the appropriate spatial pattern of a transcription factor or other cellular state variable, and this pre-existing pattern or pre-pattern may be maternally inherited, it may stem from an earlier spatially controlled pattern of gene expression, or it may arise spontaneously within the tissue. Thus, pattern formation is a hierarchical process in which successive steps build on pattern formation in previous steps.
The local distribution of extracellular molecular species, mechanical stresses and other factors defines the morphogenetic landscape from which cells extract information, and frequently alter by release of components into the extracellular space. In the simplest case, diffusible molecules called morphogens, a term coined by Turing [1], affect the internal state in a concentration-dependent manner. More precisely, morphogens are defined as secreted signalling molecules that: (i) are produced in a tissue, frequently in a restricted region; (ii) are transported by diffusion [2], active transport, relay mechanisms or other means within the tissue [3]; (iii) are detected by specific receptors or bind to regulatory regions of DNA; and (iv) initiate an intracellular signal transduction cascade that initiates or terminates the expression of target genes in a concentration-dependent manner. The concept of a morphogenetic landscape, usually described as a developmental field similar to the classical fields in physics, played a role throughout the early history of theoretical work in pattern formation [4,5]. When morphogens are the carriers of the extracellular state, the morphogenetic landscape usually varies smoothly in space, but the response to an established pre-pattern may require conversion of a smoothly varying extracellular signal into a step-like response via some downstream mechanism.
The establishment of pattern from spatial homogeneity is called Turing's problem [1], which is to specify mechanisms under which an aggregate of cells, all initially in similar states, undergoes a well-defined spatial pattern of differentiation leading to a non-uniform distribution of cell types. In Turing's model, two or more morphogens react within each cell and diffuse between cells. All cells are assumed to be identical initially, and under appropriate boundary conditions, the reaction–diffusion equations that describe the model have a solution that is spatially uniform. What Turing showed is that this uniform state can be unstable to some non-uniform disturbances if the kinetic interactions and the diffusion constants are chosen appropriately. Such instabilities, which Turing called symmetry breaking, can lead to a steady or a time-periodic non-uniform distribution of morphogens. The unstable wavelengths are fixed by the kinetic coefficients and the diffusivities, and therefore each unstable system has an intrinsic chemical wavelength. Thus, identical systems will give rise to an identical distribution of morphogens and, via an appropriate interpretation mechanism, to an identical pattern of cell differentiation. Turing himself suggested that the model could account for the regular spacing of tentacles on Hydra and that it might be applicable to phyllotaxis. Many generalizations and applications of the model have been proposed [6–9].
Turing's original model may be well-suited for explaining mosaic development, in which removal of a part of a developing embryo at one stage results in the absence of that part in later stages, but it is less successful in predicting the degree of resilience or robustness of patterning in response to changes in the size of an organism, the strength of inputs or the values of the many parameters involved in signal transduction and gene control networks. Some degree of regulation for simple patterns can be achieved using simple reaction–diffusion models, as will be shown later, but more complex schemes are often needed. One approach is to postulate that the kinetic and transport coefficients are space-dependent to reflect the past history of development. This is certainly in the direction of greater biological reality because, as Turing himself observed, ‘Most of an organism, most of the time, is developing from one pattern into another, rather than from homogeneity into a pattern’ [1]. What remains in doubt is whether the mechanism in its original form, which generates pattern via an instability of a uniform state, is applicable to biological systems. Whatever the ultimate status of Turing's theory as a mechanism of biological pattern formation may be, it has both stimulated a tremendous amount of research and strongly influenced how spatial pattern formation in biology is understood by emphasizing the important role of the interaction between reaction and diffusion.
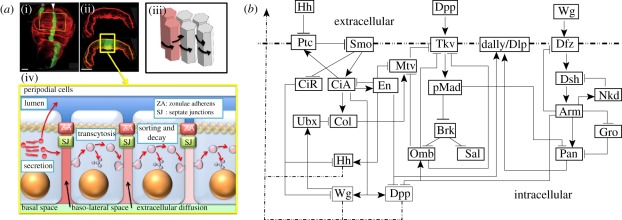
Another widely studied class of morphogen-based models are those in which morphogen production is spatially localized. These are often called positional information (PI) models, in that a cell must ‘know’ its position relative to other cells in order to adopt the correct developmental pathway [10], but they could also be called pre-pattern models, as the next stage of patterning is predicated on gene expression or morphogen production in a previous stage. In practice, in both Turing's model and most PI models, the system is usually regarded as an initially spatially homogeneous medium, transport is described by Fick's law, and cell–cell communication is indirect via secretion into the extracellular space, followed by re-uptake by a variety of mechanisms. However, previous rounds of patterning may establish spatial variations in the expression of various signalling molecules, as in dorsal–ventral patterning in the Drosophila embryo [11], and there are several other modes of cell–cell communication that may play a role [12]. Detailed models of endo- and exocytosis have not been included in this context, for this is a formidable task, as suggested by an example of the Drosophila wing disc shown in figure 1a. The signalling networks in the disc add another level of complexity to the geometric complexity, as shown in figure 1b. The principle morphogens are hedgehog (Hh), decapentaplegic (Dpp) and wingless (Wg), and one sees that each of the primary pathways has feedback loops and cross interactions with other pathways. In particular, there is a negative feedback loop in each of the three: through Ptc–Smo–CiA–Ptc in the Hh pathway, through Tkv–pMad–Brk–Omb–Tkv in the Dpp pathway and through Dfz–Dsh–Arm–Dfz in the Wg pathway. The complexity in the interactions of the different transport and signalling processes is frequently hidden when interpreting experimental data, because the spread of morphogens is analysed using a simple reaction–diffusion system [13]. However, it is usually difficult to relate the individual steps in what may be a very complex process to such a high-level description, and homogenization of the disc so as to preserve the relevant biochemical and mechanical interactions at the cell level is beyond reach at present.
Figure 1.
(a) Patterning of epithelial cells in the Drosophila wing imaginal disc by Dpp. (i) Top view showing the pouch and (ii) a slice along the midline in (i) showing the geometry of the columnar cells. (iii,iv) Patterning involves several reaction and transport processes that affect the Dpp distribution, including diffusion around columnar cells (iii) or transcytosis through columnar cells (iv) (reproduced with permission from Othmer et al. [12]). (b) Primary components in the signalling network for wing disc patterning. Ptc, patched; Smo, smoothened; CiA(R), cubitus interruptus activator (repressor); Ubx, ultrabithorax; Col, collier; Dfz, Drosophila frizzeled; Dsh, dishevelled; Nkd, naked; Gro, groucho; Pan, pangolin.
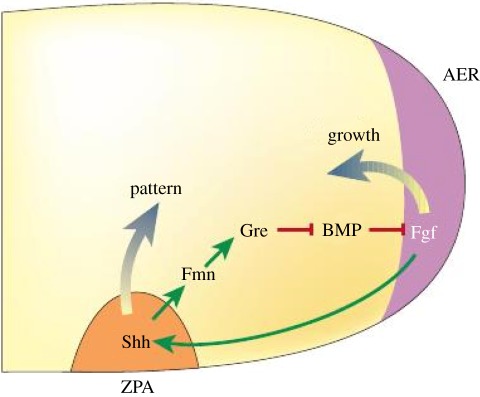
The most widely studied type of pre-pattern for morphogen signalling involves specialized spatial regions that are either maternally specified or determined in previous patterning steps, and that produce morphogen and release it into the extracellular space. The morphogen is then either actively or passively transported throughout the tissue, to be interpreted locally by cells according to their position in the morphogenetic landscape. We call the interpretation of the morphogen distribution the response. Here, we treat it as a scalar variable that depends on both morphogen levels and other factors that turn specified genes on or off, and this dependence is encoded in the response functional. We call the combination of one or more specified morphogen sources and a downstream interpretation mechanism a signalling scheme. This is a generalization of the motif concept used in studying networks [14], in that the same motif may be used either in combination with different morphogen sources or different response functionals. Our objective is to analyse how different signalling schemes affect the sensitivity, the precise measure of which is defined later, of the spatial location of a specified response level to parametric changes. An example of a signalling scheme that arises in the early development of vertebrate limbs is shown in figure 2. This example is more complicated than those we analyse later, but it illustrates the interplay of the spatial location of morphogen sources and the network of the downstream interactions, a theme that will recur throughout. Some of the effects of morphogen interactions in limb bud development have been analysed [16], but a much more systematic approach along the lines developed later is needed. A more detailed discussion of related issues in pattern formation appears in the study of Othmer et al. [12].
Figure 2.
The signalling scheme used in development of the vertebrate limb. A morphogen produced in the zone of polarizing activity (ZPA) is part of a feedback loop that controls production of growth factors in the apical ectodermal ridge (AER), which in turn affects production of the morphogen. The intermediate steps, which are not shown in detail, involve formin (Fmm), gremlin (Gre), bone morphogenetic protein (BMP) and fibroblast growth factor (Fgf). Reproduced with permission from Freeman [15]. Shh, sonic hedgehog.
1.2. The dynamic versus static interpretation of morphogen levels
The first species known to serve as a morphogen in the foregoing sense is Bicoid, a protein that is produced from maternally inherited mRNA embedded in the anterior 20 per cent of the plasma membrane of the embryo [17]. Bicoid is a transcription factor that initiates a hierarchy of sequential gene expression that involves the gap genes, the pair-rule genes and ultimately, the segment polarity genes [12]. In the early stages, the embryo is a syncytium with nuclei spread throughout the cytoplasm, but later the nuclei are embedded in the surrounding membrane. Bicoid production in the anterior portion of the embryo gives rise to a spatial distribution of the protein [18], and since the earliest gap gene expression occurs about 1.5 h after egg deposition, the question arises as to whether the Bicoid gradient is essentially at steady state at this time. Others have addressed this issue [19–21], but some important aspects deserve re-examination. In the remainder of this section, we analyse how reaction and diffusion interact to determine the time scale for relaxation to the steady-state distribution, and we show how to track the propagation of a chosen concentration level into the domain. With regard to the latter, we show that depending on the signalling scheme, the position of a threshold level of morphogen may first overshoot its location in the steady state and then retreat. With regard to the former, we show that the relaxation time to the steady state is given by:1
| 1.1 |
Table 1.
Symbols and their definitions.
| symbol | meaning |
|---|---|
| c | morphogen concentration |
| t | time variable |
| x | space variable |
| k | morphogen decay rate |
| K | reference concentration used for non-dimensionalization |
| L | length of the domain |
| 𝒟 | morphogen diffusion constant |
| j | morphogen input flux |
| u = c/K | dimensionless morphogen concentration |
| ξ = x/L | dimensionless space variable |
| τ = kt | dimensionless time variable |
| δ2 = 𝒟/(kL2) | dimensionless diffusion constant |
| J = jL/(K𝒟) | dimensionless input flux |
| T1 | the time scale for relaxation to the steady-state |
| ℛ | the symbol for the response functional that determines the response to a morphogen gradient. Its definition depends on the signalling scheme |
| ∇ | the gradient operator |
| Δ | the Laplace operator =∇ · ∇ |
| Vn | the normal velocity of a level set |
| nc | the unit normal to a level set |
From this, one sees that either diffusion or morphogen decay can dominate the relaxation process, and their effect is additive. Furthermore, the contribution of diffusion decreases with a decrease in 𝒟 or an increase in L, while that of protein decay affects the time similarly. Estimates of the half-life of Bicoid range from approximately 8 min [22] to less than approximately 30 min [21], and we use 20 min as an intermediate estimate, and thus k = 0.05 min−1. Estimates of the diffusion coefficient range upward from 0.3 µm2 s−1 [21], and thus for the lowest 𝒟 and an embryo length of L = 500 µm, the relaxation time of the slowest decaying mode is approximately 20 min, and is determined almost solely by the degradation rate. If the foregoing estimate of k is accurate, then there are several half-lives of the slowest mode in the approximately 1.5 h period from egg-laying to appearance of gap gene expression in cycle 10 [23], and one can assume that the Bicoid gradient has stabilized at this time.
The simplest model for describing the spatial distribution of Bicoid protein is based on a one-dimensional spatial domain, with protein synthesis localized at the anterior pole, transport by diffusion throughout the syncytium and a uniform protein decay rate. While this model is over-simplified and the system is more complex in reality, for instance, with respect to the localization of protein synthesis [17,22], it serves as a model that illustrates the underlying concepts. The governing equations for the time-dependent morphogen concentration c, assuming that transcription, and hence the influx of Bicoid, is turned on at t = 0, describe the evolution of the concentration of the morphogen owing to the effects of reaction and diffusion in the interior of the domain, combined with conditions that describe the influx at the anterior pole and the fact that there is no loss of morphogen at the posterior pole.
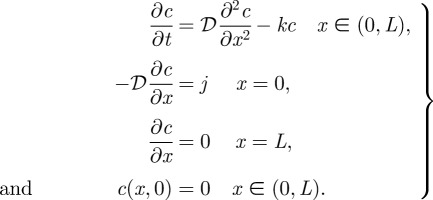 |
1.2 |
It is not difficult to relax the assumption that the mRNA is localized at the anterior pole by adding a space-dependent source to the right-hand side of equation (1.2) and setting j = 0, and this has been done by Little et al. [17].
We convert these equations to dimensionless form by defining ξ = x/L, τ = kt, δ2 = 𝒟/(kL2), J = jL/(K𝒟) and u = c/K, where K is specified later. Then the equations become:
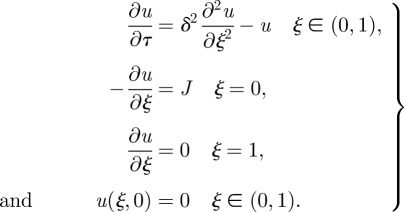 |
1.3 |
The steady-state solution satisfies
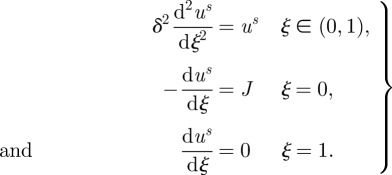 |
1.4 |
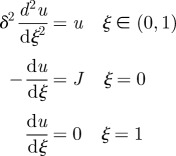
The solution of this is
 |
1.5 |
From this solution, one sees that the spatial decay of the morphogen gradient is governed by  , which involves the ratio of a kinetic time scale Tk ≡ k−1 to a diffusion time scale Td ≡ L2/𝒟. Thus, reducing the kinetic scale by reducing the half-life of the morphogen, or increasing the diffusion time scale by decreasing the diffusion constant, leads to sharper, more rapidly decreasing spatial profiles. While it is sometimes assumed that this combination also controls the approach to the steady state, we see from equation (1.1) that this is not the case. It should also be noted that the second term in both the numerator and denominator of equation (1.5) arises from the finite length of the domain, and can only be neglected if δ ≪ 1.
To derive the expression in equation (1.1) for the time scale for approach to the steady state, we observe that the difference w ≡ u − us, which captures the transient component of the solution, satisfies equation (1.3) with J = 0 and w(ξ, 0) = −us (ξ). The solution of the resulting system is:
 |
1.6 |
wherein the constants an are determined by the steady-state solution. The exponential decay rates λn are given by:
| 1.7 |
and the smallest of these, λ1, defines the relaxation time of the slowest decaying mode cos(πξ) in the transient solution. The reciprocal of this is a dimensionless relaxation time, and converting it to dimensional form leads to equation (1.1). As stated earlier, one can conclude that there is adequate time for establishment of the Bicoid gradient in Drosophila, even if the half-life of Bicoid is 30 min.
There is also adequate time for stabilization of the morphogen distribution in other systems. For example, in the Drosophila wing disc, the patterning occurs over several days, but the profile of the dominant morphogen Dpp is established in about 8 h [24]. However, in some systems, particularly those involving feedback in the early steps in signal transduction, the pattern of gene expression evolves significantly in time. In dorsal–ventral patterning of the Drosophila embryo, the downstream factor pMad is first expressed in a broadly distributed, low-level pattern, and later sharpens dramatically to localize patterning of the amnioserosa [25], and this has been explained with a model based on a positive feedback loop that controls production of a protein that acts as a co-receptor [11,26].
Of course, this does not mean that gene expression does not begin until the spatial distribution of the morphogen stabilizes. When the local morphogen concentration is time-varying, the downstream response may be determined by the instantaneous or time-delayed morphogen concentration, there may be no response until the absolute or integrated signal exceeds a certain level, or the response may adapt in time and thus require a minimal rate of change of the signal [27]. In many cases, the morphogen production is switched on at time zero, and it is of interest to determine how fast the concentration of morphogen rises at any given spatial location. In the context of Drosophila anterior-posterior (AP) patterning, gene expression probably begins as soon as a critical concentration is exceeded, which implies that one should observe a Bicoid-initiated wave of Hunchback expression that propagates down the AP axis. We analyse this for general systems here by computing the speed of propagation of surfaces of constant concentration (level sets) in reaction–diffusion systems. We do this for any spatial dimension, and thus the level sets can be curved and their curvature will affect the speed of propagation.
First consider a slight generalization of (1.2) written as:
| 1.8 |
and suppose that a level set c ≡ c0 = constant is defined by specifying the position vector r(t) of any point on the surface. Then an observer moving with that surface sees no change, which means that the Lagrangian derivative of c evaluated on that surface vanishes, i.e:
 |
Here, the normal vector to the surface and the speed in the normal direction are defined as:
and all terms are evaluated at c = c0. By definition, the normal is directed towards decreasing c levels. Therefore, if |∇c| ≠ 0, then:
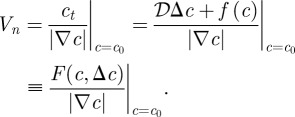 |
1.9 |
Obviously, Vn > 0, whenever ct is positive, and either or both Vn and |∇c| vanish on the set, where F vanishes, i.e. where c has reached a steady state. Furthermore, one sees that the speed of propagation increases with the magnitude of ct and decreases with the steepness of the gradient. Thus, level sets in a shallow gradient propagate faster than those in a steep gradient, and the most striking example of this is the infinite speed of propagation of the zero level set in a pure diffusion process. For a scalar equation, the velocity is of one sign during the approach to a steady state, but this need not be true in systems, as discussed below. The asymptotic speed of travelling waves of permanent form on infinite domains is well-understood [28], but the profiles of interest here are not of constant shape.
In general, the response will be more complex—for example, gene expression may be a nonlinear function of the morphogen level, or it may involve both positive and negative control. We discuss an extension of the foregoing to two species, but it can easily be done in general. Suppose that the two morphogens (c1,c2) evolve according to
 |
1.10 |
and suppose that the response is given by ℛ(c1,c2). Further suppose that the threshold response corresponds to the level set ℛ = ℛ* = constant. As before, this surface moves according to
If ℛ depends on both species then:
 |
and if ∇ℛ ≠ 0 then:
 |
1.11 |
From this, one sees that it is easy to construct response functionals for which the threshold level set overshoots its steady-state position. Suppose, for instance, that the spatial domain is one-dimensional, that f(c1,c2) = −c1, g(c1,c2) = −κc2, and that2
| 1.12 |
Thus, c1 is an activator of the response, and we assume that there is an input flux of c1 at x = 0, while c2 acts as an inhibitor and is input at x = L. If both inputs are switched on at t = 0, and if c1 relaxes to its steady-state distribution much faster than c2 does, the rapid establishment of the c1 profile will initiate a response in some portion of the domain, but as c2 gradually increases, the threshold level set movement will reverse and move towards x = 0. One can see this most easily by supposing that c1 reaches steady state instantaneously. Examples in which there is overshoot are known from systems in which there is negative feedback via morphogen-stimulated production of a receptor [29,30]. Other signalling schemes are possible—e.g. it may also happen that the response involves two activators produced at opposite ends of the domain, and numerical examples of both activator/inhibitor and dual-activator systems are given later.
The response in equation (1.12) may apply to AP patterning in Drosophila, in which we identify the morphogens as Bicoid and Nanos, and the response as Hunchback expression. A similar analysis can be applied to downstream steps in the gene expression hierarchy in AP patterning, and it is known for instance that the spatial domains of gap gene expression shift as development proceeds [31]. This system and others will require other forms of the response functional, and these may have multiple components, such as ℛ1 ≥ ℛ1* and ℛ2 ≥ ℛ2*, but the foregoing approach applies in general.
1.3. Resilience, robustness and reliability in patterning
The overall process of development, including pattern formation, differentiation, growth and the other developmental processes, can usually tolerate a certain level of disturbances encountered during development and yet produce a normal adult, and we say that such systems regulate. There are many examples of this, particularly at early stages of development. For instance, each of the cells that results from the first cleavage in amphibian eggs can, when separated from the other, develop into a normal, albeit smaller, adult. Certainly, this type of regulation requires some form of intercellular communication and some kind of feedback mechanism, whereby removal of part of an organism is sensed by the remainder, and development is redirected to compensate for the part removed. Here, we focus on less-drastic perturbations, and begin by defining some terminology.
Robustness, resilience and reliability all capture, to varying degrees, the idea that systems can develop ‘normally’ under certain types of perturbations. In computer science, robustness refers to the ability of a programme to cope with errors in inputs or calculations during execution, and this best describes the notion that systems can regulate in the sense used previously. Consider a dynamical system of the form
| 1.13 |
where u is the state, Φ a set of parameters and S(t) an input. This form is sufficiently general to encompass the reaction–diffusion equations described earlier when u is an element of a suitable Banach space, and equation (1.13) is viewed as an evolution equation in that space, but the reader can, without loss of understanding, regard equation (1.13) as an evolution equation for a finite number of state variables.
We can identify at least three classes of perturbations that lead to three types of robustness.
— Robustness with respect to changes in model parameters, constant inputs, and so on. One biologically important example in this class is robustness with respect to changes in the size of the system. A general class of reaction–diffusion systems that show perfect scale-invariance is known [32], and a detailed study of scale-invariance in various patterning mechanisms will be reported elsewhere [33]. This type of robustness can be measured by a suitably defined sensitivity of the response, examples of which are given later.
— Robustness with respect to transient changes in the input S(t). By this, we mean that changes in time-dependent external inputs only evoke a transient response, but constant offsets in the input are ignored in the long run. Such systems nullify changes in a specified class of inputs by generating the inputs internally and employing suitable feedback to nullify them [34]. In particular, this includes the capability of systems to respond only to transient changes in inputs, and to ignore time-independent inputs.
— Robustness with respect to changes in the structure of the equation itself. Systems that are robust in this sense can withstand the inclusion of a new component in a signal transduction pathway without significantly altering the input–output behaviour of the system. For small changes in the equation, this is described by the mathematical concept of coarseness or structural stability—a vector field is structurally stable if its associated flow is orbit equivalent to the flow generated by any vector field in a sufficiently small neighbourhood in a suitable topology [35]. A global criterion for structural stability is known for linear vector fields in finite dimensions, but only local results are known for nonlinear finite-dimensional systems, and therefore cannot be used for large changes.
Several general strategies for reducing sensitivity to perturbations include: (i) operation at saturation, which implies that changes in input have no effect; (ii) employment of suitable feedback mechanisms to compensate for changes in inputs; and (iii) employment of a hierarchical system, such as that which terminates in the segment polarity genes in Drosophila.
In the remainder of this paper, we focus on the robustness of the location of boundaries between different emerging cell types in a developing tissue under perturbations in boundary inputs and parameters. As we have already seen, if the boundary is set by a prescribed threshold value of a response functional, then in general it moves during establishment of the morphogen profiles. In the following section, we analyse deterministic systems, and in the penultimate section, we analyse stochastic systems. In both cases, the primary focus is on a static or stationary-in-time interpretation of the response—the dynamic case will be treated elsewhere. We identify a number of distinct types of spatial signalling schemes and analyse the robustness of boundary placement under these distinct schemes.
2. The robustness of boundary placement in deterministic models
2.1. The French flag problem
In the simplest version of a PI or pre-pattern model, either specialized source and sink cells located at the boundary of the developmental field maintain the concentration of the morphogen at fixed levels, or they produce or destroy the morphogen at a fixed rate. If there is no degradation of morphogen in the first case, then given fixed thresholds between different cell types, a one-dimensional system can be proportioned into any number of cell types in a perfect scale-invariant way. However, this scheme is clearly not robust as it stands, since the flux between source and sink in a one-dimensional system of length L scales as 1/L, and thus the morphogen-producing or consuming cells at the boundary must adjust production to adjust for the size of the system.
For the second scheme, we consider the simple signalling scheme analysed earlier, in which the flux at the boundary, rather than the concentration, is fixed. The steady-state solution given by equation (1.5) is characterized by the dimensionless parameter δ that involves the ratio of a kinetic time scale Tk ≡ k−1 to a diffusion time scale Td ≡ L2/𝒟, and the dimensionless parameter Jδ, which we write as:
 |
2.1 |
This is the ratio of a time scale Trd defined by reaction and transport within the domain, to the time scale Ti defined by the scaled input KL/j. The parameter δ enters in the shape function ϕ via the exponential terms and determines how rapidly the morphogen concentration decays in space: if Tk≪Td, then δ ≪ 1 and the solution decays rapidly from its value at the source. It is clear that for a fixed input flux j, both the amplitude and the shape of the morphogen distribution depend on L, and thus this simple scheme does not suffice when significant variations in length occur in the developing system. Perfect shape-invariance could be achieved by modulating 𝒟 or k appropriately [32], but robustness with respect to the input flux requires a more sophisticated scheme as it requires that the ratio in equation (2.1) remains constant. More complex patterning driven by pre-patterns can result when there are several specialized boundary regions, an example of which arises in vertebrate limb development, where species produced in specialized regions called the zone of polarizing activity and the apical ectodermal ridge interact for direct outgrowth and patterning [16,36]. Several simple schemes that illustrate some of the effects of multiple inputs are analysed later.
2.2. Sensitivity of thresholds in a static interpretation
As stated earlier, our focus in the remainder of the paper is on the robustness of determination of the boundary between cell types in a developing tissue, and in the remainder of this section, we focus on deterministic models. We first develop a general method for computing one measure of the sensitivity of the location of a threshold to parametric changes. The measure we adopt is simply the derivative of the threshold location to a chosen parameter, but since the governing equations are typically nonlinear, this must be done numerically. A number of specific examples are analysed in detail in the following subsections.
Suppose that the equations for the local dynamics—binding reactions, enzyme-catalysed steps, and so on—are written as the system
| 2.2 |
where now u ∈ ℝn represents the dimensionless concentrations and other state variables, while Φ represents parameters and inputs that we treat as constants. For a spatially distributed system, we write the steady-state equations as:
 |
2.3 |
where 𝒟 is now an n × n matrix of dimensionless diffusion constants, and B incorporates the fluxes at the boundary. We assume that this has a unique solution and differentiate (2.3) with respect to Φ to obtain
 |
2.4 |
If there are q parameters in Φ, then uΦ is an n × q matrix.
Now suppose that the boundary between cell types is determined by a threshold value of a particular component ui, or by a functional (a scalar-valued function) of the solution. The latter might, for example, be the condition that an activator is above a certain level and the inhibitor is below a certain level. As before, let ℛ(u) denote the response, and define ℛ* as the threshold response. Then at a steady state, the level set that corresponds to this threshold defines a set in space—a point in one dimension, a curve in two dimensions or a surface in three dimensions—on which the response is at the threshold. On one side of this point, curve or surface—depending on the space dimension—the response is above threshold, while on the other side it is below threshold. This level set is defined implicitly by the relation:
| 2.5 |
where ξ* is the spatial coordinate on the level set. Let p be one of the entries of Φ; then by differentiating equation (2.5) with respect to the chosen parameter, we obtain the following relation:
for the sensitivity:
of the threshold position. Here 〈·,·〉 denotes the Euclidean inner product, and to simplify the formulae, we use subscripts to denote partial derivatives.
Therefore, if 〈ℛu, ∇u〉 ≠ 0,
 |
2.6 |
One sees from equation (2.6) that two components, given by the numerator and the denominator, contribute to the sensitivity, and increasing the latter reduces the sensitivity of the threshold location. If 〈ℛu, uξ〉 = 0, then ξp* is indeterminate at this order.
When the response is a function of only one species, equation (2.6) reduces to:
| 2.7 |
and therefore the derivative ℛu cancels, and as a result for any response function that depends on only one factor or species, the sensitivity ξp* of a threshold location to a parameter p is independent of the sensitivity ℛu of the response functional to the concentration u.
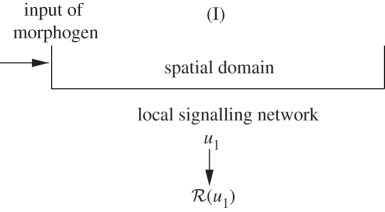
Thus, no matter how complicated the internal signal transduction mechanism may be, if the overall input-response behaviour is as shown in scheme I of table 2, i.e. the downstream response to a morphogen depends only on that morphogen, then the sensitivity of the location of any threshold level is independent of the sensitivity of the response functional to the morphogen level. This is a very strong conclusion, but of course, the actual location of the threshold does depend on ℛ.
Table 2.
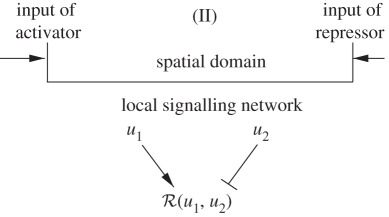
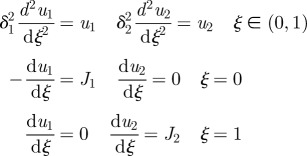
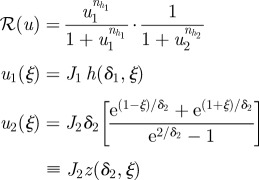
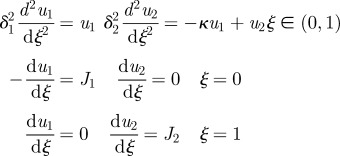
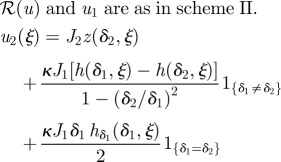
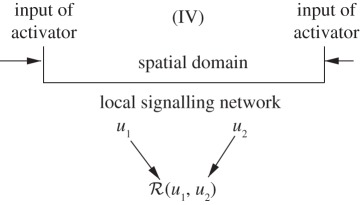
The signalling schemes in the deterministic analysis. (The left column gives the signalling scheme, the center column gives the governing equations, and the third column gives the response functional for that signalling scheme. The notation 1a is equal to 1 if the condition a is true, and zero if it is false.)
| signalling scheme | governing equations | response functional |
|---|---|---|
 |
 |
 |
 |
 |
 |
 |
 |
 |
 |
the governing equations are as in scheme II |  |
2.2.1. The single morphogen scheme
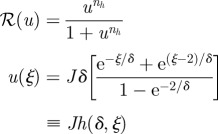
Consider the scalar, steady-state problem analysed earlier whose solution is given in equation (1.5). Suppose that the response is defined as:
and that the threshold is set at ℛ* ∈ (0,1). This defines the first scheme I in table 2. For simplicity, let us assume that the reaction time Tk is short enough when compared with diffusion time Td, so that δ is small. With this assumption, the boundary at x = L has a negligible effect. Then:
 |
2.8 |
and
 |
2.9 |
In particular, if ℛ* = 0.5, then u* = 1 and
Thus, ξδ* is one when Trd = Ti, and otherwise depends on the relative size of these time scales. It only vanishes if ln(Jδ) = −1, but then ξ* lies outside the domain. Therefore, one cannot guarantee robust placement of the boundary location under changes in the ratio of the time scales defined by δ. Since  , sensitivity with respect to the input flux is decreased by decreasing the diffusion coefficient or increasing the degradation rate or the input flux. One also sees that in either case, the location of the threshold and its sensitivity with respect to parameters are independent of nh for ℛ* = 0.5, and therefore of the steepness of the response at the chosen threshold. However, this is not true for other choices of the threshold, as equation (2.9) shows. Calculation of the sensitivities of the location with respect to the measurable quantities such as the diffusion coefficient or the input flux requires one additional step.
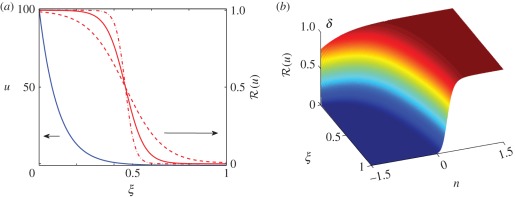
We consider scheme I as a base case for later comparison with other signalling schemes. For this purpose, we compute the response and the location of the boundary numerically for several thresholds, and for a range of input fluxes and δ, using the exact solution of the steady-state problem (1.5). It follows from equations (1.5) and (2.7) that (u)ξ < 0, (u)δ > 0 and (u)J > 0, and therefore the boundary position ξ* moves right as either δ or J are increased, as expected. The base parameters δ = 0.1 correspond to a half-life k−1 ∼ 20 min, a diffusion coefficient 𝒟 = 1 µm2 s−1 and a domain length of length L = 100 µm. Using a reference concentration K = 0.1 µM, the base input flux j = K𝒟J/L corresponds to 600 molecules/(µm2 s−1). The morphogen profile and the response profile for these base values and three values of the Hill coefficient are shown in figure 3a, and the response surface as a function of δ is shown in figure 3b.
Figure 3.
(a) The morphogen profile (blue) and the response function (red) for scheme I, using the base parameters δ = 0.1, J = 103 and nh = 1,2 and 4. (b) The response surface as a function of δ and ξ, where δ = 10n−1.
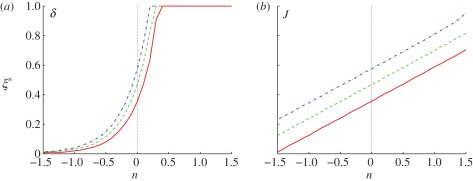
The computed threshold positions as a function of δ and J are shown in figure 4 for threshold levels of ℛ* = 0.25, 0.50, 0.75. As δ increases, the effect of diffusion time scale decreases relative to that of reaction. This leads to an increase in the morphogen concentration and the response throughout the domain, and therefore the threshold positions determined by the chosen thresholds move right, and for sufficiently large δ lie at the boundary (cf. figure 4a). An increase in the dimensionless input flux J has a similar but less dramatic effect—the morphogen concentration increases in direct proportion with J, as seen from equation (1.5), and thus the threshold location moves further into the domain. In either case, we can conclude that boundary placement under scheme I is not robust to variations in the dimensionless parameters δ or J.
Figure 4.
The spatial location of the specified thresholds as a function of (a) δ and (b) J for scheme I. The parameters are given by (a) δ = 10n−1 and (b) J = 10n+3 using the base set. Here and hereafter blue (dash-dot lines), green (dashed lines) and red (solid lines), denote thresholds ℛ* = 0.25, 0.5, 0.75, respectively.
For the base parameters and thresholds chosen, an increase in the Hill coefficient has little effect on the robustness, despite the fact that the response is sharpened (cf. figure 3a), because the morphogen gradient is steep for the chosen thresholds in the response. However, an increase in nh has a significant effect at lower thresholds, but the effect of this for a wider parametric range remains to be investigated. Of course, other forms of single-morphogen response functions may lead to different conclusions, but would require some biological motivation.
2.2.2. Signalling schemes with independent activation and inhibition
There are numerous other more complex signalling schemes used in pattern formation, several of which are shown in table 2. The next simplest is the one in which a morphogen that initiates activation of gene transcription is produced at one end of the domain, while an inhibitory signal that represses transcription is produced at the other end, as shown in scheme II of the table. In this scheme, there is no upstream interaction between the morphogens, and they exert their effect on the response independently. The Bicoid–Nanos–Hunchback system, in which Bicoid activates expression of Hunchback, whereas Nanos represses it [37], is an example of this signalling scheme.
Since the morphogens do not interact, the activating signal, denoted u1, is as in the previous example with δ and J replaced by δ1 and J1. Denote by u2 the dimensionless concentration of the inhibitory morphogen, and suppose that this morphogen is produced at ξ = 1. Detailed governing equations for u1 and u2 are given in table 2.
The response function is chosen to be:
 |
2.10 |
where the nhis represent the respective Hill coefficients. This form arises, for example, when activating and inhibiting transcription factors bind independently to a promoter [38]. We choose the same thresholds as before and let η* denote the spatial position corresponding to a threshold, i.e. ℛ(u(η*)) = ℛ*. In addition, we let ξ* be the spatial location of the threshold when u2 = 0, in which case the response in scheme II reduces to that in scheme I. When u2 ≠ 0, ℱ2|ξ=η* < 1 and it follows from the fact that ℱ1|ξ = ξ* = ℱ1 · ℱ2|ξ =η* = ℛ* and the monotonicity of ℱ1 that ξ* > η*. In other words, adding an inhibitor lowers the overall response level and retains a decreasing response gradient with the maximum level at the source location of the activator, as in scheme I. Therefore, the boundary location determined by the threshold moves towards the source of the activator, as expected.
In figure 5, we show the effect of changes in the δis when both are equal. When both are small (n < 0), the location of the threshold increases with δi, as in figure 4. However, owing to the effect of the inhibitor, the threshold location in figure 5 is generally closer to the activator source than it is in figure 4. On the other hand, when both exceed the base value n = 0, the threshold locations rapidly move towards ξ = 0, and for sufficiently large δi, the thresholds are never reached. This can be understood in terms of the competing processes involved. As the δis are increased, the effect of diffusion relative to degradation increases and the level of both the activator and the inhibitor increases. When both δis are small, the level of both the activator and the inhibitor are low, ℱ1 ≪ 1 and ℱ2 ≪ 1 in equation (2.10), and the effect of the increased activator on the response is larger than that of the increased inhibitor. As a result, the location of the threshold moves towards the source of the inhibitor. When δ1 = δ2 is large, the level of both the activator and the inhibitor is larger, ℱ1 ≈ 1 and ℱ2 ≈ 1 in equation (2.10), and as a result, the effect of the increased inhibitor on the response dominates and the location of the threshold moves towards the source of the activator. The effect of varying the input fluxes simultaneously is less dramatic—in each case, the threshold position first moves outwards from ξ = 0 and then gradually retreats. Simultaneous variation in the Hill coefficients of activator and inhibitor has little effect on the threshold locations.
Figure 5.
The threshold location as a function of δ for equal δi s in scheme II. Here Ji = 103 and nhi = 1.
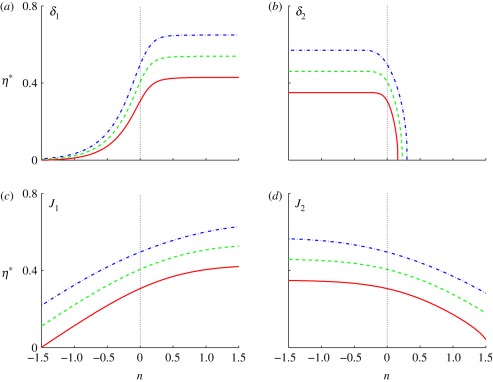
The effects are quite different when the δs are varied independently, as shown in figure 6. At fixed δ2, increasing δ1 moves the threshold outwards from ξ = 0, similar to both the single morphogen and the symmetric activator–inhibitor cases. However, for n > 0, the threshold location stabilizes because the activation is saturated and the response is determined by the inhibitor, which accounts for the plateau. The transition value of δ1 for different thresholds is essentially independent of the threshold. Similarly, when δ2 is sufficiently small, the effect of the activator dominates and the threshold location is independent of δ2. In fact, the results in figure 5 can be understood as the diagonal slice of a three-dimensional representation of the top panels in figure 6.
Figure 6.
The signalling scheme with asymmetric activator and inhibitor. The parameter that varies is indicated on each panel, (a,b) δi = 10n−1 and (c,d) Ji = 10n+3 and the base parameters are δ1 = δ2 = 0.1, J1 = J2 = 103, and nhi = 1.
The effect of the input fluxes is less pronounced, as seen in figure 6. The threshold positions are shifted towards ξ = 0, as inclusion of the inhibitor lowers the level of response slightly, and for small values of J1 they increase approximately linearly, as in figure 4. However, the effect of the inhibitor limits the increase as activation saturates, and the cumulative effect is less over the full range. Similarly, the effect of the inhibitor flux is weak at low inputs but stronger at high inputs, and the thresholds are moved significantly leftwards towards the activator source owing to the lower level of response as we increase J2. The Hill coefficients of activator and inhibitor have little effect on the boundary positions determined by the thresholds because the gradients of activator and inhibitor are quite steep.
Thus, the inclusion of an independently acting inhibitor can significantly reduce the sensitivity of threshold locations to variations in the dimensionless parameters δi in suitable ranges, and thus lead to robustness of the placement of the boundary between cell types. The large values of δ1 needed for fixed values of the remaining parameters can be achieved by increasing the diffusion coefficient or the half-life of the activator, and inversely for smaller values of δ2. However, this signalling scheme does not lead to precise boundary location in the face of variations in the input fluxes.
2.2.3. The incoherent feedforward network
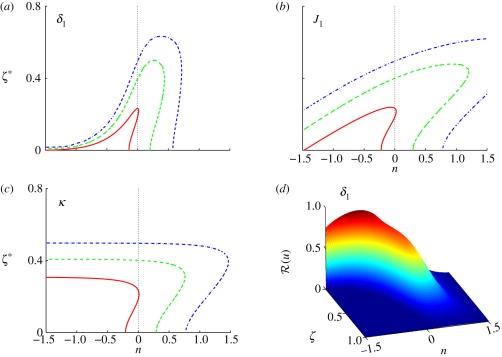
The question then arises as to whether upstream interactions between activator and inhibitor can increase the robustness. As an example, we add production of the inhibitor catalysed by the activator, as shown in scheme III of table 2, to the previous network. As the additional production of the inhibitor increases its level throughout the domain, the boundary location ζ* corresponding to the threshold ℛ*, which is implicitly defined by ℛ(u(ζ*)) = ℛ*, moves towards the activator source, i.e. ζ* < η*.
The introduction of a catalytic effect of the activator on the inhibitor leads to some different effects under variation of some parameters. The variation of the threshold with δ1 shown in figure 7 is qualitatively similar to that in the symmetric case shown in figure 5, although the maxima for lower thresholds are displaced to larger n. However, the effect of increases in the input flux of activator is very different. At small values of J1, the variation of the threshold is similar to that shown in figure 6, but for large J1, the higher level of activator induces more inhibitor and the threshold level sets intersect ζ* = 0. Thus, depending on n, one has either a super-threshold region from 0 to an upper value of ζ, or an interior super-threshold region, surrounded by sub-threshold regions near each boundary.
Figure 7.
The signalling scheme using activator-catalysed production of the inhibitor. (a,b) Both the parameter variations and the base parameters are as before. (c) The variation of the threshold position with the catalytic production rate for κ = 10n−2 and (d) the dependence of the response function on δ1.
The variation of the threshold position with δ2 and J2 is less dramatic and similar to that shown in figure 6, except for a slight decrease in the overall response level. On the other hand, the catalytic parameter also has a significant effect. As shown in figure 7, for small values of κ (n < 0), boundary positions are insensitive as expected, as this reduces to a previous signalling scheme with independent activation and inhibition, but if κ is sufficiently large, the inhibitor effect dominates and the threshold eventually retracts to ζ = 0 because of a lower level of response. However, between the low and high values lies a region in which there are threshold crossings, which again leads to an interior region of gene expression.
2.2.4. A dual-activator signalling scheme
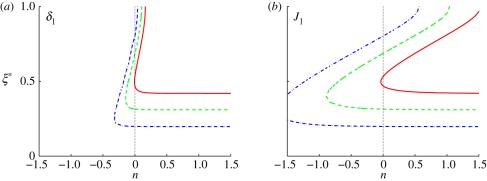
In the final example of the deterministic analysis, we suppose that both morphogens are activators and thus both enhance the response, as shown in scheme IV of table 2. Since activators are produced at both ends and both must be sufficiently large to produce a super-threshold response, one expects activation in a band, the sharpness of which should be determined by the Hill coefficients. The completely symmetric case (equal inputs, equal decay lengths and equal Hill coefficients) is easiest to analyse, but a parametric study in the case of unequal parameters for the two morphogens reveals some interesting effects. The results for variations in δ1 and J1 are shown in figure 8, and the results for the second pair are similar, relative to ξ = 1.
Figure 8.
The signalling scheme with two activators: (a) δ1 = 10n−1 and (b) J1 = 10n+4. The base values of the parameters are δ1 = δ2 = 0.1, J1 = J2 = 104 and nhi = 1.
In figure 8, we divide the loci for ξ* into two parts, the upper, increasing part of the curve, and the lower, flat part of the curve, and denote them by ξu* and ξl*. At n = 0, the system is symmetric and the results in figure 8 reflect this, but as δ1 is increased, the concentration of u1 increases rapidly pointwise, and the left-most boundary (smallest ξ*) for ℛ* = 0.25 stabilizes at ξl* = ∼0.2 for n > ∼− 0.25, and similarly for other thresholds. However, the upper boundary ξu* increases rapidly with δ1, and reaches 1 for n small and positive, and beyond this value, the interval (ξl*, 1] is above threshold and thus is turned ‘on’.
The results are qualitatively similar as J1 is varied. The location of the boundary for the lowest threshold is essentially fixed over the entire range of J1 shown, whereas the upper boundary increases approximately log-linearly. Thus, the location of the lower boundary of the activated region is relatively insensitive for a wide range of both the dimensionless diffusion rate δ1 and the dimensionless input flux J1, more so for the latter than the former, but the upper boundary moves as either parameter is varied, rapidly in the case of δ1 and more slowly in the case of J1.
3. The robustness of threshold positions in stochastic models
3.1. Static interpretation for simple systems
Stochastic effects can play an important role in gene expression and spatial pattern formation in development if key components are present in low copy numbers. For example, gene transcription in some bacteria involves interactions between one to three promoter elements and 10–20 copies of repressor proteins [39], while in dorsal-ventral patterning of Drosophila, it is known that Dpp signalling increases from a low basal rate to the maximal rate in the range of 10−10 to 10−9 M [40], and at these concentrations, there are on average fewer than 10 signalling molecules per nucleus. As chemical reactions occur in discrete steps at the molecular level, the processes are inherently stochastic and the inherent ‘irreproducibility’ in these dynamics has been demonstrated experimentally for single cell gene-expression events [41,42]. However, in general, organisms show a remarkable degree of resilience or robustness in the face of noise, and thus understanding the dynamics of a system of interacting species and how noise influences the outcome is important in numerous contexts.
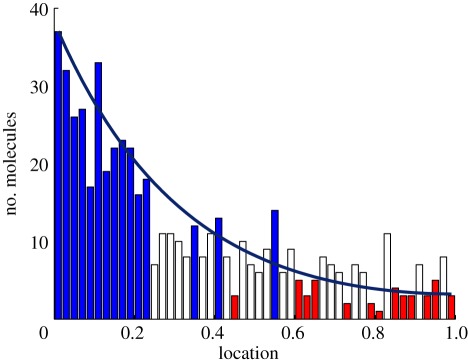
To illustrate the importance of fluctuations owing to small numbers of molecules, consider the French flag problem discussed earlier. Figure 9 shows one realization of a stochastic model of a linear chain of cells in which the input flux is fixed at the left. The solid line shows the mean of the distribution, which can be computed directly as the equations are linear [43]. This curve also represents the steady-state distribution for the corresponding deterministic system. Since each developing embryo represents one realization of the stochastic patterning process, the results illustrate the difficulty in determining the location of the boundaries between cell types in the face of such fluctuations. Clearly, fluctuations will be significant, and how the embryos cope with them to pattern reliably is not understood. Thus, it is important to determine how the structure of the signalling scheme, which involves both the spatial arrangement of morphogen sources and the structure of the signal transduction network, affects the outcome. Of course, the spatial variation of morphogens adds a new level of complexity to the problem, and raises the question as to what the role of diffusion is in filtering the noise. It certainly removes rapidly varying spatial components, and this has the effect of removing high-frequency components in inputs. In this section, we focus on the effect of different types of spatial signalling schemes on the fluctuations in the boundary location.
Figure 9.
One realization of the French flag model with stochastic dynamics, shown at 100 min. The system comprises 50 compartments, each 1 × 0.01 × 0.01 mm3, the diffusion coefficient is 1000 μm2 min−1, the influx from a source at the left end is at a rate 0.1 nM μm min−1, and diffusion and degradation occur at a rate of 0.01 min−1. Each compartment has 10 morphogen molecules initially. Colour indicates the thresholds: blue, greater than 12; white, greater than six molecules; red, less than or equal to six.
To eliminate the ‘salt-and-pepper’ effect seen in figure 9, cells must adopt the right type for their spatial location with a high probability, and this leads to the criterion defined later for the precision of boundary location. As before, if a functional of the morphogen level in a cell is above a threshold value, we assume that the cell becomes type I, and otherwise, it becomes type II. The first objective is to determine how different response functionals couple with gradient-formation mechanisms to determine the probability that the cell adopts one of two types. At the multicellular level, we expect that the domain can be divided into different regions, in some of which the cells have a high probability to be of type I and in others, the cells have a high probability of becoming type II. We define a type I domain as one in which the cells have a probability greater than 0.5 of being of type I, and we therefore choose as the boundary between regions of different types the locus on which the probability is approximately 0.5. As shown below, this criterion can be used to understand how different response functionals affect the robustness of boundary location. A one-dimensional compartmentalized system with two simple signalling schemes is used to illustrate the major ideas and conclusions.
3.1.1. The single activator scheme
We first analyse the stochastic version of scheme I described in table 2. Assume that the system is of length L, that the morphogen is injected at the left end and that the opposite end is impermeable. The morphogen undergoes degradation at a rate k throughout the system and diffuses with diffusion coefficient 𝒟. We discretize the system into ν identical compartments and assume that morphogen production occurs in the first compartment as a Poisson process of rate s. We denote by Ni the number of morphogen molecules in the ith compartment, and then the stationary distribution of (N1, N2, … , Nν) is given as:
 |
3.1 |
where Mi is the mean number of molecules in the ith compartment at the steady state [43,44].
We first calculate M = (M1, M2, … , Mν) to determine the mean, and then we define the response functional and use the stationary distribution to study the boundary location. The mean concentrations M = (M1, M2, … , Mν) satisfy the difference equation:
| 3.2 |
where  is as defined previously, Iν is the ν × ν identity matrix, Sν = (s/k,0, … , 0)′ and Δν is the ν × ν matrix:
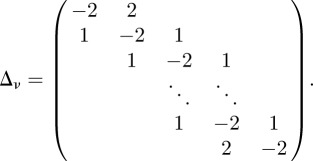 |
If we discretize the one-dimensional domain in equation (1.4) into ν intervals using centred differences, and let ci be the morphogen concentration in the ith interval, then:
| 3.3 |
where Jν = (2jν/(kL), … , 0)T. Therefore, for consistency between the descriptions we must have:
where 𝒩𝒜 is Avagadro's number and V is the volume of a compartment.
The solution of (3.2) is then given by:
 |
where αj is the jth eigenvalue of Δν and 𝒫j is the corresponding projection of Δν. There are no nilpotents in this representation because Δν is semisimple, but the eigenvalues and eigenvectors must be computed numerically.
3.1.2. The stationary distribution of the cell types
As in the deterministic analysis, we scale the signal level so that the half-maximal response in the Hill function is at u = 1. Thus, if there are ni morphogen molecules in the ith compartment, the response is:
 |
3.4 |
where ui = ni/Ω and Ω ≡ 𝒩𝒜 · K · V. Let ℛ* be the threshold value and let u* be the corresponding concentration, which is given by equation (2.8). Then the probability that the ith compartment is of type I is the marginal cumulative distribution:
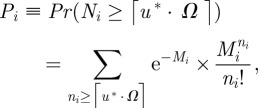 |
3.5 |
where ⌈u* · Ω⌉ is the smallest integer greater than or equal to u* · Ω. This is obtained by summing over all but the ith factor in equation (3.1) and using the fact that the sums are one.
Since Pi increases with Mi, and the latter is monotone decreasing with i, we define the boundary as the smallest i such that Pi < 0.5. To define the cell type, we define the discrete random variable Θi as:
 |
Thus Θi is a Bernoulli random variable and
 |
Therefore, E(Θi) is the expectation that the ith compartment is of type I and Var(Θi) measures the spread in the types of the ith compartment around the expectation. The variance is largest for Pi = 0.5, as a reasonable definition of the boundary between cell types requires.
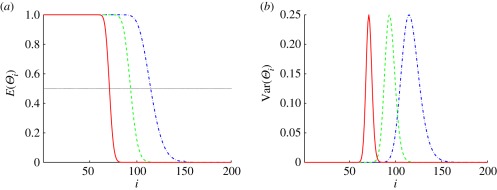
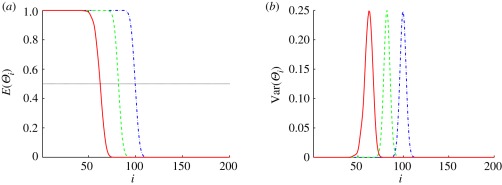
To illustrate how E(Θi) and Var(Θi) depend on the threshold, which determines u*, we show E(Θi) and Var(Θi) as a function of the compartment number in the one-dimensional system in figure 10. In figure 10a, one sees that E(Θi) is close to one on the left-most part of the system and drops rapidly to zero towards the right-hand boundary of the system for both ℛ* = 0.5 and 0.75. Using these thresholds, the system can be divided into two regions: in region (I), most of the compartments are of type I, and in region (II), most of the compartments are of type II. Correspondingly, Var(Θi) is almost zero in the interior of the two regions, but larger at the boundary between them, as expected. E(Θi) varies more slowly and the variance has broader support when the threshold is set at ℛ* = 0.25, as is to be expected, since the threshold lies in a region where the morphogen distribution varies more slowly.
Figure 10.
The mean and variance of the random variable that determines the cell types in in the stochastic version of scheme I. The x-axis is the number of the compartment. In this figure and in figure 11, we use the base values ν = 200, L = 400 µm, V = 2 µm ×0.3 µm × 0.3 µm, 𝒟 = 1 µm2 s−1, K = 0.2 µM, k = 6.25 × 10⁻⁴ s−1,  and J = jL/(K𝒟) = 103 in the calculation. As in the deterministic analysis, red solid lines correspond to ℛ* = 0.75, dashed green lines correspond to ℛ* = 0.5 and dash-dot blue lines correspond to ℛ* = 0.25.
Thus, we can conclude that setting a higher threshold response in the single-activator system produces a better localization of the boundary between cell types by increasing the steepness of the Pi distribution and thereby decreasing the width of the variance distribution. This conclusion will hold for any number of thresholds, as long as they have the same functional form of the response at each threshold. However, there are known examples in which the functional form itself changes depending on the morphogen level, e.g. by activating at one level and inhibiting at another, and the analysis has to be extended for such systems.
Since u* is given by equation (2.8), one sees that if ℛ* < 0.5, increasing the Hill coefficient nh in the response function increases u*, which moves the boundary location towards the activator source and attenuates the fluctuations in the determination of cell types. Conversely, if ℛ* > 0.5, increasing nh amplifies the fluctuations in the determination of cell types. Therefore, as stated in the deterministic section, the effect of increasing the Hill coefficient on the precision of the determination of cells types depends on whether ℛ* is larger or less than 0.5. Furthermore, as u* > ℛ*, the boundary location defined by using the Hill function is closer to the activator source than that defined by using the morphogen level directly, and therefore passing the fluctuating morphogen concentration through the nonlinear response filters the noise and reduces the spread of the variance in the determination of cell types.
To illustrate that the general conclusions concerning the dependence of the threshold location on parameters reached for the deterministic system also apply here, we show in figure 11 how the boundary location determined by Pi = 0.5 changes as the dimensionless diffusion coefficient δ and the dimensionless flux J are changed. For comparison with the deterministic model, we scale the compartment number from zero to one. Figure 11 shows that the dependence of the boundary location on J and δ is qualitatively the same as that in the deterministic model, but a more precise comparison will be made elsewhere.
Figure 11.
The variation of the boundary locations as the flux and dimensionless diffusion coefficient are varied in the stochastic version of scheme I. The y-axis is the compartment number normalized by 200 and the x-axis indicates the variation of the parameters. (a) δ = 10n−1, (b) J = 103+n.
Since ℛ* is a deterministic function of the morphogen level u, the consistency between the stochastic predictions (figure 11) and the deterministic predictions (figure 4) indicates that the deterministic model is sufficient to study the sensitivity of the boundary location to parameters if the downstream network is deterministic, or if it is stochastic but relaxes rapidly. As in the deterministic system, adjusting the threshold level can reduce the fluctuations in the determination of cell types, and using Hill functions to define the downstream response rather than the morphogen level can also be used to reduce the variation in the boundary location. Hill functions are widely used in gene control networks to capture the fast reactions between DNA and transcription factors, but a more detailed multi-scale stochastic analysis is needed to justify treating this step deterministically [45], especially as there are only a few copies of most genes.
3.1.3. The activator–inhibitor signalling scheme
Next, we consider the independent activator–inhibitor network (scheme II) in one space dimension, and as before, we discretize the system into ν identical compartments. The activating morphogen is produced in the first compartment with rate s1 and the inhibiting morphogen is produced in the νth compartment with rate s2. Parameters such as decay constants and diffusion rates are as defined in §2.2.2. Let N1,i and N2,i denote the random numbers of the activator morphogen molecules and the inhibitor morphogen molecules in the ith compartment, respectively. The stationary distribution of N1,i and N2,i can be derived as in the single-activator system. If there are n1,i activator molecules and n2,i inhibitor molecules in the ith compartment, the response of the ith compartment is defined as follows:
 |
where
Ωi ≡ 𝒩𝒜 · Ki · V and K1, K2, nh1 and nh2 are constants. Letting ℛ* be the threshold value, the probability of the ith compartment being of type I is:
 |
In this system, the threshold depends on both species and therefore we define the Bernoulli variable that determines the cell type as:
 |
and we show E(Θi) and Var(Θi) for the one-dimensional system in figure 12. As in figure 10, the one-dimensional system can be divided into two regions. In the type I region, E(Θi) is close to 1 and Var(Θi) is close to 0, while in the type II region both E(Θi) and Var(Θi) are close to 0. The boundary defined by the threshold Pi = 0.5 lies between these two regions. However, in contrast with the single-activator scheme, in figure 12, the distribution of the variance is much more concentrated for the two lowest thresholds, whereas in figure 10, Var(Θi) has broader support for ℛ* = 0.25. The deterministic analysis of the single-activator system predicts that the sensitivity of the location of the threshold is inversely proportional to the gradient of the morphogen (cf. equation (2.7)), and therefore one expects a broader distribution of the variance and larger fluctuations in the position for lower thresholds. In the activator–inhibitor system, the effect of the inhibitor is strongest where the activator concentration is lowest, and this sharpens the spatial distribution of the variance significantly. Thus, the addition of the inhibitor increases the precision with which the boundary between cell types is determined.
Figure 12.
The fluctuations in the determination of cell types in the activator–inhibitor signalling system. The x-axis is the compartment number. Here and in figure 13, the base parameters are ν = 200, L = 400 µm, V = 2 µm × 0.3 µm × 0.3 µm, 𝒟1 = 𝒟2 = 1 µm2 s−1, K1 = K2 = 0.2 µM, k1 = k2 = 6.25 × 10⁻⁴ s−1,  ,
,  , J1 = j1
L/(K1 𝒟1) = 103, J2 = j2
L/(K2 𝒟2) = 103, n1,h = 1 and n2,h = 1.
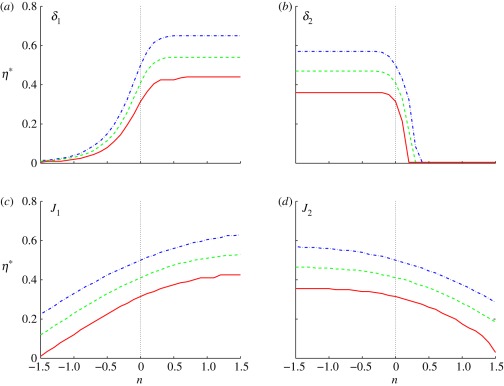
In figure 13, we show how the boundary location changes as the dimensionless flux and diffusion coefficients change. To be consistent with the deterministic model, we scale the compartment number from 0 to 1. Just as in the single-activator case (cf. figure 11), the dependence of the boundary location on J1, J2, δ1 and δ2 is qualitatively the same as that in the deterministic model. The addition of one inhibitor sharpens the signal gradient and reduces the fluctuations in the determination of cell types. Therefore, in addition to the downstream network, the upstream signalling scheme is very important for signal precision.
Figure 13.
The variations of the boundary locations as the (a,b) flux (δ1,δ2 respectively) and (c,d) dimensionless diffusion coefficient (J1,J2 respectively) are varied in the activator–inhibitor signalling system. The y-axis is the scaled compartment number and the x-axis indicates how we vary the parameters. (a) δ1=10n−2; (b) δ2=10n−2; (c) J1=10n+3; (d) J2=10n+3.
3.2. A model for activation of receptor production by morphogen-bound receptors
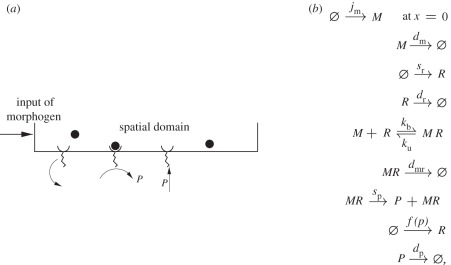
The final example is a one-dimensional system with morphogen produced at one end and a feedback loop catalysing the production of receptors throughout the domain (cf. figure 14a). This model is used to understand how the feedback loop couples with other reaction and diffusion processes to affect the precision of the boundary location. It provides a simplified description of systems such as the hedgehog-patched system illustrated in figure 1, which arises in pattern formation in the Drosophila wing disc and in the vertebrate limb. Denote by M, R, MR and P the morphogen, receptor, morphogen-bound receptor and downstream product protein, respectively, in the kinetic scheme shown in figure 14b.
Figure 14.
(a) The signalling scheme with positive feedback. (b) The kinetic mechanism.
Here, f(p) is a function of the concentration of the protein P that controls the production of the receptor R. Let m, r, mr and p denote the concentrations of M, R, MR and P at position x at time t, and assume that morphogen M diffuses throughout the system with diffusion coefficient 𝒟m. The governing deterministic equations of the system are as follows:
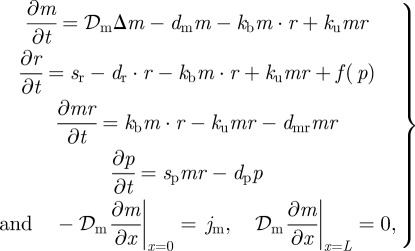 |
3.6 |
where
In the following simulations, we always begin with a zero initial concentration for all species.
Since the system is nonlinear, we cannot determine the morphogen profiles analytically, even in a stationary state, and we use the Gillespie stochastic simulation algorithm [46] to study the distribution of the boundary location numerically. Here, we consider a line of 25 compartments, where each compartment is a rectangular domain of dimension 0.3 µm × 0.3 µm ×3 µm. Morphogen M is produced in the first compartment, and the base values of parameters are as follows:
 |
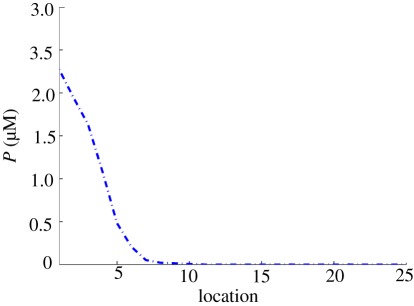
We use the level of the protein P as a surrogate for the response and therefore define the cell type by the concentration of P—if it is above K, the compartment is defined as type I; otherwise, it is defined to be type II. We use the compartment of type II that is closest to the source of M to define the boundary. Figure 15 shows the mean concentration profile of P, and from this, see that for the base values of the parameters the boundary is at the seventh cell.
Figure 15.
The mean concentration of P for the base values of all parameters.
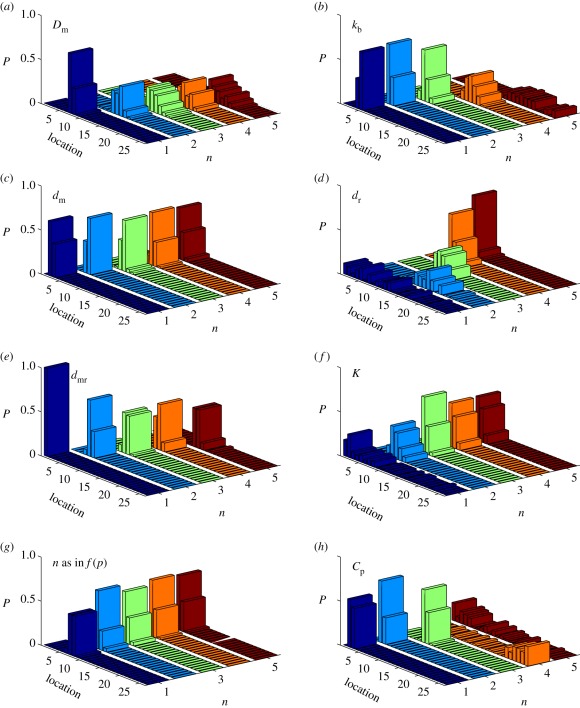
Simulations in which one parameter is varied and the remainder fixed show how the distribution of the boundary locations is affected by changes in the parameters. Figure 16a–c show the effect of changes in the parameters 𝒟m, kb and dm, which control diffusion, binding and decay, respectively, of free morphogen. Increasing 𝒟m or decreasing kb and dm flattens the profile of M and thereby shifts the mean outward and increases the spread of the variance in the distribution of boundary locations. The shift of the mean is most pronounced for 𝒟m, whereas the increase in the spread of the variance is most pronounced for changes in the on-rate kb. The latter stems from the fact that reducing kb increases the spread of the morphogen and decreases the production of P. However, decreasing dm does not affect the boundary location significantly, as can be seen in figure 16c, which indicates that the degradation rate of the free morphogen has little effect for the range considered.
Figure 16.
The distribution of the threshold locations with varying parameters. In (a) 𝒟m = (10n − 9) µm2 s−1; (b) kb = 7.15 ×101−n µM−1 s−1; (c) dm = 6.25 ×10−n s−1; (d), dr = 6.25 ×10−n s−1; (e), dmr = 6.9 ×101−n s−1; (f), K = 4.8 × 101−n μM; (g), n is the Hill coefficient in f(p); and (h), Cp = 1.1 ×10−n µM s−1.
Figure 16d shows that changing the degradation rate of the receptors has a much larger effect on the boundary location. For large dr (n = 1 in that panel), the location is widely distributed, but as dr decreases, the threshold location centres at around 15 for n = 2 and then decreases steadily as dr is decreased further. This can be understood by noting that as dr is decreased, the level of the receptors and the protein P increases, which thereby increases the feedback, and as a result, the boundary between cell types moves towards the source of the morphogen.
Decreasing the degradation or internalization rate dmr of bound receptors will lead to an increase in the level of bound receptors MR, and hence increase the level of P, which moves the location of the boundary away from the morphogen source, as one sees in figure 16e. When dmr is greater or equal to 6.9 s−1 (n = 1 in that panel), the signal density in all compartments is below the threshold value. When dmr is less than that (n ≥ 2), the signal density near the morphogen source is above the threshold value and the boundary location falls into the first few compartments near the source. The distribution of locations is relatively narrow for this parameter.
Figure 16f–h show how the parameters in the Hill function affect the distribution of the boundary location. One finds that when K ≤ 4.8 × 10⁻² µM, changing K and n does not change the profiles of P much (results not shown). Therefore, the distribution of the boundary location does not change much in figure 16f,g. When K = 4.8 µM (n = 1 in panel (f)), saturation in f(p) is never reached and the gradient in the profile of P is shallow and the distribution of boundary locations is broader. Similarly, as Cp decreases from 1.1 × 10⁻² to 1.1 × 10⁻⁴ µM s−1, the profile of P becomes flatter and the boundary location moves away from the morphogen source and becomes more broadly distributed. However, when Cp is less than 1.1 × 10⁻⁴ µM s−1, the level of receptors is small, the profile of P is low and almost flat, and the distribution of locations is very broad.
In conclusion, the effect of 𝒟m, dm and dmr on signalling is similar to their effect in the linear systems, while the effect of dr on the boundary location can be biphasic. Moreover, the effect of Cp can be much larger than those of K and n, as Cp determines the strength of the feedback loop.
4. Conclusions
Despite the fact that many have analysed the effect of noise on the location of a specified threshold morphogen level [47–50], how developing systems reliably partition a tissue into distinct cell types is still poorly understood. Here, we have shown, both by a deterministic and a stochastic analysis, how the number and location of morphogen sources and the downstream interpretation of the morphogen levels affect the precision with which the boundary between cell types can be determined.
In §1.2, we showed how level sets propagate in reaction–diffusion systems and suggested how dual morphogen systems can lead to advance and retreat of threshold levels, depending on how rapidly different morphogens relax to a quasi-steady state. This occurs only when several morphogens are involved, and may shed light on the observed variation in the positions of gap gene expression. This analysis may also provide further insight into the role of positive feedback in localizing gene expression in other systems [11].
While cells exposed to morphogens sample their environment continuously, the establishment of morphogen distributions is often sufficiently rapid when compared with the time scale of gene expression to justify a static analysis, as was done in §2.1. Our objective throughout was to understand how the placement of the morphogen source(s) and the type of interpretation function used as the response affect the location of specified level sets of the response. This analysis was only carried out in one dimension, but the general approach can be used in two or three dimensions as well. This approach requires both the determination of the level sets of the morphogen(s) and those of the response, and in the deterministic example studied here, there was no feedback from the downstream response to the signal transduction steps. This simplified the analysis, but the inclusion of feedback is important in many cases, and one example was studied in the stochastic analysis in §3.2.
We found that the sensitivity of the response, as measured by the Hill coefficient, has little effect on the robustness of threshold location when thresholds are set at levels at which the morphogen gradient is large, as predicted by the analysis of the single-activator system. However, in results not shown, we find that when the threshold is set at a level for which the morphogen profile varies slowly, the sensitivity of the response can have a large effect. Probably both mechanisms are used in different systems, but there is little quantitative data available on this. Using four simple examples with an activator and an inhibitor, we have shown how the boundary positions change as we vary parameter values. The least robust to changes in the dimensionless diffusion coefficient(s) and the dimensionless input flux(es) is the single activator system. Simply adding an inhibitor produced on the boundary opposite to the activator production can significantly improve the robustness with respect to the δi s, but the effect on the sensitivity with respect to input fluxes is less dramatic. The example using an incoherent feedforward network showed a very interesting effect, in that for certain parameters, the activated (above threshold) region lay in an interval interior to the domain (cf. figure 7). This can be understood by realizing that if the activator also catalyses production of the inhibitor, then the inhibitor will become large in regions of high activator and diminish the response.
In the stochastic framework, we developed a new and novel method for defining the boundary between cell types by appropriately quantizing the probability of exceeding a specified threshold in the number of a downstream molecule, and we have shown that the predictions are consistent with those of a deterministic model. We also analysed a positive feedback system and showed that the model predicts robustness with respect to certain parameters such as the diffusion coefficient (when small enough), the degradation rate of the ligand-free receptor and several parameters in the feedback function. As the stochastic analysis also predicts the variance in the underlying distribution, one can predict the variations in the location of the boundary between cell types. One important conclusion not obtained from the deterministic analysis is that the shape of the profile of E(Θi) is critical for the precision of determining the boundary between cell types, as E(Θi) determines Var(Θi) in our approach.
As an example of the stochastic effects in boundary determination, segment determination in Drosophila, which is governed by the expression of the pair-rule and segment polarity genes, is a quasi-one-dimensional process, in that it varies in the anterior–posterior direction. The network governing expression of the segment polarity genes is reasonably well understood and predicts robust boundary placement given the correct initial conditions [51,52]. Nonetheless, the location of the boundary of parasegments in adjacent lines of cells can vary at an earlier stage in which the pair-rule genes are expressed (figure 17), but detailed statistics of this variation have not been reported. The approach developed here could be used to predict the variations from the known network of pair-rule genes and those predictions compared with reported observations. Of course, the one- or two-step processes studied here (reading of either the morphogen directly or passing the signal through an interpretation function) will not be correct for these variations in boundary position, and further downstream mechanisms are needed. A second step may refine the initial location by interactions between adjacent rows of cells, either via cell sorting based on the expression of surface markers, or by subsequent changes in gene expression triggered by feedback circuits.
Figure 17.
Boundary formation owing to expression of pair-rule genes in Drosophila at an (a) early and (b) later stage. Blue, fushi tarazu; pink, even-skipped; and purple dots, engrailed. Reproduced with permission from Wolpert et al. [53].
Acknowledgments
This publication was based on work supported in part by NIH grant no. GM29123 and in part by award no. KUK-C1-013-04, made by the King Abdullah University of Science and Technology (KAUST), and by the Mathematical Biosciences Institute.
Footnotes
The definition of symbols used here and later are given in table 1.
Here we use the freedom to scale c1 and c2 so that the half-maximal values of both are 1.
References
- 1.Turing A. M. 1952. The chemical basis of morphogenesis. Phil. Trans. R. Soc. Lond. B 237, 37–72 10.1098/rstb.1952.0012 (doi:10.1098/rstb.1952.0012) [DOI] [Google Scholar]
- 2.Lander A. D., Nie Q., Wan F. Y. 2002. Do morphogen gradients arise by diffusion? Dev. Cell 2, 785–796 10.1016/S1534-5807(02)00179-X (doi:10.1016/S1534-5807(02)00179-X) [DOI] [PubMed] [Google Scholar]
- 3.Kerszberg M., Wolpert L. 1998. Mechanisms for positional signalling by morphogen transport: a theoretical study. J. Theor. Biol. 191, 103–114 10.1006/jtbi.1997.0575 (doi:10.1006/jtbi.1997.0575) [DOI] [PubMed] [Google Scholar]
- 4.Child C. M. 1941. Patterns and problems of development. Chicago, IL: University of Chicago Press [Google Scholar]
- 5.Oppenheimer J. M. 1967. Essays in the history of embryology and biology. Cambridge, MA: MIT Press [Google Scholar]
- 6.Gierer A., Meinhardt H. 1972. A theory of biological pattern formation. Biol. Cybernet. 12, 30–39 10.1007/BF00289234 (doi:10.1007/BF00289234) [DOI] [PubMed] [Google Scholar]
- 7.Meinhardt H. 1982. Models of biological pattern formation. London, UK: Academic Press [Google Scholar]
- 8.Othmer H. G. 1980. Dynamics of synergetic systems. In Synchronized and differentiated modes of cellular dynamics (ed. Haken H.), pp. 271 Berlin, Germany: Springer-Verlag [Google Scholar]
- 9.Cross M. C., Hohenberg P. C. 1993. Pattern formation out of equilibrium. Rev. Mod. Phys. 65, 851–1112 10.1103/RevModPhys.65.851 (doi:10.1103/RevModPhys.65.851) [DOI] [Google Scholar]
- 10.Wolpert L. 1969. Positional information and the spatial pattern of cellular differentiation. J. Theor. Biol. 25, 1–47 10.1016/S0022-5193(69)80016-0 (doi:10.1016/S0022-5193(69)80016-0) [DOI] [PubMed] [Google Scholar]
- 11.Umulis D. M., Serpe M., O'Connor M. B., Othmer H. G. 2006. Robust, bistable patterning of the dorsal surface of the Drosophila embryo. Proc. Natl Acad. Sci. USA 103, 11 613–11 618 10.1073/pnas.0510398103 (doi:10.1073/pnas.0510398103) [DOI] [PMC free article] [PubMed] [Google Scholar]
- 12.Othmer H. G., Painter K., Umulis D., Xue C. 2009. The intersection of theory and application in biological pattern formation. Math. Mod. Nat. Phenom. 4, 3–79 10.1051/mmnp/20094401 (doi:10.1051/mmnp/20094401) [DOI] [PMC free article] [PubMed] [Google Scholar]
- 13.Kicheva A., Pantazis P., Bollenbach T., Kalaidzidis Y., Bittig T., Julicher F., Gonzalez-Gaitan M. 2007. Kinetics of morphogen gradient formation. Science 315, 521–525 10.1126/science.1135774 (doi:10.1126/science.1135774) [DOI] [PubMed] [Google Scholar]
- 14.Alon U. 2007. An introduction to systems biology: design principles of biological circuits, vol. 10 Boca Raton, FL: CRC Press [Google Scholar]
- 15.Freeman M. 2000. Feedback control of intercellular signalling in development. Nature 408, 313–319 10.1038/35042500 (doi:10.1038/35042500) [DOI] [PubMed] [Google Scholar]
- 16.Dillon R., Othmer H. G. 1999. A mathematical model for outgrowth and spatial patterning of the vertebrate limb bud. J. Theor. Biol. 197, 295–330 10.1006/jtbi.1998.0876 (doi:10.1006/jtbi.1998.0876) [DOI] [PubMed] [Google Scholar]
- 17.Little S. C., Tkačik G., Kneeland T. B., Wieschaus E. F., Gregor T. 2011. The formation of the Bicoid morphogen gradient requires protein movement from anteriorly localized mRNA. PLoS Biol. 9, 1000596. 10.1371/journal.pbio.1000596 (doi:10.1371/journal.pbio.1000596) [DOI] [PMC free article] [PubMed] [Google Scholar]
- 18.Gregor T., McGregor A. P., Wieschaus E. F. 2008. Shape and function of the Bicoid morphogen gradient in dipteran species with different sized embryos. Dev. Biol. 316, 350–358 10.1016/j.ydbio.2008.01.039 (doi:10.1016/j.ydbio.2008.01.039) [DOI] [PMC free article] [PubMed] [Google Scholar]
- 19.Bergmann S., Sandler O., Sberro H., Shnider S., Schejter E., BZ B. Z. S., Barkai N. 2007. Pre-steady-state decoding of the Bicoid morphogen gradient. PLoS Biol. 5, e46. 10.1371/journal.pbio.0050046 (doi:10.1371/journal.pbio.0050046) [DOI] [PMC free article] [PubMed] [Google Scholar]
- 20.Umulis D. M. 2009. Analysis of dynamic morphogen scale-invariance. J. R. Soc. Interface 6, 1179–1191 10.1098/rsif.2009.0015 (doi:10.1098/rsif.2009.0015) [DOI] [PMC free article] [PubMed] [Google Scholar]
- 21.Grimm O., Coppey M., Wieschaus E. 2010. Modelling the Bicoid gradient. Development 137, 2253. 10.1242/dev.032409 (doi:10.1242/dev.032409) [DOI] [PMC free article] [PubMed] [Google Scholar]
- 22.Spirov A., Fahmy K., Schneider M., Frei E., Noll M., Baumgartner S. 2009. Formation of the Bicoid morphogen gradient: an mRNA gradient dictates the protein gradient. Development 136, 605–614 10.1242/dev.031195 (doi:10.1242/dev.031195) [DOI] [PMC free article] [PubMed] [Google Scholar]
- 23.Foe V. E., Odell G., Edgar B. 1993. Mitosis and morphogenesis in the Drosophila embryo: point and counterpoint. Dev. Drosophila melanogaster 1, 149–300 [Google Scholar]
- 24.Entchev E. V., Schwabedissen A., Gonzalez-Gaitan M. 2000. Gradient formation of the TGF-beta homolog Dpp. Cell 103, 981–991 10.1016/S0092-8674(00)00200-2 (doi:10.1016/S0092-8674(00)00200-2) [DOI] [PubMed] [Google Scholar]
- 25.Raftery L. A., Sutherland D. J. 2003. Gradients and thresholds: BMP response gradients unveiled in Drosophila embryos. Trends Genet. 19, 701–708 10.1016/j.tig.2003.10.009 (doi:10.1016/j.tig.2003.10.009) [DOI] [PubMed] [Google Scholar]
- 26.Wang Y. C., Ferguson E. L. 2005. Spatial bistability of Dpp-receptor interactions during Drosophila dorsal–ventral patterning. Nature 434, 229–234 10.1038/nature03318 (doi:10.1038/nature03318) [DOI] [PubMed] [Google Scholar]
- 27.Kutejova E., Briscoe J., Kicheva A. 2009. Temporal dynamics of patterning by morphogen gradients. Curr. Opin. Genet. Dev. 19, 315–322 10.1016/j.gde.2009.05.004 (doi:10.1016/j.gde.2009.05.004) [DOI] [PubMed] [Google Scholar]
- 28.Fife P. C. 1979. Mathematical aspects of reacting and diffusing systems. Lecture Notes in Biomathematics, vol. 28 Berlin, Germany: Springer [Google Scholar]
- 29.Dillon R., Gadgil C., Othmer H. G. 2003. Short- and long-range effects of sonic hedgehog in limb development. Proc. Natl Acad. Sci. USA 100, 10 152–10 157 10.1073/pnas.1830500100 (doi:10.1073/pnas.1830500100) [DOI] [PMC free article] [PubMed] [Google Scholar]
- 30.Nahmad M., Stathopoulos A. 2009. Dynamic interpretation of hedgehog signaling in the Drosophila wing disc. PLoS Biol. 7, e1000202. 10.1371/journal.pbio.1000202 (doi:10.1371/journal.pbio.1000202) [DOI] [PMC free article] [PubMed] [Google Scholar]
- 31.Jaeger J., et al. 2004. Dynamic control of positional information in the early Drosophila embryo. Nature 430, 368–371 10.1038/nature02678 (doi:10.1038/nature02678) [DOI] [PubMed] [Google Scholar]
- 32.Othmer H. G., Pate E. F. 1980. Scale invariance in reaction–diffusion models of spatial pattern formation. Proc. Natl Acad. Sci. USA 77, 4180–4184 10.1073/pnas.77.7.4180 (doi:10.1073/pnas.77.7.4180) [DOI] [PMC free article] [PubMed] [Google Scholar]
- 33.Umulis D., Othmer H. G. In press. Scale-invariance in spatial pattern formation in developing systems. Development [Google Scholar]
- 34.Sontag E. D. 2003. Adaptation and regulation with signal detection implies internal model. Syst. Control Lett. 50, 119–126 10.1016/S0167-6911(03)00136-1 (doi:10.1016/S0167-6911(03)00136-1) [DOI] [Google Scholar]
- 35.Arnold V. I., Levi M. 1988. Geometrical methods in the theory of ordinary differential equations, vol. 250 Berlin, Germany: Springer [Google Scholar]
- 36.Niswander L., Jeffrey S., Martin G. R., Tickle C. 1994. A positive feedback loop coordinates growth and patterning in the vertebrate limb. Nature 371, 609–612 10.1038/371609a0 (doi:10.1038/371609a0) [DOI] [PubMed] [Google Scholar]
- 37.Simpson-Brose M., Treisman J., Desplan C. 1994. Synergy between the Hunchback and Bicoid morphogens is required for anterior patterning in Drosophila. Cell 78, 855–865 10.1016/S0092-8674(94)90622-X (doi:10.1016/S0092-8674(94)90622-X) [DOI] [PubMed] [Google Scholar]
- 38.Tyson J. J., Othmer H. G. 1978. The dynamics of feedback control circuits in biochemical pathways. Progr. Theor. Biol. 5, 1–62 [Google Scholar]
- 39.Kuthan H. 2001. Self-organisation and orderly processes by individual protein complexes in the bacterial cell. Prog. Biophys. Mol. Biol. 75, 1–17 10.1016/S0079-6107(00)00023-7 (doi:10.1016/S0079-6107(00)00023-7) [DOI] [PubMed] [Google Scholar]
- 40.Shimmi O., O'Connor M. B. 2003. Physical properties of Tld, Sog, Tsg and Dpp protein interactions are predicted to help create a sharp boundary in BMP signals during dorsoventral patterning of the Drosophila embryo. Development 130, 4673–4682 10.1242/dev.00684 (doi:10.1242/dev.00684) [DOI] [PubMed] [Google Scholar]
- 41.Spudich J. L., Koshland D. E. 1976. Non-genetic individuality: chance in the single cell Nature 262, 467–471 10.1038/262467a0 (doi:10.1038/262467a0) [DOI] [PubMed] [Google Scholar]
- 42.Levsky J. M., Singer R. H. 2003. Gene expression and the myth of the average cell. Trends Cell. Biol. 13, 4–6 10.1016/S0962-8924(02)00002-8 (doi:10.1016/S0962-8924(02)00002-8) [DOI] [PubMed] [Google Scholar]
- 43.Gadgil C., Lee C. H., Othmer H. G. 2005. A stochastic analysis of first-order reaction networks. Bull. Math. Biol. 67, 901–946 10.1016/j.bulm.2004.09.009 (doi:10.1016/j.bulm.2004.09.009) [DOI] [PMC free article] [PubMed] [Google Scholar]
- 44.Anderson D. F., Craciun G., Kurtz T. G. 2010. Product-form stationary distributions for deficiency zero chemical reaction networks. Bull. Math. Biol. 72, 1947–1970 10.1007/s11538-010-9517-4 (doi:10.1007/s11538-010-9517-4) [DOI] [PubMed] [Google Scholar]
- 45.Lee C. H., Othmer H. G. In preparation. A multi-time-scale analysis of chemical reaction networks. I. Stochastic systems. [DOI] [PMC free article] [PubMed] [Google Scholar]
- 46.Gillespie D. T. 1976. A general method for numerically simulating the stochastic time evolution of coupled chemical reactions. J. Comput. Phys. 22, 403–434 10.1016/0021-9991(76)90041-3 (doi:10.1016/0021-9991(76)90041-3) [DOI] [Google Scholar]
- 47.Aegerter-Wilmsen T., Aegerter C. M., Bisseling T. 2005. Model for the robust establishment of precise proportions in the early Drosophila embryo. J. Theor. Biol. 234, 13–19 10.1016/j.jtbi.2004.11.002 (doi:10.1016/j.jtbi.2004.11.002) [DOI] [PubMed] [Google Scholar]
- 48.Gregor T., Tank D. W., Wieschaus E. F., Bialek W. 2007. Probing the limits to positional information. Cell 130, 153–164 10.1016/j.cell.2007.05.025 (doi:10.1016/j.cell.2007.05.025) [DOI] [PMC free article] [PubMed] [Google Scholar]
- 49.He F., Saunders T. E., Wen Y., Cheung D., Jiao R., ten Wolde P. R., Howard M., Ma J. 2010. Shaping a morphogen gradient for positional precision. Biophys. J. 99, 697–707 10.1016/j.bpj.2010.04.073 (doi:10.1016/j.bpj.2010.04.073) [DOI] [PMC free article] [PubMed] [Google Scholar]
- 50.de Lachapelle A. M., Bergmann S. 2010. Precision and scaling in morphogen gradient read-out. Mol. Syst. Biol. 6, e1001111. [DOI] [PMC free article] [PubMed] [Google Scholar]
- 51.von Dassow G., Meir E., Munro E. M., Odell G. M. 2000. The segment polarity network is a robust developmental module. Nature 406, 188–192 10.1038/35018085 (doi:10.1038/35018085) [DOI] [PubMed] [Google Scholar]
- 52.Albert R., Othmer H. G. 2003. The topology of the regulatory interactions predicts the expression pattern of the segment polarity genes in Drosophila melanogaster. J. Theor. Biol. 223, 1–18 10.1016/S0022-5193(03)00035-3 (doi:10.1016/S0022-5193(03)00035-3) [DOI] [PMC free article] [PubMed] [Google Scholar]
- 53.Wolpert L., Beddington R., Jessel T., Lawrence P., Meyerowitz E., Smith J. 2002. Principles of development. Oxford, UK: Oxford University Press [Google Scholar]


