Abstract
The desire to better recognized such malignancies, which may be difficult to distinguish from inflammation or trauma, has accelerated the development of endoscopy with new optical technologies. Narrow-band imaging is a novel endoscopic technique that may enhance the accuracy of diagnosis using narrow-bandwidth filters in a red-green-blue sequential illumination system. Autofluorescence imaging is based on the detection of natural tissue fluorescence emitted by endogenous molecules. I-scan technology using a digital filter that modifies normal images through software functions, is the newly developed image-enhanced endoscopic technology from PENTAX. Flexible spectral imaging color enhancement enhances the visualization of mucosal structure and microcirculation by the selection of spectral transmittance with a dedicated wavelength. Confocal laser endomicroscopy images were collected with an argon beam with a scanning depth of 0 (epithelium) to 250 µm (lamina propria) and analyzed using the reflected light.
Keywords: Narrow-band imaging, Autofluorescence imaging, I-scan, Flexible spectral imaging color enhancement, Confocal laser endomicroscopy
INTRODUCTION
The national cancer-screening program in South Korea has prioritized gastroenterologists' mission to diagnose and treat early gastrointestinal cancers. Early detection of such cancers is emphasized because those previously treated surgically can currently be cured endoscopically. Some gastroenterologists can make exact diagnoses regardless of the type of endoscopy used, but certain conditions are generally required for an optimal diagnosis. First, clinically important lesions must be readily detectable. Second, the borders and morphology of lesions must be readily characterized. Third, lesions must be exactly diagnosed. Precancers and early cancers are often subtle and can pose a challenge to gastroenterologists attempting to visualize them using standard white light endoscopy. The use of dye solutions aids the diagnosis of early gastrointestinal cancers; however, constant use of dye solutions is cumbersome, and the solution often hinders observation by pooling in lesion depressions or ulcerations. To overcome this weakness, newer endoscopes have been developed that allow for "image-enhanced endoscopy" using optical and/or electronic methods, such as narrow-band imaging (NBI), autofluorescence imaging (AFI), i-scans, flexible spectral imaging color enhancement (FICE), and confocal laser endomicroscopy (CLE). A discussion of image-enhanced endoscopy follows.
NBI
Principles
NBI is a novel endoscopic technique that may enhance the accuracy of diagnosis using narrow-bandwidth filters in a red-green-blue (RGB) sequential illumination system.1 This technique produces different images at distinct levels of the mucosa and increases the contrast between the epithelial surface and the subjacent vascular pattern. NBI may provide the same contrast-enhancement capability as chromoendoscopy without requiring the use of dye agents.2 The basic principle of NBI is that the depth of penetration into the mucosa depends on the wavelength used: superficial for the blue band, deep for the red band, and intermediate for the green band.3 Because gastrointestinal cancers originate in the mucosa, the use of blue-colored, short-wavelength visible light, which can penetrate only into the mucosa, may be helpful in the observation of minute early expressions. In addition, cancers have abundant blood vessels and induce angiogenesis, which is considered to be important in cancer formation and metastasis; therefore, the recognition of abnormal capillary beds may assist in cancer diagnosis.4 Because short-wavelength visible light is mostly absorbed by hemoglobin in blood vessels, black color is observed when blood vessels are illuminated with such light. Thus, scant differences in mucosal lesions can be expressed distinctly with color, and the capillary bed of the mucosal surface can be observed more clearly when illuminated with narrow-band blue (415±15 nm) and green (540±15 nm) wavelengths.
The NBI system available in South Korea (Evis Lucera Spectrum System, CV-260SL; Olympus Medical Systems Co., Ltd., Tokyo, Japan) has a filter that transmits only 415±15 nm and 540±15 nm wavelengths; when the switch for NBI is activated while observing the upper gastrointestinal system under white light, this filter is inserted, and only a narrow-band around these two wavelengths is transmitted. After the lesions are illuminated, the monochromatic charge-coupled device (CCD) absorbs the reflected light and generates images. Because black and white images have low resolution, the light absorbed by the monochromatic CCD is composited into RGB to generate color images. Consequently, the main image colors consist of brown and green, and the lesions can be observed in higher resolution than with black and white images.
Role and application of NBI
NBI has two main applications: optical/digital chromoendoscopy and optical biopsy. When used in conjunction with magnifying endoscopy (ME), the latter permits pathological diagnosis solely through observation, without the need to perform a biopsy. Pit patterns on colon polyps can be observed more clearly, and it is possible to distinguish between adenomatous polyps, which must be removed, and inflammatory or hyperplastic polyps, which do not have to be removed without performing a biopsy.
The NBI mode facilitates the observation of the length of Barrett's esophagus, which is not readily classified with conventional white light endoscopy, and the gastroesophageal junction. This mode also facilitates the diagnosis of reflux esophagitis. Moreover, NBI can be used with ME to observe the microvasculature and microstructures more definitively and conveniently.
Observation of the esophagus with NBI
Pits are not observed in the esophagus because the esophageal mucosa is squamous epithelium. In NBI, the overall color of the esophageal mucosa is detected as pale green due to the abundant blood vessels in the submucosal layer, and the superficial vasculature of the mucosal layer is observed as a dark-brown color because most wavelengths around 415 nm are ab-sorbed, not reflected.
Observation of esophageal lesions with ME using NBI
Barrett's esophagus
Although Barrett's esophagus may be suspected by endoscopy, the yield of conventional biopsies for the detection of specialized intestinal metaplasia varies from 25% to 50% in short-segment Barrett's esophagus and up to 80% in long-segment Barrett's esophagus.5 Chromoendoscopy and ME can help to overcome this problem, and surface analysis can be used to predict histological findings during endoscopy. Sharma et al.6 reported the use of ME with indigo carmine staining in 80 patients with endoscopic evidence of Barrett's esophagus. Three types of mucosal patterns were noted after spraying the mucosa with indigo carmine: ridge/villous, circular, and an irregular/distorted pattern. The presence of the ridge/villous pattern had a high sensitivity, specificity, and positive predictive value (97%, 76%, and 92%, respectively) for detecting intestinal metaplasia. Six patients had an irregular/distorted pattern, and biopsies revealed high-grade dysplasia in all of these patients (100%).6 ME-NBI was reported to be easier to perform than dye spraying, and it demonstrated a similar diagnostic value.7 Thus, NBI is widely used today and has replaced dyes such as methylene blue or acetic acid.
Esophageal cancer
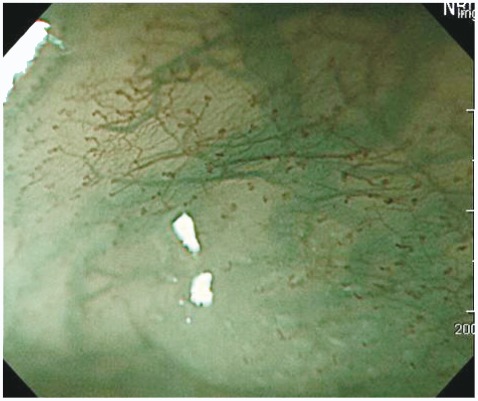
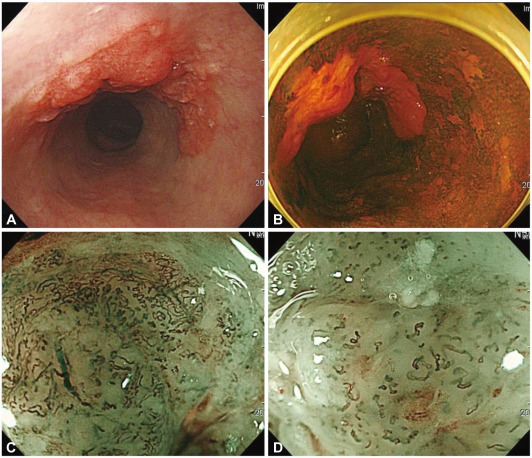
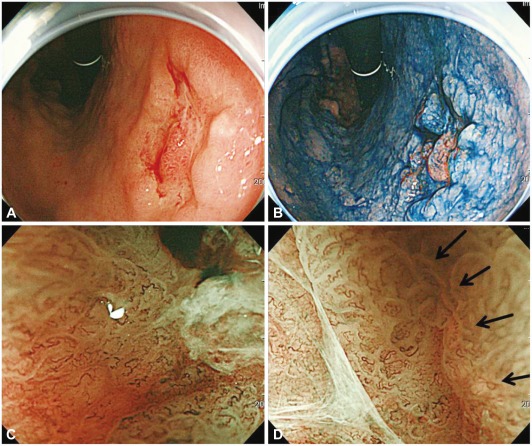
Magnified observation of the esophageal mucosa may reveal tennis racket-shaped dark-brown capillaries in the mucosa that are derived from the side-branch blood vessels in the submucosal layer (Fig. 1). These vessels are known as "intra-epithelial papillary capillary loops" (IPCLs).8 IPCLs demonstrate characteristic morphological changes according to the tissue atypism and cancer invasion depth.9 ME findings with regard to capillary pattern are classified into five types (I-V) according to the degree of change in the IPCL pattern, such as dilatation, tortuosity, or caliber change in one IPCL, or various shapes in multiple IPCLs.10 Classifications include type I (normal mucosa), type II (regenerating epithelium or inflammation), type III (low-grade dysplasia), type IV (high-grade dys-plasia), and type V (cancer). Type V is further divided into types V-1 (m1), V-2 (m2), V-3 (m3, sm1), and VN (more invasion than sm2). However, it is difficult to assess the depth of invasion by ME with a regular system. Because of the NBI effect of capillary enhancement, the microscopic IPCL pattern is readily identified and evaluated by endoscopists with experience in ME (Fig. 2). Yoshida et al.11 reported that ME-NBI improved the accuracy of the assessment of invasion depth in superficial esophageal cancer.
Fig. 1.
The intra-epithelial papillary capillary loop (IPCL) image of normal esophageal mucosa in magnifying endoscopy using narrow-band imaging. Branching vessel which are located at the surface of muscularis mucosa are shown as a green vascular network. The IPCL is observed as a brown vessel which is positioned in the most superficial layer and is derived upright from the branching vessel.
Fig. 2.
Esophageal squamous cell carcinoma. (A) A depressed lesion with irregular nodularity and redness is noted at the mid esophagus. (B) With iodine staining, it is shown as an iodine-void area with a well-defined boundary. The change of intra-epithelial papillary capillary loop type V-3 and VN are observed in (C) the proximal margin and (D) center of the lesion. This lesion was diagnosed as SM2 cancer with lymphatic metastasis.
Observation of the stomach with NBI
In the stomach, the NBI technique is useful only when applied to ME. In NBI mode, gastric mucosal imaging is too dark and noisy for meaningful investigation because the lumen of the stomach is large and the light intensity of NBI is relatively weak. A study that observed intestinal metaplasia and adenoma in the stomach using NBI without ME found that the sensitivity, specificity, and positive and negative predictive values for the detection of premalignant lesions were 71%, 58%, 65%, and 65% for NBI and 51%, 67%, 62%, and 55% for white light endoscopy, respectively.12 However, very few studies have evaluated the usefulness of NBI alone because of the darkness and low resolution in the stomach.
Observation of gastric lesions with ME using NBI
Chronic gastritis
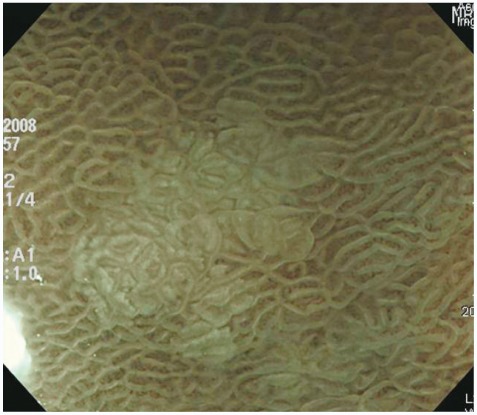
The ME findings in the gastric body are categorized into four types: type 1, honeycomb-type subepithelial capillary network (SECN) with regular arrangement of collecting venules and regular, round pits; type 2, honeycomb-type SECN with regular, round pits, but without collecting venules; type 3, loss of normal SECN and collecting venules, with enlarged white pits surrounded by erythema; and type 4, loss of normal SECN and round pits, with irregular arrangement of collecting venules. Anagnostopoulos et al.13 reported that the sensitivity, specificity, and positive and negative predictive values of the type 2 and 3 patterns for predicting a Helicobacter pylori-infected stomach were 100%, 92.7%, 83.8%, and 100%, respectively. The sensitivity, specificity, and positive and negative predictive values of the type 4 pattern for predicting gastric atrophy were 90%, 96%, 85.7%, and 97.3%. A characteristic finding known as the light-blue crest was detected in intestinal metaplasia in the stomach through ME-NBI, and this finding was reported to have high specificity for representing histological intestinal metaplasia.14 The light-blue crest was defined as a fine, blue-white line on the crests of the epithelial surface or gyri, as visualized by ME-NBI (Fig. 3). This appearance is speculated to be caused by reflection of the short- and narrow-wavelength light (400-430 nm) at the surface of the ciliated tissue structure; that is, the brush border in gastric intestinal metaplasia and in the duodenum.
Fig. 3.
Magnified endoscopic findings of light blue crests in the gastric antral mucosa. Light blue crest is clearly visualized as blue-white lines on the epithelial edge or surface by magnification with narrow-band imaging.
Gastric adenoma
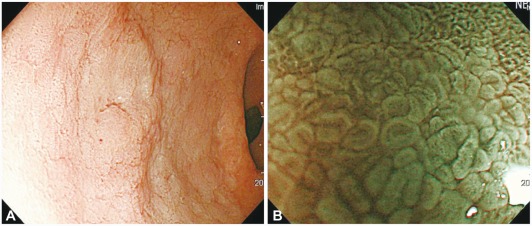
In cases of elevated gastric adenoma, it is sometimes impossible to visualize the microvascular pattern. According to a recent study, a characteristic white opaque substance (WOS) was found along the mucosal surface when an elevated gastric adenoma was observed with ME-NBI (Fig. 4). An analysis of 46 cases of elevated-type adenoma and cancer found regularly shaped WOS in all adenoma cases and irregularly shaped WOS in 83% of carcinoma cases. The authors concluded that the morphological analysis of the WOS could provide an alternative new optical sign for the discrimination of adenoma from carcinoma when using ME-NBI.15
Fig. 4.
Low grade dysplasia. (A) A slightly elevated discolored lesion is observed in the antrum. (B) White opaque substances along the surface of the lesion is observed by magnified endoscopy with narrow-band imaging.
Early gastric cancer
ME-NBI is reportedly a sensitive and accurate diagnostic tool for the assessment of differentiation, margins, and depth of early gastric cancer.16-22
Histological types of gastric cancer
Yao et al.16 reported that the ME findings for gastric differentiated carcinoma were the disappearance of the regular SECN pattern, presence of an irregular microvascular pattern, and presence of a demarcation line (a clear border between an irregular microvascular or microsurface pattern and surrounding, regular, normal mucosa) (Fig. 5). In undifferentiated gastric cancer, an ill-defined area with a reduced number of irregular minute vessels was observed (Fig. 6). However, the authors did not report the incidence of the above finding. Nakayoshi et al.17 assessed the correlation between the ME-NBI and histological findings, especially with regard to the microvascular pattern, in 165 cases of superficial depressed-type early gastric cancer lesions (109 differentiated adenocarcinomas, 56 undifferentiated adenocarcinomas). A fine network microvascular pattern was observed in 72 of 109 (66.1%) cases of differentiated adenocarcinoma, and a corkscrew pattern was observed in 48 of 56 (85.7%) cases of undifferentiated adenocarcinoma (p=0.0011). The authors concluded that ME-NBI was capable of predicting the histological characteristics of gastric cancer lesions.
Fig. 5.
Type 0-IIc early gastric cancer of well-differentiated adenocarcinoma. (A) A depressed lesion with central nodule is noted by white light endoscopy. (B) Chromoendoscopy. (C) Magnifying endoscopy with narrow-band imaging demonstrates loss of fine mucosal structure, loss of subepithelial capillary network and presence of an irregular microvascular pattern. (D) At the margin of the carcinoma, demarcation line is noted (arrows).
Fig. 6.
Type 0-IIb early gastric cancer of signet ring cell carcinoma. (A) A flat pale mucosal lesion is noted on the body. (B) Magnifying endoscopy with narrow-band imaging findings of that pale mucosa show loss of the regular subepithelial capillary network pattern and corkscrew pattern.
Depth of invasion
Yagi et al.18 assessed the relationship among microvessel, pit, and histological patterns using ME-NBI. They found that the magnified view of the cancerous area showed three types of patterns: a mesh pattern, a loop pattern, and an interrupted pattern. Most (94.9%) lesions showing a mesh or loop pattern were mucosal cancer, whereas 92.3% of lesions showing an interrupted pattern were submucosal differentiated adenocarcinoma (Fig. 7). The authors clarified the characteristic features of the magnified view of mucosal differentiated gastric adenocarcinoma and the characteristics of invasive changes, including submucosal invasion.
Fig. 7.
Type 0-IIc early gastric cancer of signet ring cell carcinoma. (A) A depressed pale mucosal lesion is noted on the high body. (B, C) Magnifying endoscopy with narrow-band imaging finding shows loss of the microsurface structure, corkscrew, and interrupted microvascular pattern. The vessels in cancerous lesions shows abnormal dilatation, abrupt in caliber and heterogeneity in shape. This lesion was diagnosed as SM1 cancer with lymphatic invasion.
Determining the gastric tumor margin
The usefulness of ME-NBI for determining the gastric tumor margin has been reported. Kadowaki et al.19 reported the ease of recognition of the tumor margin. They investigated the effectiveness of four ME methods in enhancing the recognition of the tumor margin: conventional ME (CME), ME-NBI, enhanced ME with acetic acid (EME), and NBI-EME. They found that the average scores (expert and non-expert) of images acquired using NBI-EME were significantly higher than those acquired using other methods, and that images acquired by ME-NBI or EME also scored significantly higher than those acquired by CME. Kiyotoki et al.20 evaluated the usefulness of ME-NBI for determining the tumor margin. The rate of accurate marking of the ME-NBI group was significantly higher than that of the indigo carmine chromoendoscopy group (97.4% vs. 77.8%; p=0.009).
Diagnostic accuracy for depressed-type gastric cancers
Ezoe et al.21 reported the diagnostic value of ME-NBI for gastric small depressive lesions. They found a significantly higher diagnostic accuracy (79% vs. 44%; p=0.0001) and sensitivity (70% vs. 33%; p=0.0005) for NBI than for white light imaging, and reported that the demarcation line and an irregular microvascular pattern were valuable findings in the differential diagnosis of gastric small depressive lesions. They concluded that the addition of NBI to white light imaging examinations was essential to achieve an accurate diagnosis of such lesions. Kato et al.22 reported the superiority of ME-NBI in the differential diagnosis of superficial gastric lesions identified with conventional white light endoscopy. They set the minimal criteria for the diagnosis of gastric cancer by ME-NBI as the disappearance of fine mucosal structure, microvascular dilation, and heterogeneity. The sensitivity (92.9%) and specificity (94.7%) for an ME-NBI diagnosis with the use of these three criteria were significantly better than those for white light endoscopy (42.9% and 61.0%, respectively; p<0.0001). The authors concluded that ME-NBI might increase the diagnostic value of endoscopy in a population at high risk for gastric cancer.
AFI
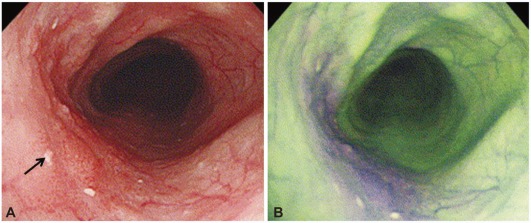
AFI is based on the detection of natural tissue fluorescence emitted by endogenous molecules (fluorophores), such as collagen, nicotinamide, adenine dinucleotide, flavin, and porphyrins. After excitation by a short-wavelength light source, these fluorophores emit light of longer wavelengths (fluorescence). These metabolites may be responsible for the observed differences in the autofluorescence spectra of normal and diseased tissues. In AFI images, normal tissue and vessels appear green and bright green, respectively. However, normal fundic mucosa and early gastric cancers appear as well-defined pink lesions. The differential light attenuation of dysplasia/cancer is likely due to: 1) an increased nuclear/cytoplasmic ratio, 2) decreased collagen, and 3) an increased hemoglobin concentration due to an increased mucosal blood supply. AFI may be useful for defining the location and border of gastric lesions because of the autofluorescence of abnormal tissue. Some previous studies have suggested that AFI is useful in predicting the depth of invasion, but others have reported that depressive early gastric cancers may appear green in color (Fig. 8).23-27
Fig. 8.
Early esophageal cancer. (A) Conventinal endoscopic image shows flat lesion at left side (arrow). (B) Autofluorescence imaging shows that extent of the tumor become purple color change.
Kara et al.28 reported that AFI detected more dysplastic and neoplastic changes in Barrett's esophagus than did conventional endoscopy with four-quadrant biopsies. Ohkawa et al.29 documented that AFI provided a sensitivity of 96.4% and specificity of 49.1% because some benign lesions produced fluorescence similar to that of malignant tumors. Therefore, AFI was recently assessed as part of trimodal imaging with white light endoscopy and ME-NBI. One study in the UK demonstrated that AFI did not show better sensitivity or specificity and exhibited worse accuracy and interobserver agreement than NBI in the diagnosis of colon polyps <10 mm in size.30 In conclusion, AFI might be useful as a complementary modality in the detection of gastric lesions.
I-SCAN
I-scan technology is the newly developed image-enhanced endoscopic technology from PENTAX (Tokyo, Japan). It consists of three types of algorithms: surface enhancement (SE), contrast enhancement (CE), and tone enhancement (TE). SE enhances light/dark contrast by obtaining luminance intensity data for each pixel and applying an algorithm that allows for the detailed observation of mucosal surface structure. SE allows for more extensive observation of minute glandular structures, which facilitates the evaluation of changes on the basis of structural differences. The SE component of the i-scan system is comparable with the SE function of Olympus and has a chromoendoscopic effect similar to that of acetic acid solution.
CE digitally adds blue color in relatively dark areas by obtaining luminance intensity data for each pixel and applying an algorithm that allows for detailed observation of subtle irregularities around the surface. With TE, the RGB components of an ordinary endoscopic image are disintegrated into each component, and each component thus isolated is converted independently along the tone curve, followed by a re-synthesis of the three components to yield a reconstructed image. NBI is an optical-filter technology that uses two narrow-band filters to provide tissue illumination in the blue and green light spectra, whereas TE is a digital filter that modifies normal images through software functions.
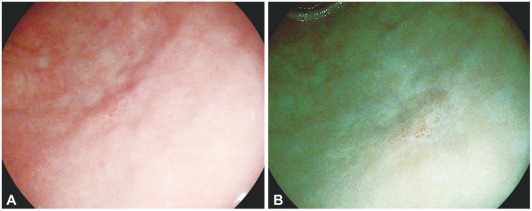
At present, six types of TE are available: TE-p, TE-v, TE-b, TE-e, TE-g, and TE-c. TE-p, which enhances the dark R component, allows the ready identification of mucosal surface lesions and pit patterns. TE-v, which suppresses the R component in a manner similar to NBI filtration, allows the ready identification of vascular form. TE-b is similar to TE-p in the enhancement of dark-red color, but is designed for the observation of Barrett's esophagus. With TE-e (for esophagus), the J-type tone curve, which suppresses the maximum output, is adopted for the R component to elevate G/B contrast and make structural changes clearer. With TE-g (for stomach), the J-type tone curve, which suppresses the maximum output, is adopted for the R component to elevate G/B contrast, and the S-type tone curve is adopted for the G and B components to elevate color contrast. In this way, TE-g yields images that allow the ready identification of a lesion because it can increase the contrast for even minor differences in color tone (Fig. 9). TE-c, the J-type tone curve, is adopted for the R component, but the output is higher than that with TE-g, which results in a slightly reddish image. The EPK-i system is expected to play a role similar to that of other image-enhanced endoscopic techniques, although few detailed reports have assessed the application of this system to the evaluation of gastrointestinal cancers.31,32 In one study from Germany,33,34 the authors inspected the last 30 cm of the colon in a screening population with high-definition (HD)+ resolution alone, in combination with i-scan, and subsequently with chromoendoscopy. In 69 patients, i-scan augmented the identification of lesions from 176 to 335; chromoendoscopy brought this number to 646. Most (74%) lesions recognized only using i-scan or chromoendoscopy were flat (type IIb). The amount of neoplasia did not differ significantly, but all could be correctly predicted using i-scan or chromoendoscopy. Furthermore, the authors performed screening colonoscopies in 200 patients with HD+ colonoscopy in conjunction with i-scan SE or standard video colonoscopy. HD+ colonoscopy with i-scan functionality detected significantly more patients with colorectal neoplasia (38%) compared with standard-resolution endoscopy (13%).
Fig. 9.
I-scan image of depressed typed early gastric cancer. (A) Small depressed lesion is noted at antrum. (B) I-scan tone enhancement (TE)-g makes it more clear delineation of the tumor.
Significantly more neoplastic (adenomatous and cancerous) lesions and more flat adenomas could be detected using HD endoscopy with SE. Final histology could be predicted with high accuracy within the HD+ group.
We performed HD+ white-light gastroscopy in conjunction with i-scan TE-g and TE-c or chromoendoscopy using 1.5% acetic acid and indigo carmine in 76 patients with early gastric cancer to clearly define the border before endoscopic submucosal dissection. HD+ gastroscopy in conjunction with i-scan TE-c defined the border more clearly compared with TE-g, and did not differ from the definitions achieved with chromoendoscopy using 1.5% acetic acid and indigo carmine. Therefore, we expect that image-enhanced endoscopy alone without classic chromoendoscopy might outline the safe borders of early gastric cancers before endoscopic treatment.35
FICE
Optimal band imaging (OBI), the generic term for FICE, enhances the visualization of mucosal structure and microcirculation by the selection of spectral transmittance with a dedicated wavelength. In contrast to NBI, in which the bandwidth of the spectral transmittance is narrowed by optical filters, the OBI system is based on a new computed spectral-estimation technique. In NBI, the observer must change optical filters to observe wavelengths other than the established wavelength; in OBI, however, the observer can select an optimal set of wavelengths by simply switching a key. Thus, an optimal wavelength can be used to evaluate the esophagus, stomach, and colon. In OBI, endoscopists can select 60 spectral images per 5 nm at visible wavelengths between 400 and 695 nm, and set up five gradations of spectral image intensities. Because OBI was created by the selection of three of 300 series of spectral image intensities (60×5 steps), 27 millions of OBI images (3003) were obtained in one type of conventional endoscopic image. In the present study, the demarcation of depressed-type early gastric cancer was identified in 26 of 27 cases (96%), and elevated-type early gastric cancer was identified in all 81 cases without magnification, which allowed for planning of endoscopic submucosal dissection (ESD). In 61 patients undergoing upper endoscopy for a clinical history of malabsorption or serologic suspicion of celiac disease, which is rare in Korea, the sensitivity, specificity, and positive and negative predictive values of OBI-based duodenoscopy were 100% in the evaluation of villous patterns.36,37
CLE
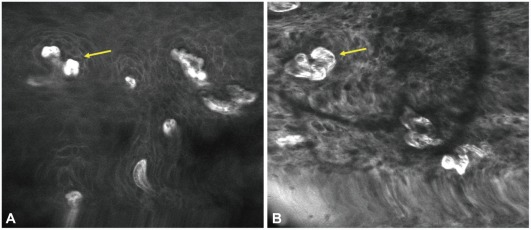
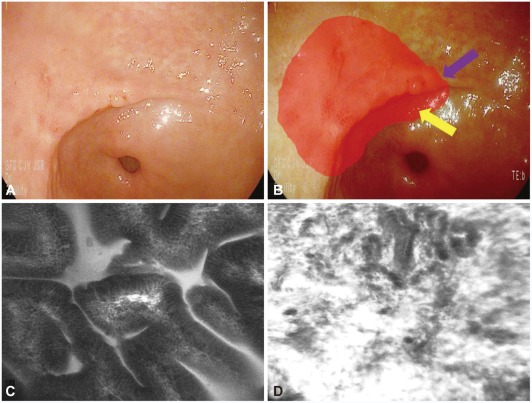
CLE is the latest endoscopic imaging technique. CLE images were collected using an argon beam with a scanning depth of 0 (epithelium) to 250 µm (lamina propria) and analyzed using the reflected light. CLE is also called "virtual biopsy" because a 1,000× magnified image is obtained, similar to the microscopic observation of tissues. Contrast medium is necessary to obtain CLE images; fluorescein, which spreads in cell tissues (except the cell nucleus) through capillary vessels, is commonly used and can allow for the observation of tissue structure. Thus, benign and malignant neoplasias can be distinguished by identification of the change in mucosal structure (Figs. 10, 11). Two models currently employ CLE systems. One is a PENTAX system, in which a confocal laser microscope is integrated into the distal tip of a conventional video endoscope. The advantages of this system include the production of high-quality images, better penetration capacity, and the ability to be used as an instrumental channel. However, it has disadvantages, such as a large endoscope diameter and limitation of banding of the distal tip of the scope. The other system is a probe-type CLE (Cellvizio) developed by Mauna Kea Technologies (Paris, France). Unlike the all-in-one CLE, this system can be used in endoscopic retrograde cholangiopancreatography; moreover, it does not require the preparation of additional endoscopic equipment. However, it has a lower resolution and lower penetration ratio compared with those of the PENTAX CLE. Many studies of the differentiation of gastrointestinal cancer and the diagnosis of coexisting malignancies of inflammatory bowel disease using CLE have been published, and the study territory has been extended to the field of pulmonology, which uses bronchoscopy.38-41 In our study group, we compared the results of endoscopic biopsies before ESD and those of biopsies using CLE with the post-ESD histopathological findings of 35 cases (11 adenomas, 24 adenocarcinomas). The overall accuracy of CLE diagnosis of gastric adenomas and adenocarcinomas was significantly higher than that of endoscopic biopsy (94.2% vs. 85.7%). The overall accuracy of CLE diagnosis of differentiated and undifferentiated adenocarcinomas was also higher than that of endoscopic biopsy. In another study involving approximately 1,786 cases of early gastrointestinal cancer, images obtained by CLE showed a high sensitivity (88.1%) and specificity (98.6%). In the differentiation of early cancer and dysplasia, the sensitivity, specificity, and accuracy of real-time CLE diagnosis (88.9%, 99.3%, and 98.8%, respectively) were superior to those of standard videoendoscopy (72.2%, 95.1%, and 94.1%, respectively).42 If the issues regarding diagnostic accordance between observers and health insurance payments are resolved, CLE will be spotlighted in the near future because it will expand the diagnostic territory and shorten treatment courses.
Fig. 10.
Confocal laser endomicroscopy imaging of early esophageal cancer. (A) Normal esophageal mucosa shows regular patterns of squamous epithelium with normal intra-epithelial papillary capillary loop (IPCL) (arrow). (B) Tumor shows irregular patterns of squamous epithelium and dilated IPCL (arrow).
Fig. 11.
Tumor margin delineation with confocal laser endomicroscopy (CLE). (A) Slightly depressed lesion is noted and previous forceps biopsy show signet ring cell adenocarcinoma. (B) It is not easily delineated for the exact tumor margin (red circle). (C) CLE help the delineation of the tumor margin with the determination of in vivo histology (normal mucosal surface; purple arrow in B). (D) Tumor mucosal surface (yellow arrow in B).
CONCLUSIONS
The early detection and treatment of gastrointestinal cancer and premalignant lesions is very important for the efficacy of treatment and the maintenance of a high quality of life; which is why gastrointestinal endoscopists have tremendous responsibilities. Optical imaging technology is advancing due to the development of endoscopic technology; the diagnostic accuracy and image reconstruction capabilities of this technology are similar to those of pathological imaging. If we give attention to various endoscopic features and are well informed of their advantages and disadvantages, optical imaging technology will become helpful for the diagnosis and treatment of gastrointestinal abnormalities.
Footnotes
The authors have no financial conflicts of interest.
References
- 1.Tajiri H, Matsuda K, Fujisaki J. What can we see with the endoscope? Present status and future perspectives. Dig Endosc. 2002;14:131–137. [Google Scholar]
- 2.Kara MA, Peters FP, Rosmolen WD, et al. High-resolution endoscopy plus chromoendoscopy or narrow-band imaging in Barrett's esophagus: a prospective randomized crossover study. Endoscopy. 2005;37:929–936. doi: 10.1055/s-2005-870433. [DOI] [PubMed] [Google Scholar]
- 3.Yasushi S, Manabu M, Hisao T, Atsushi O, Shigeaki Y. Optical/digital chromoendoscopy during colonoscopy using narrow-band imaging system. Dig Endosc. 2005;17(Suppl 1):S43–S48. [Google Scholar]
- 4.Muto M, Katada C, Sano Y, Yoshida S. Narrow band imaging: a new diagnostic approach to visualize angiogenesis in superficial neoplasia. Clin Gastroenterol Hepatol. 2005;3(7 Suppl 1):S16–S20. doi: 10.1016/s1542-3565(05)00262-4. [DOI] [PubMed] [Google Scholar]
- 5.Singh S, Sharma P. Magnification endoscopy in the upper GI tract. Dig Endosc. 2005;17(Suppl 1):S17–S19. [Google Scholar]
- 6.Sharma P, Weston AP, Topalovski M, Cherian R, Bhattacharyya A, Sampliner RE. Magnification chromoendoscopy for the detection of intestinal metaplasia and dysplasia in Barrett's oesophagus. Gut. 2003;52:24–27. doi: 10.1136/gut.52.1.24. [DOI] [PMC free article] [PubMed] [Google Scholar]
- 7.Hamamoto Y, Endo T, Nosho K, Arimura Y, Sato M, Imai K. Usefulness of narrow-band imaging endoscopy for diagnosis of Barrett's esophagus. J Gastroenterol. 2004;39:14–20. doi: 10.1007/s00535-003-1239-z. [DOI] [PubMed] [Google Scholar]
- 8.Inoue H, Honda T, Yoshida T, et al. Ultra-high magnification endoscopy of the normal esophageal mucosa. Dig Endosc. 1996;8:134–138. [Google Scholar]
- 9.Inoue H, Honda T, Nagai K, et al. Ultra-high magnification endoscopic observation of carcinoma in situ of the esophagus. Dig Endosc. 1997;9:16–18. [Google Scholar]
- 10.Inoue H. Magnification endoscopy in the esophagus and stomach. Dig Endosc. 2001;13(Suppl 1):S40–S41. [Google Scholar]
- 11.Yoshida T, Inoue H, Usui S, Satodate H, Fukami N, Kudo SE. Narrow-band imaging system with magnifying endoscopy for superficial esophageal lesions. Gastrointest Endosc. 2004;59:288–295. doi: 10.1016/s0016-5107(03)02532-x. [DOI] [PubMed] [Google Scholar]
- 12.Capelle LG, Haringsma J, de Vries AC, et al. Narrow band imaging for the detection of gastric intestinal metaplasia and dysplasia during surveillance endoscopy. Dig Dis Sci. 2010;55:3442–3448. doi: 10.1007/s10620-010-1189-2. [DOI] [PMC free article] [PubMed] [Google Scholar]
- 13.Anagnostopoulos GK, Yao K, Kaye P, et al. High-resolution magnification endoscopy can reliably identify normal gastric mucosa, Helicobacter pylori-associated gastritis, and gastric atrophy. Endoscopy. 2007;39:202–207. doi: 10.1055/s-2006-945056. [DOI] [PubMed] [Google Scholar]
- 14.Uedo N, Ishihara R, Iishi H, et al. A new method of diagnosing gastric intestinal metaplasia: narrow-band imaging with magnifying endoscopy. Endoscopy. 2006;38:819–824. doi: 10.1055/s-2006-944632. [DOI] [PubMed] [Google Scholar]
- 15.Yao K, Iwashita A, Tanabe H, et al. White opaque substance within superficial elevated gastric neoplasia as visualized by magnification endoscopy with narrow-band imaging: a new optical sign for differentiating between adenoma and carcinoma. Gastrointest Endosc. 2008;68:574–580. doi: 10.1016/j.gie.2008.04.011. [DOI] [PubMed] [Google Scholar]
- 16.Yao K, Yao T, Iwashita A. Determining the horizontal extent of early gastric carcinoma: two modern techniques based on differences in the mucosal microvascular architecture and density between carcinomatous and non-carcinomatous mucosa. Dig Endosc. 2002;14(Suppl 1):S83–S87. [Google Scholar]
- 17.Nakayoshi T, Tajiri H, Matsuda K, Kaise M, Ikegami M, Sasaki H. Magnifying endoscopy combined with narrow band imaging system for early gastric cancer: correlation of vascular pattern with histopathology (including video) Endoscopy. 2004;36:1080–1084. doi: 10.1055/s-2004-825961. [DOI] [PubMed] [Google Scholar]
- 18.Yagi K, Nakamura A, Sekine A, Hajime U. Magnifying endoscopy with narrow band imaging for early differentiated gastric adenocarcinoma. Dig Endosc. 2008;20:115–122. [Google Scholar]
- 19.Kadowaki S, Tanaka K, Toyoda H, et al. Ease of early gastric cancer demarcation recognition: a comparison of four magnifying endoscopy methods. J Gastroenterol Hepatol. 2009;24:1625–1630. doi: 10.1111/j.1440-1746.2009.05918.x. [DOI] [PubMed] [Google Scholar]
- 20.Kiyotoki S, Nishikawa J, Satake M, et al. Usefulness of magnifying endoscopy with narrow-band imaging for determining gastric tumor margin. J Gastroenterol Hepatol. 2010;25:1636–1641. doi: 10.1111/j.1440-1746.2010.06379.x. [DOI] [PubMed] [Google Scholar]
- 21.Ezoe Y, Muto M, Horimatsu T, et al. Magnifying narrow-band imaging versus magnifying white-light imaging for the differential diagnosis of gastric small depressive lesions: a prospective study. Gastrointest Endosc. 2010;71:477–484. doi: 10.1016/j.gie.2009.10.036. [DOI] [PubMed] [Google Scholar]
- 22.Kato M, Kaise M, Yonezawa J, et al. Magnifying endoscopy with narrow-band imaging achieves superior accuracy in the differential diagnosis of superficial gastric lesions identified with white-light endoscopy: a prospective study. Gastrointest Endosc. 2010;72:523–529. doi: 10.1016/j.gie.2010.04.041. [DOI] [PubMed] [Google Scholar]
- 23.Cho JY, Hong SJ. Autofluorescence imaging: as a new method for predicting metachronous gastric cancer. J Gastroenterol Hepatol. 2010;25:1814–1815. doi: 10.1111/j.1440-1746.2010.06513.x. [DOI] [PubMed] [Google Scholar]
- 24.Otani A, Amano Y, Koshino K, et al. Is autofluorescence imaging endoscopy useful for determining the depth of invasion in gastric cancer? Digestion. 2010;81:96–103. doi: 10.1159/000252767. [DOI] [PubMed] [Google Scholar]
- 25.Nakamura M, Tahara T, Shibata T, et al. Diagnostic efficacy of autofluorescence and reflectance imaging endoscopy for lateral extension of early gastric cancers. Gastrointest Endosc. 2009;70:599. doi: 10.1016/j.gie.2009.01.036. [DOI] [PubMed] [Google Scholar]
- 26.Kim WJ, Cho JY, Jeong SW, et al. Comparison of autofluorescence imaging endoscopic findings with pathologic findings after endoscopic submucosal dissection of gastric neoplasms. Gut Liver. 2008;2:186–192. doi: 10.5009/gnl.2008.2.3.186. [DOI] [PMC free article] [PubMed] [Google Scholar]
- 27.Kato M, Uedo N, Ishihara R, et al. Analysis of the color patterns of early gastric cancer using an autofluorescence imaging video endoscopy system. Gastric Cancer. 2009;12:219–224. doi: 10.1007/s10120-009-0529-4. [DOI] [PubMed] [Google Scholar]
- 28.Kara MA, Peters FP, Fockens P, ten Kate FJ, Bergman JJ. Endoscopic video-autofluorescence imaging followed by narrow band imaging for detecting early neoplasia in Barrett's esophagus. Gastrointest Endosc. 2006;64:176–185. doi: 10.1016/j.gie.2005.11.050. [DOI] [PubMed] [Google Scholar]
- 29.Ohkawa A, Miwa H, Namihisa A, et al. Diagnostic performance of light-induced fluorescence endoscopy for gastric neoplasms. Endoscopy. 2004;36:515–521. doi: 10.1055/s-2004-814409. [DOI] [PubMed] [Google Scholar]
- 30.Ignjatovic A, East JE, Guenther T, et al. What is the most reliable imaging modality for small colonic polyp characterization? Study of white-light, autofluorescence, and narrow-band imaging. Endoscopy. 2011;43:94–99. doi: 10.1055/s-0030-1256074. [DOI] [PubMed] [Google Scholar]
- 31.Lee BI. EPK-i endoscopy. Korean J Gastrointest Endosc. 2009;39(Suppl 1):184–186. [Google Scholar]
- 32.Kodashima S, Fujishiro M. Novel image-enhanced endoscopy with i-scan technology. World J Gastroenterol. 2010;16:1043–1049. doi: 10.3748/wjg.v16.i9.1043. [DOI] [PMC free article] [PubMed] [Google Scholar]
- 33.Hoffman A, Kagel C, Goetz M, et al. Recognition and characterization of small colonic neoplasia with high-definition colonoscopy using i-scan is as precise as chromoendoscopy. Dig Liver Dis. 2010;42:45–50. doi: 10.1016/j.dld.2009.04.005. [DOI] [PubMed] [Google Scholar]
- 34.Hoffman A, Sar F, Goetz M, et al. High definition plus colonoscopy combined with i-scan is superior in the detection and characterization of colorectal neoplasias compared to standard video colonoscopy: a prospective randomized trial. Gastrointest Endosc. 2009;69:AB131–AB132. doi: 10.1055/s-0030-1255713. [DOI] [PubMed] [Google Scholar]
- 35.Hong SW, Cho WY, Cho JY, et al. Comparison between i scan and ch-romoscopy for delineation of the margin in early gastric cancer. Endoscopy. 2011 Forthcoming. [Google Scholar]
- 36.Yoshizawa M, Osawa H, Yamamoto H, et al. Diagnosis of elevated-type early gastric cancers by the optimal band imaging system. Gastrointest Endosc. 2009;69:19–28. doi: 10.1016/j.gie.2008.09.007. [DOI] [PubMed] [Google Scholar]
- 37.Osawa H, Yoshizawa M, Yamamoto H, et al. Optimal band imaging system can facilitate detection of changes in depressed-type early gastric cancer. Gastrointest Endosc. 2008;67:226–234. doi: 10.1016/j.gie.2007.06.067. [DOI] [PubMed] [Google Scholar]
- 38.Kiesslich R, Burg J, Vieth M, et al. Confocal laser endoscopy for diagnosing intraepithelial neoplasias and colorectal cancer in vivo. Gastroenterology. 2004;127:706–713. doi: 10.1053/j.gastro.2004.06.050. [DOI] [PubMed] [Google Scholar]
- 39.Kiesslich R, Gossner L, Goetz M, et al. In vivo histology of Barrett's esophagus and associated neoplasia by confocal laser endomicroscopy. Clin Gastroenterol Hepatol. 2006;4:979–987. doi: 10.1016/j.cgh.2006.05.010. [DOI] [PubMed] [Google Scholar]
- 40.Liu H, Li YQ, Yu T, et al. Confocal endomicroscopy for in vivo detection of microvascular architecture in normal and malignant lesions of upper gastrointestinal tract. J Gastroenterol Hepatol. 2008;23:56–61. doi: 10.1111/j.1440-1746.2007.05221.x. [DOI] [PubMed] [Google Scholar]
- 41.Liu H, Li YQ, Yu T, et al. Confocal laser endomicroscopy for superficial esophageal squamous cell carcinoma. Endoscopy. 2009;41:99–106. doi: 10.1055/s-0028-1119492. [DOI] [PubMed] [Google Scholar]
- 42.Jeon SR, Cho WY, Jin SY, Cheon YK, Choi SR, Cho JY. Optical biopsies by confocal endomicroscopy prevent additive endoscopic biopsies before endoscopic submucosal dissection in gastric epithelial neoplasias: a prospective, comparative study. Gastrointest Endosc. 2011;74:772–780. doi: 10.1016/j.gie.2011.05.005. [DOI] [PubMed] [Google Scholar]


