

Abstract
The biological bases of learning and memory are being revealed today with a wide array of molecular approaches, most of which entail the analysis of dysfunction produced by gene disruptions. This perspective derives both from early “genetic dissections” of learning in mutant Drosophila by Seymour Benzer and colleagues and from earlier behavior-genetic analyses of learning and in Diptera by Jerry Hirsch and coworkers. Three quantitative-genetic insights derived from these latter studies serve as guiding principles for the former. First, interacting polygenes underlie complex traits. Consequently, learning/memory defects associated with single-gene mutants can be quantified accurately only in equilibrated, heterogeneous genetic backgrounds. Second, complex behavioral responses will be composed of genetically distinct functional components. Thus, genetic dissection of complex traits into specific biobehavioral properties is likely. Finally, disruptions of genes involved with learning/memory are likely to have pleiotropic effects. As a result, task-relevant sensorimotor responses required for normal learning must be assessed carefully to interpret performance in learning/memory experiments. In addition, more specific conclusions will be obtained from reverse-genetic experiments, in which gene disruptions are restricted in time and/or space.
Keywords: Drosophila, mutant, cAMP, CREB, Pavlovian conditioning
The idea that genetic differences may underlie behavioral diversity among individuals is as old as evolutionary theory. Both Charles Darwin (1) and his cousin Francis Galton (2) devoted considerable thought to this notion and its social consequences. These concepts slowly coalesced over the first half of this century into the field of behavior-genetic research, which professed four experimental goals (3): (i) “to discover whether a given behavior pattern is transmitted from generation to generation,” (ii) “to determine the number and nature of genetic factors involved in the trait,” (iii) “to locate the gene or genes on the chromosomes,” and (iv) “to determine the manner in which the genes act to produce the trait.” Thus, isolation and characterization of the individual genes underlying a particular behavior have long been an objective of this field.
Initially, these objectives were sought within the conceptual framework of bidirectional selection experiments. A behavioral response was quantified in individuals, and then high or low responders were mated amongst themselves. Over several generations, average levels of response for the “high” and “low” strains usually diverged considerably. In this manner, Tolman (4) selected for “bright” and “dull” rats based on their abilities to learn to navigate a maze for a food reward. Thus began genetic analyses of learning.
Behavior-Genetic Analysis of Polygenic Architecture
Under the intellectual guidance of Tolman and Tryon (5) at the University of California at Berkeley, Jerry Hirsch studied the extreme responses of maze-bright and maze-dull rats to elucidate theories of learning. Afterwards, Hirsch crossed paths with Dobzhansky at Columbia University (New York) and integrated his views of population genetics with those of experimental psychology (6, 7). This Hirschian view of “modern” behavior-genetic analysis is best described in the epilogue of Behavior-Genetic Analysis (8), which stands as one of the most comprehensive syntheses of the conceptual issues.
Hirsch and colleagues (9, 10, 11) pursued genetic analyses of simpler behaviors, such as phototaxis or geotaxis, in Dobzhansky’s favorite species, Drosophila. In each case, complex underlying genetic architectures were revealed. Hirsch’s ultimate interest, nonetheless, was a genetic analysis of learning. To this end, then-current claims for associative learning in Drosophila were analyzed experimentally and rejected as invalid (12, 13). In 1971, however, Margaret Nelson (14) reported what seemed to be a solid case for classical conditioning of the proboscis extension response (PER) in another Dipteran, the blowfly Phormia regina. So, Hirsch and coworkers turned their attention to this species.
Bidirectional selection for “bright” and “dull” conditioning of the PER eventually produced two divergent strains (Fig. 1A; refs. 15 and 17; see ref. 18 for similar experiments with fruit flies). Such slow responses to selection immediately suggested the involvement of several genes. Quantitative genetic analysis (19) of data derived from Mendelian crosses (F1, F2, and backcrosses) between the bright and dull strains subsequently yielded an estimate of more than four “segregating units” contributing to individual differences in performance (15). This necessarily was an underestimate of the number of genes involved, because individuals from an F2 population represented a limited number of recombination events among relevant gene loci.
Figure 1.
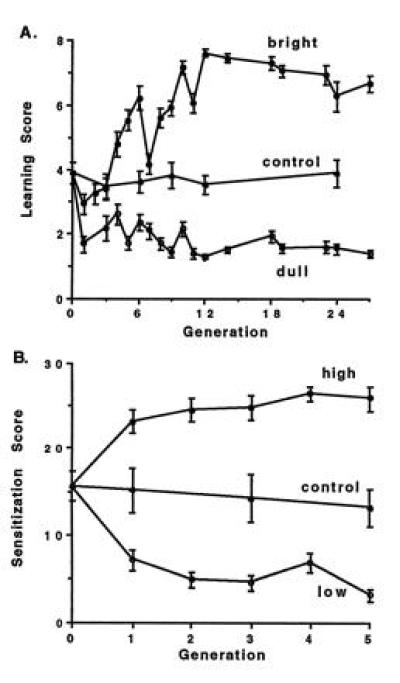
Bidirectional selection for learning in blowflies. (A) Food-deprived individual blowflies were subjected to 15 trials of a classical conditioning procedure that paired one of two tarsal chemosensory stimuli (CSs; either water or saline) with a sucrose (US; reward) stimulus applied to the proboscis. Normally, the US produced a robust PER. After a few paired CS-US trials, the CS also began to elicit a conditioned PER. Learning scores were based on the number of CS-induced PERs during the last eight training trials. Eight pairs of the highest or lowest scoring flies were mated together each generation in the bright or dull strains, respectively. The response to selection required several generations to reach an asymptote, suggesting a polygenic basis. After 12 generations, mean scores for the bright and dull strains differed significantly from each other and from that of a free-mated control strain. (Data replotted from ref. 15.) (B) Food-deprived but water-satiated individual blowflies were subjected to a water pretest delivered to the tarsi, followed immediately by tarsal stimulation with sucrose. Flies then were subjected to a tarsal water posttest either 15, 30, 45, or 60 s later. Proboscis extensions to the 15-, 30-, 45-, or 60-s water posttests were given scores of 1, 2, 3, or 4, respectively. Each fly received three trials with each of the four posttest periods. Sensitization scores thus ranged from 0 to 30. Eight pairs of the highest or lowest scoring flies then were mated together in the high or low strains, respectively. The response to selection was nearly complete in one generation, suggesting a one-gene mode of inheritance. After one generation, mean scores for the high and low strains differed significantly from each other and from that of a free-mated control strain. (Data replotted from ref. 16.)
A more comprehensive quantitative genetic analysis (20) also revealed the presence of digenic epistasis among the underlying genes (21). Such nonadditive interactions are notoriously difficult to detect, however (22), so further “neoclassical” crosses between the bright and dull strains were bred. As expected, such data revealed additional epistatic interactions (Table 1). In general, gene interaction (epistasis) seems to be the rule rather than the exception for genes involved with complex traits.
Table 1.
Genetic architecture for classical conditioning (simple or complex models) and sensitization of the PER
| Classical conditioning
|
Sensitization
|
||||
|---|---|---|---|---|---|
| Complex
|
Simple
|
||||
| Parameter | Estimate | Parameter | Estimate | Parameter | Estimate |
| Mid | 40.7 ± 2.5 | Mid | 34.2 ± 0.8 | Mid | 47.4 ± 0.7 |
| a | 22.4 ± 1.1 | a | 22.5 ± 1.1 | a | 22.0 ± 1.1 |
| d | 39.3 ± 5.6 | d | 61.9 ± 13.8 | d | — |
| a·a | — | a·a | 15.8 ± 5.7 | a·a | — |
| a·d | −19.8 ± 4.1 | a·d | −23.4 ± 3.9 | a·d | — |
| d·d | −14.9 ± 4.9 | d·d | −24.0 ± 8.5 | d·d | — |
| am | — | Sex | 1.9 ± 0.5 | ||
| dm | — | ||||
| ax | — | ||||
| dx | 14.2 ± 4.1 | ||||
| ax·ax | — | ||||
| ax·dx | −14.4 ± 5.7 | ||||
| dx·dx | — | ||||
| aax·aax | 18.3 ± 4.4 | ||||
| aax·dax | — | ||||
| axa·dxa | — | ||||
| dax·dax | — | ||||
| Sex | 8.2 ± 1.8 | ||||
The genetic parameters estimated are as follows: Mid, midparent value between high and low strains; a, additive value; d, dominance value; am, additive maternal value; dm, dominance maternal value; ax, X-linked additive value; dx, X-linked dominance value; sex, sex-limited effect; a·a, a·d, etc., two-way epistatic interactions among additive or dominance values.
One exception to this rule was discovered, however, for a simpler, nonassociative form of learning—sensitization of the PER. Asymptotic levels of responses to bidirectional selection were obtained in either one (Fig. 1; ref. 16) or two (23) generations (see ref. 24 for similar experiments in fruit flies). Subsequent quantitative-genetic analyses of data from Mendelian crosses between the high and low sensitization strains (i) repeatedly yielded estimates of just one segregating unit, (ii) revealed that the “high” and “low” sensitization alleles were codominant, and (iii) failed to detect any epistatic interactions (Table 1; ref. 25). Such a simple genetic architecture strongly suggested that a single gene, with two naturally occurring allelic variants, had been identified.
With this insight, it became obvious that the selected high (H) and low (L) sensitization strains and F1 progeny were composed entirely of individuals either homozgous (HH or LL) or heterozygous (HL) for the “sensitization” gene. Could individuals of these three genotypes be identified unambiguously from their behavioral scores? No. In fact, the three distributions of individual sensitization scores overlapped considerably (Fig. 2). Thus, an individual easily could have been genotypically misclassified by its sensitization score.
Figure 2.
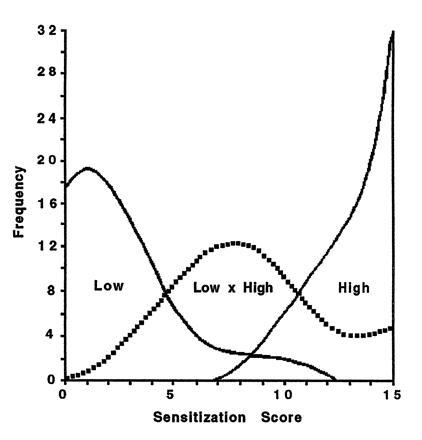
Frequency distribution of individual sensitization scores from selected high and low strains and F1 hybrid progeny (low × high). In spite of a one-gene mode of inheritance, individual scores for each genotype overlap considerably. (Data from ref. 25.)
More generally, such a high degree of variability in phenotypic scores among individuals of the same genotype is a hallmark of behavioral measures. This likely reflects the fact that many genetic and epigenetic (prenatal, nutritional, experiential, experimental, etc.) factors and their interactions define the emergent properties of complex biological functions like behavior. More practically, the presence of so much behavioral variability dictates that a “genotypic value” (for HH, LL or HL flies, for instance) can be estimated accurately only by averaging the scores from many individuals of a given genotype (19).
Bidirectional selection for extreme response levels can reveal functional components of behavior. For sucrose-induced sensitization of the PER, for instance (see Fig. 1B), selection for high levels of response also produced an increase in general, baseline responsiveness to water and revealed a form of water-induced sensitization (26). In the high sensitization strain, baseline responsiveness combined with sucrose-induced sensitization to produce more frequent PER responses, while water-induced sensitization was occluded by sucrose-induced sensitization. Thus, both additive and nonadditive components of behavior were identified.
Since sensitization and associative (excitatory) learning both led to increases in PERs, it seemed possible that sensitization might represent a functional component of classical conditioning. Indeed, cellular and biochemical analyses of sensitization and classical conditioning of the gill-withdrawal reflex of the marine mollusk, Aplysia californica, had suggested that both forms of learning share underlying mechanistic components (27). Consistent with this notion, the bright and dull learning strains displayed higher and lower average sensitization scores, respectively, and a similar relation between sensitization and learning was observed in the high and low sensitization strains (28, 29). Moreover, the correlation between sensitization and learning scores was 0.51 among individuals of the unselected, “wild-type” strain.
From a genetic perspective, this sensitization-learning correlation might have arisen by chance—because separate genes for sensitization and learning were linked and/or individuals in the unselected or selected strains were chosen nonrandomly for breeding. Alternatively, the two behaviors might have been correlated as a result of pleiotropy: the same gene(s) were involved with both biological functions. These alternative explanations were resolved experimentally by determining the sensitization-learning correlation among individuals in the F2 generation of a cross between the high and low sensitization strains (28). In these animals, putatively separate gene correlates of sensitization and learning would recombine and assort independently, thereby diminishing the phenotypic correlation. Alternatively, if the same set of genes underlay both behaviors, then the phenotypic correlation among F2 individuals would persist. The latter outcome was obtained for sensitization and classical conditioning of the PER; the correlation remained at 0.55 in the F2 population (28). Thus, the single gene involved with sensitization appeared to have a pleiotropic effect on associative learning.
A noteworthy counterexample exists. Rosenzweig et al. (30) measured a difference in brain acetylcholine levels between Tolman’s maze-bright and maze-dull rats (4), thereby provoking the conclusion that differences in learning ability were caused by differences in this neurotransmitter’s levels. The acetylcholine-learning correlation disappeared, however, in the F2 generation of a cross between the maze-bright and maze-dull rats (31).
This experimental strategy to identify genes involved with learning in blowflies has met C. S. Hall’s goals (3) only marginally. A bidirectional response to selection for conditioning of the PER certainly indicated that extreme levels of behavioral responses could be inherited (goal 1). Further breeding studies, such as hybrid crosses between the bright- and dull-learning lines, provided a crude description of the “genetic architecture” underlying conditioned PER responses but failed to resolve the contributions of individual genes (goal 2). In the absence of such knowledge, efforts to map the genes (goal 3) or to determine their biological functions (goal 4) were not possible. Even in the genetically simpler case of sensitization, where only one gene with codominant alleles was detected, mapping the locus first would require the identification of molecular, morphological or cytological markers. The task then would prove daunting because of the overlapping phenotypic scores associated with each genotype (see Fig. 2).
As a top-down approach, quantitative-genetic analysis generally is limited in three ways. First, bidirectional selection for extreme behavioral responses accumulates “high” or “low” alleles across all the relevant gene loci. As a result, only the “net effects” of gene action, averaged over all the loci, can be estimated. An important consequence of this limitation is that opposing effects at individual loci can average out across all loci to yield a net effect of zero. When such “silent” genetic effects are ignored in the analysis, they can bias to an unkown degree estimates of the detectable genetic effects.
Second, naturally occurring alleles tend to effect a gene’s function only mildly. Alleles with more severe effects on gene function are much less frequent, primarily because they act to reduce the fitness of individuals that inherit them. Consequently, these severe alleles are selected against in most “wild-type” populations. The more prevalent mild alleles yield a weak signal-to-noise ratio in quantitative-genetic analyses.
Third, the quantitative-genetic method only can detect genes with naturally occurring allelic variation (i.e., with two or more alleles) in the foundation population. Evolutionary geneticists have outlined scenarios in which pleiotropic or epistatic effects or heterogeneous selection pressures can lead to balanced polymorphisms, thereby maintaining allelic variation for some genes. These are the genes on which bidirectional selection works. Selection pressures also can act directionally, however, leading to the elimination of all but the “best” allele at some gene loci. These “fixed” genes will not contribute to bidirectional selection and, thus, are undetectable in quantitative-genetic analyses. Such “silent genes” nevertheless may interact epistatically with other genes involved with the trait, again producing inaccurate estimates of the underlying genetic architecture.
Net effects, poor signal-to-noise ratio, and the likely presence of silent genes all served to limit this top-down approach’s ability to resolve the genetic bases of complex traits. Nevertheless, the method has yielded important facts and concepts about learning. Bidirectional selection worked, thereby demonstrating a genetic basis for behavioral plasticity. Analyses of hybrid crosses suggested that sensitization and classical conditioning of the PER were mechanistically related but that each possessed different genetic architectures. Selection for extreme levels of PER revealed subtler aspects of PER, giving rise to the notion of component behaviors.
Genetic Dissection A La Single-Gene Mutants
Seymour Benzer at CalTech (Pasadena, CA) stepped into this gestalt of behavior-genetic analysis with a new idea: A more complete “genetic dissection” of behavior might be achieved by using chemical mutagens to disrupt single genes (see ref. 32 for a history). Mutant strains composed of individuals all carrying the same single-gene mutation then could be screened for abnormal behaviors (33). This “bottom-up” approach solved each of the three limitations of the quantitative-genetic method just mentioned. (i) The effects on a particular trait of single-gene mutations could be quantified one at a time. Even specific epistatic interactions were quantifiable by breeding defined double-mutant combinations. (ii) The (chemical) mutagenesis was able to generate strong mutations, thereby improving the signal-to-noise ratio. (iii) All genes involved with a trait—either fixed or polymorphic in the parental strain—could be identified, since the mutations were created at random. A drawback of this approach, however, was its dependence on the availability of fairly sophisticated genetic tools (i.e., morphological or cytological markers, balancer chromosomes) with which to isolate single-gene mutations. For such behavior-genetic analyses, the fruit fly Drosophila melanogaster seemed the obvious choice.
Benzer (34) initiated this experimental approach with a screen for single-gene mutations affecting phototaxis using a countercurrent apparatus that permitted the mass screening of hundreds of flies at a time. After this initial success, the countercurrent apparatus was modified to associate electroshock with an odor cue. This instrumental conditioning QHB procedure constituted the first valid claim for associative learning in Drosophila and again capitalized on the notion of screening flies en masse (35, 36, 37). Finally, a Pavlovian conditioning procedure was developed to manipulate better the odor and shock presentations and to allow direct comparisons of the behavioral properties of associative learning among Drosophila and other vertebrate and invertebrate species (38). The Pavlovian procedure yielded strong conditioned odor avoidance responses immediately after training and, consequently, robust memory retention lasting (i) up to 1 day after one training session, (ii) up to 4 days after 10 massed training sessions, or (iii) at least 1 week after 10 spaced training sessions (Fig. 3; refs. 37 and 38). Spaced training-induced week-long memory also was suppressed by an inhibitor of protein synthesis (cycloheximide), thereby suggesting that the biochemistry of long-term memory formation in fruit flies was similar to that observed in other animal species (39).
Figure 3.
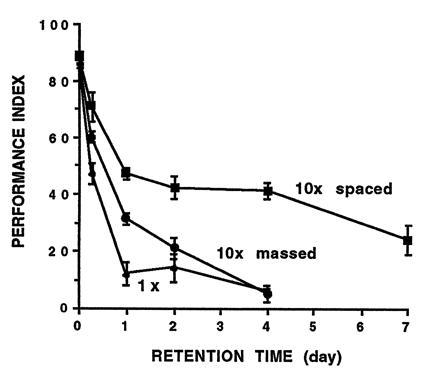
Memory retention after Pavlovian olfactory learning in fruit flies. During one training session (1×), about 100 flies were exposed sequentially to two odors (CSs) piped through the training chamber on air currents. During the first odor presentation, but not during the second, flies received 12 1-s pulses of footshock (US). Massed training (10× massed) consisted of 10 of these training sessions one after the other. Spaced training (10× spaced) consisted of 10 training sessions with a 15-min rest interval between each session. Conditioned odor avoidance responses were tested at various times after training by transferring the flies to the choice-point of a T-maze, where they were exposed to convergent currents of air carrying the odors used during training. Odor concentrations were adjusted for these conditioning experiments so that untrained flies distributed themselves 50:50. At most retention times after training, however, a majority of flies avoided the shock-paired odor. For a complete experiment, a second group of 100 flies was trained to the reciprocal odor combination. The performance index was an average of reciprocally trained groups and was calculated to be zero if flies distributed themselves 50:50 or 100 if all flies avoided the shock-paired odor. (Data from ref. 37; also see ref. 38 for more procedural details.)
To date, 10 genes have been identified from four separate mutant screens for abnormal olfactory learning. The first three mutageneses used the chemical mutagen, ethylmethane sulfonate, while the fourth was accomplished via P element transposition (40, 41, 42, 43, 44, 45). Mutant dunce flies were obtained at CalTech, and rutabaga, radish, turnip, and cabbage mutants were found at Princeton University (Princeton, NJ), in screens for learning mutants using the QHB procedure (40, 46, 47, 48, 49). Mutant amnesiac flies were identified at Princeton University in a screen for abnormal memory retention after training with a modification (extended training) of the QHB procedure (42). Mutant latheo, linotte, nalyot, and golovan flies were isolated at Brandeis University (Waltham, MA) in a screen for abnormal memory retention after training with the Pavlovian procedure (refs. 45 and 50; unpublished data).
Learning and memory scores after Pavlovian training have been quantified for each of these mutants (refs. 37, 38, 45, and 50, 51, 52; unpublished data). Comparisons of the memory decay curves among these mutant and wild-type (parental) flies have suggested that newly acquired information can be processed through five successive temporal phases (Fig. 4): LRN, STM, MTM, ARM, and LTM. The primary effects of mutations in (i) latheo or linotte, (ii) dunce or rutabaga, (iii) amnesiac, or (iv) radish are disruptions of LRN, STM, MTM, and ARM, respectively—with secondary effects on any “downstream” memory phases. Memory formation in radish mutants revealed an interesting exception, however. ARM was disrupted, but LTM formed normally. Thus, analysis of this mutant strain revealed an important genetic dissection of the underlying biology of memory formation: ARM and LTM are parallel memories that exist independently of each other.
Figure 4.
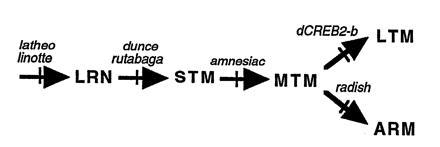
Information processing during memory formation after Pavlovian olfactory learning. Newly acquired information (LRN) first is processed sequentially through short-term memory (STM) and middle-term memory (MTM) phases. Then information processing branches into two functionally independent phases: anesthesia-resistant memory (ARM) and long-term memory (LTM). Massed training induces LRN, STM, MTM, and ARM, whereas spaced training induces LTM along with similar amounts of LRN, STM, MTM, and ARM. Different single-gene mutants (latheo, linotte, dunce, rutabaga, amnesiac, and radish) disrupt this process at different steps. Notably, the radish mutation disrupts ARM without affecting LTM, and the protein synthesis inhibitor cycloheximide (CXM) or inducible dominant-negative CREB transgenes (dCreb2-b) disrupt LTM without affecting any other aspect of learning or memory. Thus, ARM and LTM appear to be functionally independent, parallel memory phases. (Data from ref. 37.)
An example of memory retention curves is shown in Fig. 5A for homozygous dunceM11 mutants and their parental (wild-type) strain. These data show clearly that the dunceM11 mutation disrupts both learning and memory. The mean scores of wild-type and mutant flies accurately estimate their respective genotypic values for two reasons. First, flies heterozygous for the dunceM11 X chromosome were backcrossed repeatedly (at least five generations) to wild-type flies, thereby “equilibrating” allelic frequencies at all other relevant gene loci in the heterogeneous “genetic background.” (For dunce and other ethylmethane sulfonate-induced point mutations, this equilibration of genetic background was accomplished only for unlinked loci. For transposon-tagged mutations, such as latheo, linotte, golovan, and nalyot, equilibration included all linked loci.) Second, each mean score was calculated from a minimum of 1200 individuals (see Fig. 3 legend), which ensures statistically similar samplings of the genetic background for each genotype. With genotypic values appropriately estimated in this manner, the difference between mean scores of wild-type and mutant flies represents a quantitative assessment of the “average effect” of the dunceM11 mutation in homozygous flies.
Figure 5.
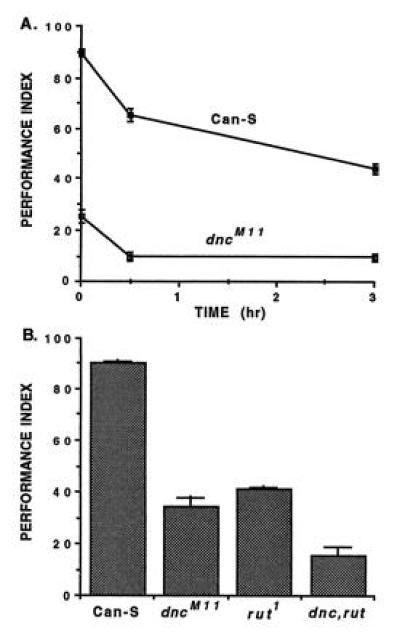
Olfactory learning and memory in normal and mutant flies. (A) Memory retention in wild-type (Can-S) flies or dunceM11 mutants. Each point represents the average avoidance responses of about 1200 individuals. The genetic backgrounds of each strain were heterogeneous and equilibrated, so the difference between mean scores represents the average effect of the dunceM11 mutation in homozygotes (see text). (Data from ref. 52.) (B) Learning in wild-type (Can-S), dunceM11 (dncM11) or rutabaga1 (rut1) single-gene mutants and dunceM11 rutabaga1 (dnc, rut) double-mutants. The learning defect in the double mutant is more severe than either single mutant, revealing a quantitative, polygenic basis for olfactory learning. (Data from ref. 38.)
Biochemically, the dunceM11 mutation is known to be amorphic (51). Thus, Fig. 5A serves to illustrate an additional generality concerning single-gene mutant analysis: it is possible to obtain viable adults that still show some associative learning or memory, even though they are homozygous for a complete loss-of-function mutation in one of the underlying genes. From a genetic perspective, this implies a certain “redundancy” or parallel processing. These concepts themselves imply that more than one gene is involved with associative learning/memory—that the trait is polygenic. Importantly, hypomorphic mutations of dunce also yield partial (quantitative) defects in associative learning (52). Thus, knowledge of the biochemical function of a mutant gene product is necessary for proper interpretation of its average effect on learning/memory.
That associative learning has a polygenic basis also can be demonstrated with the single-gene mutant approach. Fig. 5B depicts the learning scores for wild-type flies, dunceM11 or rutabaga1 homozygotes, and dunceM11 rutabaga1 double mutants (38). [The rutabaga1 mutation also is known to be amorphic (53); thus viable adults are possible even from flies homozygous for two loss-of-function mutations in underlying genes!] The average effect is greater for the double-mutant genotype than for either single-gene genotype, thereby revealing the cummulative (quantitative) effects of more than one gene on learning.
Because of the genetic tools available in Drosophila, biochemical deficiencies were identified first for dunce and rutabaga mutants (46, 47). The biochemical defects then led to the molecular cloning of these genes, which confirmed the former to be a cAMP-specific phosphodiesterase and the latter to be an adenylyl cyclase (53, 54). Since the original dunce and rutabaga mutants were isolated independently in a screen for olfactory learning defects, these convergent molecular/biochemical data strongly implicated a role for the cAMP second messenger pathway in associative learning/memory—a conclusion also obtained from experiments on Aplysia (55).
The discovery that the cAMP second messenger system was involved with olfactory learning in fruit flies launched more focused studies of genes known to encode other components of the pathway. In many cellular systems, adenylyl cyclase is stimulated or inhibited via a GTP-binding protein (Gs or Gi, respectively), which itself is activated by the interaction of extracellular signals with cell-surface receptors (56). In fact, coincident activation of adenylyl cyclase by Gs and calcium is considered a possible molecular mechanism for associative learning (57). Consistent with this view, we recently have expressed in reverse-genetic fashion a mutant, constitutively activated Gs in otherwise normal flies and have observed a complete abolition of olfactory learning (J. B. Connolly, I. J. H. Roberts, K. Kaiser, M. Forte, T.T., and C. J. O’Kane, unpublished work).
Mutations in a cAMP-dependent protein kinase A (PKA) or one of its regulatory subunits (RI) also disrupt olfactory learning (refs. 58 and 59; S. F. Goodwin, M. Del Vecchio, S. R. H. Russell, C. Hogel, T.T., and K. Kaiser, unpublished work). The earliest and clearest indication that PKA was involved in olfactory learning, however, was derived from reverse-genetic experiments, in which endogenous PKA activity was inhibited via transgenic expression of an inhibitor peptide (or from transgenic overexpression of a catalytic subunit or a mammalian RII regulatory subunit; ref. 60).
Importantly, this experiment demonstrated the value of inducible transgenes to the study of learning and memory. Otherwise normal (wild-type) flies were raised to adulthood in the absence of appreciable transgenic expression. Expression of the transgene then was induced just a few hours before training by subjecting the flies to a heat-shock (37°C for 1 hr). In the absence of any heat shock treatment, these transgenic flies showed normal olfactory learning/memory. After heat-shock, in contrast, learning and memory were disrupted—indicating that maldevelopment was not responsible for the adult learning defect and, alternatively, that PKA functioned in the adult during the learning/memory process.
In the Aplysia model system, a cytoplasmic target of cAMP-activated PKA is a potassium channel. Phosphorylation closes this K channel, thereby extending the time required for the neuron to repolarize after generating an action potential (55). Again, the parallel. Flies homozygous for a mutation in the Shaker gene, which is known to encode a potassium channel (61), show olfactory learning/memory deficits (62).
In other cell biological systems, the CREB transcription factor is known to be a nuclear target of activated PKA (63). Up-regulation of the cAMP pathway leads to a translocation of PKA into the nucleus and phosphorylation of CREB (64, 65, 66). Phosphorylated-CREB then regulates a cascade of downstream genes, which is correlated with a synaptic growth process that may contribute to facilitated synaptic transmission (66, 67, 68, 69). Thus, CREB appears to occupy a key step in the cAMP pathway, regulating the synthesis of proteins required for long-term synaptic plasticity (see above).
To test this notion at the behavioral level, a fly homolog of rat CREB was cloned (70). This dCREB2 gene was alternatively spliced into several isoforms, one of which was shown in cell culture to act as an activator of CRE-mediated gene transcription, the other of which was shown to act as a repressor of the activator. Again in reverse-genetic fashion, strains of flies carrying inducible transgenes encoding either the CREB-a activator or the CREB-b repressor then were bred (71, 72).
In the absence of heat-shock, adults from these transgenic flies showed normal LTM (7-day memory) after spaced training and a normal lack of LTM after only one training session (Fig. 6), indicating minimal effects from any leaky expression of the transgene during development. When these transgenic flies were exposed to a 30-min heat shock 3 hr before spaced training, however, dramatic effects were obtained. Induced expression of CREB-b completely suppressed, while induced expression of CREB-a enhanced, the formation of LTM (Fig. 6). Interestingly, the enhancement of LTM did not show itself as an increase in LTM levels. Rather, induced expression of CREB-a permitted the formation of LTM after one, instead of the usual 10 spaced, training sessions.
Figure 6.
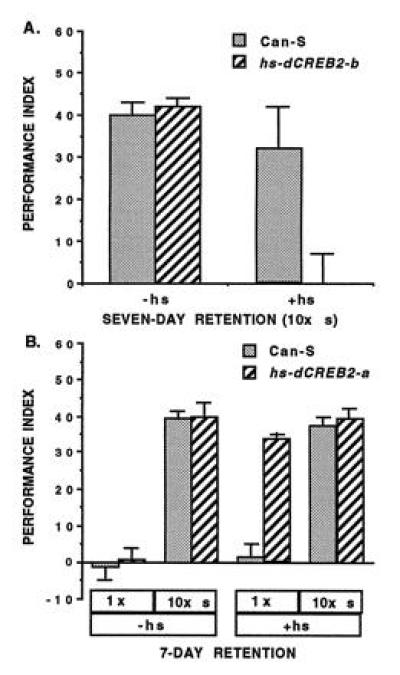
LTM formation in normal flies or transgenic flies carrying inducible CREB transgenes. (A) CREB repressor blocks LTM. Seven-day retention after 10× spaced training in wild-type (Can-S) flies or transgenic flies carrying a heat-shock inducible CREB repressor (hs-dCREB2-b). LTM formation is normal in transgenic flies in the absence of heat shock (−hs), indicating that no developmental defects impinge on LTM. In contrast, LTM formation is completely blocked in transgenic flies when trained 3 hr after a 30-min heat shock induction (+hs) of CREB repressor. (B) CREB activator enhances LTM. Seven-day retention in wild-type (Can-S) flies or transgenic flies carrying a heat-shock inducible CREB activator (hs-dCREB2-a). LTM formation is normal after 10× spaced training, or normally absent after 1× training, in transgenic flies in the absence of heat shock (−hs), indicating that no developmental defects impinge on LTM. When subjected to 10× spaced training 3 hr after a 30-min heat shock induction of CREB activator (+hs), LTM formation is neither enhanced or suppressed in transgenic flies. LTM forms after only one training session, however, in transgenic flies after such heat shock. Thus, induced expression of CREB activator enhances LTM by promoting its formation after less training. [Data from refs. 71 and 72 (Copyright 1994 and 1995, Cell Press).]
These opposing effects of CREB-a and CREB-b were specific to LTM formation. Learning and earlier memory formation were normal after induced expression of both these transgenes, as were the flies’ responses to the odors and footshock used in the Pavlovian experiments. Thus, CREB appears to act as a “molecular switch” for the induction of LTM formation (73). In normal flies, this switch is balanced between “on” and “off,” acting as an information filter to induce LTM only after repeated, spaced training sessions. In induced CREB-a flies, the switch is forced on, producing LTM after only one training session. In induced CREB-b flies, the switch is forced off, preventing the formation of LTM even after multiple spaced training sessions. This combination of forward- and reverse-genetic experiments constitutes a rather persuasive argument in favor of a role for cAMP signaling during associative learning and memory formation.
Conclusions
Without question, our understanding of the biological organization of learning and memory and of the biochemical action of underlying genes has improved significantly from analyses of single-gene mutants in fruit flies. This paradigmatic shift in the analysis of learning/memory, which now includes gene disruptions in mice (see ref. 74), benefits nevertheless from insights gained from earlier behavior-genetic analyses. These latter studies showed repeatedly that many interacting genes contribute to behavioral traits and that naturally occurring alleles usually produce only mild effects.
Why is this the general rule (to which, of course, there are exceptions)? First, gene interaction obtains because behavior emerges at the most complex level of biological organization. Learning, moreover, is even more complex, since it is an unobservable “metabehavior” that serves to organize and tailor behavioral responses of individuals. In this high-level biological context, genes involved with many developmental and cellular processes interact to produce a plastic nervous system. Second, due to the presence of gene interaction, mild allelic variation at some of these interacting gene loci is likely to produce enormous effects on behavioral variation. In contrast, severe mutations are likely to ramify widely to reduce viability. Hence, their absence from the “normal” genotypic variability among wild-type individuals. This process is likely to explain why many homozygous single-gene mutants that disrupt learning/memory tend to accumulate changes in their genetic backgrounds over generations of free mating that ameliorate the severity of their behavioral deficits (cf. ref. 50).
The success of genetic dissection with single-gene mutants lies primarily in the creation of strong alleles via chemical or transposon mutagenesis (or targeted gene disruption), thereby increasing the signal of a particular gene amongst the noise of other polygenic contributions. In addition, mutagenesis creates lesions at gene loci that may not have been polymorphic in the (any) natural population. Strict control of breeding in laboratory strains then permits the maintenance of these severe mutations in spite of their potential effects on viability.
With increased signal-to-noise in a polygenic background, the effects of single-gene mutations can be studied at any level of biological organization. Since animals of known genotype (for the locus under study) are bred systematically, the experimenter can infer “logical causation” about the differential effects between mutant and wild-type alleles. In addition, when experiments are designed to study different functions of the same gene (molecular, biochemical, cellular, anatomical, behavioral), the systematic manipulation of genotype allows an integration of gene action across levels of biological organization.
Single-gene mutant analysis can be informative, however, only when pursued within the framework of interacting polygenes. Quantitative assessments of mutant versus wild-type flies, for instance, are accurate only after equilibration of genetic backgrounds (allelic variation at other polygenes) in the two strains. If the genetic background is heterogenic, then the difference between mean scores of the two strains will represent the average effect of the mutant genotype. If the genetic background is inbred (or isogenic) equilibration is not necessary–but the mutant genotype will be quantified in only one possible polygenic milieu. The resulting difference between mean scores of mutant and wild-type strains, then does not constitute an average effect.
Single-gene mutant analyses of learning frequently have uncovered pleiotropic effects. Mutant dunce2 females, for instance, are sterile (46), and dunce mutants are extremely inviable if dunce+ is not supplied maternally (75). Observations such as these, in fact, should be expected when dealing with an underlying architecture of interacting polygenes. Moreover, they suggest that behavior-specific genes may be quite rare (see ref. 76).
Because many genes likely are to be involved in both development and adult function, reverse-genetic approaches represent a significant advance in behavior-genetic research. Restricting the expression of a linotte+ transgene to just 3 hr before training, for instance, nevertheless yielded full “rescue” of the mutant learning/memory defect in linotte mutants (77). Thus, maldevelopment was not responsible for the learning defect in mutant adults. Conversely, restricting the expression of a mutant Gs protein to the mushroom body brain anatomical region was sufficient to disrupt olfactory learning completely (J. B. Connolly, I. J. H. Roberts, K. Kaiser, M. Forte, T.T., and C. J. O’Kane, unpublished work). Thus, G protein-mediated signaling only in this specific region of the brain was required for normal olfactory learning.
Since learning is a metabehavior that only can be defined by what it is not, the potential for pleiotropic effects further demands the design of task-relevant measures (controls) for the sensorimotor responses upon which associative learning depends. For both the linotte rescue and mutant Gs experiments, for instance, naive responses to odors and footshock were shown to be normal. In this manner, valid and specific conclusions can be drawn from experimental manipulations of genes involved with learning and memory.
The top-down approach of behavior-genetic analysis revealed another important concept: Complex traits can be composed of genetically distinct component functions. This perspective fueled the discovery of component responses in sensitization experiments on blowflies and of component memory phases in olfactory learning experiments on fruit flies. In both cases, some functional components were found to be independent of, and some dependent on, other components. This reveals the biological organization of behavior.
The bottom-up approach to the study of learning and memory is grounded in the experimental power of modern molecular biology. At its conceptual heart is the iterative and integrative study of biologically meaningful units (gene products) at multiple levels of biological organization. When applied thoughtfully from an enlightened view of gene action, genetic dissection will continue to resolve the biobehavioral organization of learning and memory (and other behaviors) in spite of their complexity.
Acknowledgments
I thank Jerry Hirsch and Seymor Benzer for illuminating the path for those of us that followed. The views expressed herein result from many insightful conversations with my colleagues, namely Jeff Hall, Ralph Greenspan, Chip Quinn, and Jerry Yin. This work has been supported over the years by several grants from the National Institutes of Health, the McKnight Foundation, and the John Merck Foundation.
Footnotes
The publication costs of this article were defrayed in part by page charge payment. This article must therefore be hereby marked “advertisement” in accordance with 18 U.S.C. §1734 solely to indicate this fact.
Abbreviations: PER, proboscis extension repsonse; H and L, high and low sensitization strain, respectively; LRN, newly acquired information; STM, short-term memory; MTM, middle-term memory; ARM, anesthesia-resistant memory; LTM, long-term memory; CS, chemosensory stimulus; US, sucrose stimulus; PKA, protein kinase A.
References
- 1.Darwin C. The Descent of Man and Selection in Relation to Sex. London: John Murray; 1871. [Google Scholar]
- 2.Galton F. Hereditary Genius: An Inquiry into Its Laws and Consequences. London: Macmillan; 1869. [Google Scholar]
- 3.Hall C S. In: Handbook of Experimental Psychology. Stevens S S, editor. New York: Wiley; 1951. pp. 304–329. [Google Scholar]
- 4.Tolman E C. J Comp Psychol. 1924;4:1–18. [Google Scholar]
- 5.Tryon R C. Yearbook Natl Soc Stud Edu. 1940;39:111–119. [Google Scholar]
- 6.Hirsch J. In: Roots of Behavior: Genetics, Instinct, and Socialization in Animal Behavior. Bliss E L, editor. New York: Hoeber; 1962. pp. 3–23. [Google Scholar]
- 7.Hirsch J. Science. 1963;142:1436–1442. doi: 10.1126/science.142.3598.1436. [DOI] [PubMed] [Google Scholar]
- 8.Hirsch J. In: Behavior-Genetic Analysis. Hirsch J, editor. New York: McGraw–Hill; 1967. pp. 416–435. [Google Scholar]
- 9.Hirsch J, Boudreau J C. J Comp Physiol Psychol. 1958;51:647–651. doi: 10.1037/h0039498. [DOI] [PubMed] [Google Scholar]
- 10.Erlenmeyer-Kimling L, Hirsch J, Weiss J M. J Comp Physiol Psychol. 1962;55:722–731. doi: 10.1037/h0039714. [DOI] [PubMed] [Google Scholar]
- 11.Ricker J, Hirsch J. J Comp Psychol. 1985;99:380–390. [PubMed] [Google Scholar]
- 12.Yeatman F R, Hirsch J. Anim Behav. 1971;19:454–462. doi: 10.1016/s0003-3472(71)80098-2. [DOI] [PubMed] [Google Scholar]
- 13.Tully T. Behav Genet. 1986;16:449–455. doi: 10.1007/BF01074264. [DOI] [PubMed] [Google Scholar]
- 14.Nelson M C. J Comp Physiol Psychol. 1971;77:353–368. doi: 10.1037/h0031882. [DOI] [PubMed] [Google Scholar]
- 15.McGuire T R, Hirsch J. Proc Natl Acad Sci USA. 1977;74:5193–5197. doi: 10.1073/pnas.74.11.5193. [DOI] [PMC free article] [PubMed] [Google Scholar]
- 16.McGuire T R. Behav Genet. 1981;11:607–608. doi: 10.1007/BF01070815. [DOI] [PubMed] [Google Scholar]
- 17.Zawistowski S L, Hirsch J. Anim Learn Behav. 1984;12:402–408. [Google Scholar]
- 18.Lofdahl K L, Holliday M, Hirsch J. J Comp Psychol. 1992;106:172–183. doi: 10.1037/0735-7036.106.2.172. [DOI] [PubMed] [Google Scholar]
- 19.Falconer D S. Introduction to Quantitative Genetics. New York: Ronald Press; 1972. [Google Scholar]
- 20.Mather K, Jinks J L. Biometrical Genetics: The Study of Continuous Variation. London: Chapman & Hall; 1982. [Google Scholar]
- 21.McGuire T R, Tully T. Behav Genet. 1987;17:97–107. doi: 10.1007/BF01066014. [DOI] [PubMed] [Google Scholar]
- 22.Wahlsten D. Behav Brain Sci. 1990;13:109–120. [Google Scholar]
- 23.Tully T, Hirsch J. Behav Genet. 1982;12:395–415. doi: 10.1007/BF01065632. [DOI] [PubMed] [Google Scholar]
- 24.Vargo M, Hirsch J. Behav Neurosci. 1985;99:323–332. doi: 10.1037//0735-7044.99.2.323. [DOI] [PubMed] [Google Scholar]
- 25.Tully T. Anim Behav. 1982;30:1193–1202. [Google Scholar]
- 26.Tully T, Hirsch J. Behav Neurosci. 1983;97:145–153. doi: 10.1037//0735-7044.97.1.146. [DOI] [PubMed] [Google Scholar]
- 27.Kandel, E. R., Klein, M., Hochner, B., Shuster, M., Siegelbaum, S. A., Hawkins, R. D., Glanzman, D. L., Castellucci, V. F. & Abrams, T. W. (1987) Synaptic Function 471–518.
- 28.Tully T, Zawistowski S L, Hirsch J. Behav Genet. 1982;12:181–191. doi: 10.1007/BF01065764. [DOI] [PubMed] [Google Scholar]
- 29.McGuire T R. Behav Genet. 1983;13:509–515. doi: 10.1007/BF01065926. [DOI] [PubMed] [Google Scholar]
- 30.Rosenzweig M R, Krech D, Bennett E L. In: Biological and Biochemical Bases of Behavior. Harlow H F, Woolsey C N, editors. Madison, WI: Univ. Wisconsin Press; 1958. pp. 367–400. [Google Scholar]
- 31.Rosenzweig M R, Krech D, Bennett E L. Psychol Bull. 1960;57:476–492. doi: 10.1037/h0044689. [DOI] [PubMed] [Google Scholar]
- 32.Greenspan R J. Semin Neurosci. 1990;2:145–157. [Google Scholar]
- 33.Benzer S. Sci Am. 1973;229:24–37. doi: 10.1038/scientificamerican1273-24. [DOI] [PubMed] [Google Scholar]
- 34.Benzer S. Proc Natl Acad Sci USA. 1967;58:1112–1119. doi: 10.1073/pnas.58.3.1112. [DOI] [PMC free article] [PubMed] [Google Scholar]
- 35.Quinn W G, Harris W A, Benzer S. Proc Natl Acad Sci USA. 1974;71:707–712. doi: 10.1073/pnas.71.3.708. [DOI] [PMC free article] [PubMed] [Google Scholar]
- 36.Tully T. Behav Genet. 1984;14:527–557. doi: 10.1007/BF01065446. [DOI] [PubMed] [Google Scholar]
- 37.Tully T, Preat T, Boynton S C, Del Vecchio M. Cell. 1994;79:35–47. doi: 10.1016/0092-8674(94)90398-0. [DOI] [PubMed] [Google Scholar]
- 38.Tully T, Quinn W G. J Comp Physiol A. 1985;157:263–277. doi: 10.1007/BF01350033. [DOI] [PubMed] [Google Scholar]
- 39.DeZazzo J, Tully T. Trends Neurosci. 1995;18:212–217. doi: 10.1016/0166-2236(95)93905-d. [DOI] [PubMed] [Google Scholar]
- 40.Dudai Y, Jan Y-N, Byers D, Quinn W, Benzer S. Proc Natl Acad Sci USA. 1976;73:1684–1688. doi: 10.1073/pnas.73.5.1684. [DOI] [PMC free article] [PubMed] [Google Scholar]
- 41.Aceves-Pina E O, Quinn W G. Science. 1979;206:93–96. doi: 10.1126/science.206.4414.93. [DOI] [PubMed] [Google Scholar]
- 42.Quinn W, Sziber P P, Booker R. Nature (London) 1979;277:212–214. doi: 10.1038/277212a0. [DOI] [PubMed] [Google Scholar]
- 43.Booker R, Quinn W G. Proc Natl Acad Sci USA. 1981;78:3940–3944. doi: 10.1073/pnas.78.6.3940. [DOI] [PMC free article] [PubMed] [Google Scholar]
- 44.Duerr J S, Quinn W G. Proc Natl Acad Sci USA. 1982;79:3646–3650. doi: 10.1073/pnas.79.11.3646. [DOI] [PMC free article] [PubMed] [Google Scholar]
- 45.Boynton S, Tully T. Genetics. 1992;131:655–672. doi: 10.1093/genetics/131.3.655. [DOI] [PMC free article] [PubMed] [Google Scholar]
- 46.Byers D, Davis R L, Kiger J A., Jr Nature (London) 1981;289:79–81. doi: 10.1038/289079a0. [DOI] [PubMed] [Google Scholar]
- 47.Livingstone M S, Sziber P P, Quinn W G. Cell. 1984;137:205–215. doi: 10.1016/0092-8674(84)90316-7. [DOI] [PubMed] [Google Scholar]
- 48.Choi K-W, Smith R F, Buratowski R M, Quinn W G. J Biol Chem. 1991;266:15999–16006. [PubMed] [Google Scholar]
- 49.Folkers E, Drain P F, Quinn W G. Proc Natl Acad Sci USA. 1993;90:8123–8127. doi: 10.1073/pnas.90.17.8123. [DOI] [PMC free article] [PubMed] [Google Scholar]
- 50.Dura J M, Preat T, Tully T. J Neurogenet. 1993;9:1–14. doi: 10.3109/01677069309167272. [DOI] [PubMed] [Google Scholar]
- 51.Tully T. In: Neurobiology of Learning, Emotion and Affect. Madden J, IV, editor. New York: Raven; 1991. pp. 30–66. [Google Scholar]
- 52.Tully T, Gold D. J Neurogenet. 1993;9:55–71. doi: 10.3109/01677069309167275. [DOI] [PubMed] [Google Scholar]
- 53.Levin L R, Han P-L, Hwang P M, Feinstein P G, Davis R L, Reed R R. Cell. 1992;68:479–489. doi: 10.1016/0092-8674(92)90185-f. [DOI] [PubMed] [Google Scholar]
- 54.Chen C-N, Denome S, Davis R L. Proc Natl Acad Sci USA. 1986;83:9313–9317. doi: 10.1073/pnas.83.24.9313. [DOI] [PMC free article] [PubMed] [Google Scholar]
- 55.Byrne J H, Kandel E R. J Neurosci. 1996;16:425–435. doi: 10.1523/JNEUROSCI.16-02-00425.1996. [DOI] [PMC free article] [PubMed] [Google Scholar]
- 56.Neer E. Cell. 1995;80:249–257. doi: 10.1016/0092-8674(95)90407-7. [DOI] [PubMed] [Google Scholar]
- 57.Anholt R R. Trends Neurosci. 1994;17:37–41. doi: 10.1016/0166-2236(94)90033-7. [DOI] [PubMed] [Google Scholar]
- 58.Skoulakis E M C, Kalderon D, Davis R L. Neuron. 1993;11:197–208. doi: 10.1016/0896-6273(93)90178-t. [DOI] [PubMed] [Google Scholar]
- 59.Li W, Tully T, Kalderon D. Learn Mem. 1996;2:320–333. doi: 10.1101/lm.2.6.320. [DOI] [PubMed] [Google Scholar]
- 60.Drain P, Folkers E, Quinn W G. Neuron. 1991;6:71–82. doi: 10.1016/0896-6273(91)90123-h. [DOI] [PubMed] [Google Scholar]
- 61.Tempel B L, Papazian D M, Schwarz T L, Jan Y N, Jan L Y. Science. 1987;237:770–775. doi: 10.1126/science.2441471. [DOI] [PubMed] [Google Scholar]
- 62.Cowan T, Siegel R W. J Neurogenet. 1986;3:187–201. doi: 10.3109/01677068609106849. [DOI] [PubMed] [Google Scholar]
- 63.deGroot R P, Sassone-Corsi P. Mol Endocrinol. 1993;7:145–153. doi: 10.1210/mend.7.2.8385737. [DOI] [PubMed] [Google Scholar]
- 64.Backsai B J, Hochner B, Mahaut-Smith M, Adams S R, Kaang B-K, Kandel E R, Tsien R Y. Science. 1993;260:222–226. doi: 10.1126/science.7682336. [DOI] [PubMed] [Google Scholar]
- 65.Kaang B K, Kandel E R, Grant S G. Neuron. 1993;10:427–435. doi: 10.1016/0896-6273(93)90331-k. [DOI] [PubMed] [Google Scholar]
- 66.Impey S, Mark M, Villacres E C, Poser S, Chavkin C, Storm D. Neuron. 1996;16:973–982. doi: 10.1016/s0896-6273(00)80120-8. [DOI] [PubMed] [Google Scholar]
- 67.Dash P, Hochner B, Kandel E R. Nature (London) 1990;345:718–721. doi: 10.1038/345718a0. [DOI] [PubMed] [Google Scholar]
- 68.Alberini C M, Ghirardi M, Metz R, Kandel E R. Cell. 1994;76:1099–1114. doi: 10.1016/0092-8674(94)90386-7. [DOI] [PubMed] [Google Scholar]
- 69.Bartsch D, Ghirardi M, Skehel P A, Karl K A, Herder S P, Chen M, Bailey C H, Kandel E R. Cell. 1995;83:956–992. doi: 10.1016/0092-8674(95)90213-9. [DOI] [PubMed] [Google Scholar]
- 70.Yin J C P, Wallach J S, Wilder E L, Klingensmith J, Dang D, Perrimon N, Zhou H, Tully T, Quinn W G. Mol Cell Biol. 1995;15:5123–5130. doi: 10.1128/mcb.15.9.5123. [DOI] [PMC free article] [PubMed] [Google Scholar]
- 71.Yin J C P, Wallach J S, Del Vecchio M, Wilder E L, Zhou H, Quinn W G, Tully T. Cell. 1994;79:49–58. doi: 10.1016/0092-8674(94)90399-9. [DOI] [PubMed] [Google Scholar]
- 72.Yin J C P, Vecchio M D, Zhou H, Tully T. Cell. 1995;81:107–115. doi: 10.1016/0092-8674(95)90375-5. [DOI] [PubMed] [Google Scholar]
- 73.Yin J C P, Tully T. Curr Opin Neurobiol. 1996;6:264–268. doi: 10.1016/s0959-4388(96)80082-1. [DOI] [PubMed] [Google Scholar]
- 74.Gerlai R. Trends Neurosci. 1996;19:177–181. doi: 10.1016/s0166-2236(96)20020-7. [DOI] [PubMed] [Google Scholar]
- 75.Bellen H J, Kiger J A. Roux’s Arch Dev Biol. 1988;197:258–268. doi: 10.1007/BF00380019. [DOI] [PubMed] [Google Scholar]
- 76.Greenspan R J, Tully T. In: Flexibility and Constraint in Behavioral Systems. Greenspan R J, Kyriacou C P, editors. New York: Wiley; 1994. pp. 65–80. [Google Scholar]
- 77.Bolwig G M, Del Vecchio M, Hannon G, Tully T. Neuron. 1995;15:829–842. doi: 10.1016/0896-6273(95)90174-4. [DOI] [PubMed] [Google Scholar]