

Abstract
Multielectrode recording techniques were used to record ensemble activity from 10 to 16 simultaneously active CA1 and CA3 neurons in the rat hippocampus during performance of a spatial delayed-nonmatch-to-sample task. Extracted sources of variance were used to assess the nature of two different types of errors that accounted for 30% of total trials. The two types of errors included ensemble “miscodes” of sample phase information and errors associated with delay-dependent corruption or disappearance of sample information at the time of the nonmatch response. Statistical assessment of trial sequences and associated “strength” of hippocampal ensemble codes revealed that miscoded error trials always followed delay-dependent error trials in which encoding was “weak,” indicating that the two types of errors were “linked.” It was determined that the occurrence of weakly encoded, delay-dependent error trials initiated an ensemble encoding “strategy” that increased the chances of being correct on the next trial and avoided the occurrence of further delay-dependent errors. Unexpectedly, the strategy involved “strongly” encoding response position information from the prior (delay-dependent) error trial and carrying it forward to the sample phase of the next trial. This produced a miscode type error on trials in which the “carried over” information obliterated encoding of the sample phase response on the next trial. Application of this strategy, irrespective of outcome, was sufficient to reorient the animal to the proper between trial sequence of response contingencies (nonmatch-to-sample) and boost performance to 73% correct on subsequent trials. The capacity for ensemble analyses of strength of information encoding combined with statistical assessment of trial sequences therefore provided unique insight into the “dynamic” nature of the role hippocampus plays in delay type memory tasks.
Keywords: hippocampus, memory, proactive interference, delayed-nonmatch-to-sample, multineuron recording
In a recent review of a symposium volume on memory, Conway characterized memories as “transitory mental constructions that encompass knowledge at different levels of abstraction” (1). The importance of the hippocampus in short-term memory has been established for human, nonhuman primate, and rodent memory (2, 3, 4). Hypotheses concerning the exact role the hippocampus plays in this process have undergone considerable change in the past 5–10 years (2, 4, 5, 6, 7, 8, 9). The current ambiguity regarding the functional significance of the hippocampus “proper” in memory has arisen primarily from two observations: (i) the fact that neurotoxic lesion techniques that spare fibers of passage and extrahippocampal structures do not produce massive deficits in short-term memory tasks (10), and (ii) the fact that damage to some retro- and extrahippocampal structures in the medial temporal lobe produce major deficits in memory tasks traditionally thought to be the exclusive province of hippocampus (11, 12, 13, 14, 15, 16). Despite any reduced significance of hippocampal removal in short-term memory, determination of the role of hippocampus in the encoding of information of a spatial and nonspatial nature, and its relevance to memory, remains an important issue in cognitive neurobiology (4, 8, 17, 18).
Given that selective elimination of hippocampal tissue has relatively small effects in both rats and monkeys on traditional delay-type memory paradigms (9, 19, 20), it becomes critical to assess hippocampal activity within these contexts to determine which types of memory mechanisms are reflected by hippocampal activation (21, 22, 23, 24). Such studies not only provide a better assessment of what role is played in memory by hippocampal cell activity, but also give insight into why removal of this structure does not appear to have a more pronounced effect in traditional types of short-term memory tasks. To achieve this objective, an in-depth analysis and identification of electrophysiological correlates of hippocampal cellular activity during delay-dependent behavioral tests of short-term memory is required (21, 25).
This laboratory has used simultaneous recording of moderate to large numbers of hippocampal neurons in rats to examine encoding and processing of information in delayed-nonmatch-to-sample (DNMS) memory tasks (21, 26, 27). This approach has identified task-relevant patterns of activity extracted from ensembles of 10–16 neurons associated specifically with successful and unsuccessful performance on individual DNMS trials. Ensemble encoding was distributed, by identified spatiotemporal patterns, across the entire population of recorded hippocampal cells and uniquely reflected parameters and temporal phases critical for correct DNMS performance (26). The information extracted from ensemble recordings was specific enough to allow prediction of errors as a function of the “strength” of specific event “codes” within ensembles.
We have extended this analysis to an examination of the nature of the events controlling trial-to-trial performance in the spatial DNMS task. Prior studies revealed that two types of errors were associated with performance in the DNMS task: (i) delay-dependent errors related specifically to the loss of “weakly” encoded sample phase information across the delay interval, and (ii) “miscodes” (Mis) in which the wrong spatial position of the response in the sample phase (right versus left) was encoded by the ensemble (21). Here we examine the series of events that precede and follow the occurrence of these errors and investigate whether or not they result directly from perturbation of DNMS encoding mechanisms previously demonstrated within the hippocampal ensembles.
METHODS
Behavioral Training and Apparatus.
Experiments were performed in a 43 × 43 × 50 cm Plexiglas behavioral testing chamber configured for a spatial DNMS task (25), and enclosed in a sound-attenuated cubicle (Industrial Acoustics Co., Bronx, NY). Two retractable levers (Coulborn Instruments, Lehigh Valley, PA) were located on one wall of the chamber, with a small water cup centered between them. A nosepoke device and cue light were mounted on the wall opposite the levers. Two incandescent lamps were mounted overhead for illumination, and a speaker on one wall provided an 85 dB white noise background.
Male Harlan Sprague Dawley rats (Madison, WI) were deprived of water for 16 hr each day and allowed free access to food to maintain 80–85% of ad lib body weight. Each animal was trained to perform the DNMS task as described (21, 25). During the sample phase, the right or left lever was randomly selected and presented. A lever press caused retraction of the lever and initiation of the delay interval. A cue light was then illuminated over the nosepoke device for the duration of the delay interval (random 1–30 sec). Animals nosepoked continuously until the delay interval terminated, as signaled by the cue light going off. Both levers were then extended, and an appropriate response (nonmatch) on the lever opposite to the sample phase response was reinforced by delivery of a drop of water. DNMS sessions consisted of 100–150 trials separated by 10-sec intertrial intervals. Performance across 1- to 30-sec delays for all animals in the delay task was similar to that reported previously (i.e., ≥90% correct responses at 1- to 5-sec delays, and typically <70% correct responses at 20- to 30-sec delays; ref. 21). All animals were trained to this criterion performance level (about 4–6 weeks) before implantation of electrode recording arrays.
Surgery and Electrodes.
After behavioral training, rats were allowed ad lib access to food and water for 2 days. Recording arrays consisting of 16 electrodes in 2 rows of 8, as described previously (NB Labs, Denison, TX; refs. 21 and 27), were implanted on the following day. Each animal was anesthetized with xylazine (20 mg/kg) and ketamine hydrochloride (100 mg/kg), and the array was stereotaxically lowered into the CA1 and CA3 layers of the hippocampus (centered at the following coordinates: 3.8 mm posterior to bregma, 3.0 mm lateral to midline, 3.0–3.5 mm depth, rotated 30° from the midline; ref. 21). Electrode tips on the recording array were separated by 200 μm within a row and 800 μm between rows and were positioned using physiological monitoring of spontaneous unit activity encountered within the respective hippocampal cell layers. After verification of electrode location in the CA1 and CA3 layers, the array was fixed permanently to the skull with dental cement. Penicillin (120,000 units) was given intramuscularly, and Neosporin was applied to wound edges following surgery. Animals were allowed to regain their preoperative weights and were retrained to criterion performance in the behavioral task before data collection. All surgical procedures were performed in accordance with guidelines of the National Institutes of Health and American Association for the Accreditation of Laboratory Animal Care.
Electrophysiological Recording.
Extracellular action potentials (spikes) from a 10-neuron subset of cells recorded on the 16-microwire array (1 neuron per wire) were differentially recorded, amplified (×700), filtered (500–10,000 Hz), and led to a 32-channel spike sorter (Spectrum Scientific, Dallas; see ref. 21). Single CA1 and CA3 complex spike cell discharges were identified on each electrode by several criteria, including spontaneous rate, waveform, and characteristic phasic “bursts” as described previously (28). “Theta cells” were excluded from the analysis. Digital pulses representing spike occurrences were time-stamped, synchronized with behavioral events, and stored on disk by a multitasking minicomputer (Motorola Delta 2616).
Data Analysis.
Neural data obtained from each animal consisted of spikes (extracellular action potentials) from 5 isolated CA1 neurons and 5 CA3 neurons in a 10-neuron ensemble recorded from each of 7 animals. Ensemble activity was analyzed by canonical discriminant analyses (proc can-disc; SAS Institute, Cary, NC) as described in a recent report (21, 26). Four significant canonical “roots” corresponding to the sample versus nonmatch phases of the trial (root 1), behavioral errors (root 2), left versus right lever position (root 3), and sample phase lever position (root 4) were obtained in the analysis. A single discriminant score for each root was calculated from ensemble activity by multiplying firing rate (in 250-msec bins) by the coefficients of the linear function that defined each root. The magnitude and sign of these root discriminant scores were used to evaluate each behavioral event according to the associated dimensions (e.g., sample versus nonmatch, left versus right lever position) identified by each root (21). Root discriminant scores were therefore used to identify specific information encoded by the ensemble activity on single trials. The strength of ensemble encoding was determined by the magnitude and appropriate sign of the discriminant scores for each root on individual trials, and confirmed statistically by one-way and two-way ANOVAs (proc glm; SAS Institute).
Proactive interference was analyzed by sorting trials on the basis of preceding trial type as determined by sample phase lever position within the trial (i.e., left sample trial = left lever position in the sample phase and right lever position in the nonmatch phase of the trial). If the current trial type and preceding trial type were the same (i.e., left sample trial followed by left sample trial), then that trial was sorted into the Same category. If the current and preceding trial types differed (i.e., left sample trial followed by right sample trial), then the current trial was sorted into the Different category. Mean DNMS performance was then plotted for each category separately (21). Trials were also sorted on the basis of the length of delay (1–30 sec) in the current and previous trials (29) within the Same and Different trial type categories.
RESULTS
Ensembles of hippocampal neurons successfully encoded task-relevant events on 70% of total trials. In the other 30% of trials, either a delay-dependent error (20% of total trials) or a “miscoding” error (10% of total trials) occurred (21). Each of these types of errors resulted from inappropriate encoding of sample phase information within the ensemble (see below). It is therefore important to examine the antecedent and consequent events associated with such errors to determine how ensemble activity was perturbed relative to correct trials. Fig. 1 shows how delay-dependent errors were manifested in terms of DNMS performance curves. Although the curves were averaged across all seven animals, they represent phenomena present in each animal. Fig. 1A is typical of the way in which performance is plotted as a function of delay in DNMS tasks. The plot shows that delay-dependent errors produced only a 6% decrease in performance on trials with delays of <15 sec, whereas the majority of errors (an additional 14%) were associated with delays ≥15 sec.
Figure 1.

Performance in the DNMS task. (A) Delay-dependent DNMS performance is indicated as mean (± SEM) percent of correct trials per session (100–200 trials), averaged across 7 different animals. Trials were grouped and plotted by 5-sec intervals across the 1- to 30-sec delay intervals. Horizontal dashed lines indicate a 6% delay-dependent decrement in DNMS performance contributed by trials with delays of <15 sec (left of vertical dashed line), and an additional 14% delay-dependent decrement contributed by trials with delays ≥15 sec. (B) Effect of proactive interference on DNMS performance. The data shown in A were sorted, on the basis of preceding trial type (which was determined with respect to lever press position in the sample phase of the trial), into the Same category or the Different category. Mean (± SEM) percent of correct DNMS performance by delay is plotted separately for each of the sorted trial types. The dashed line is the overall mean DNMS performance curve from A. Proactive interference is demonstrated by the consistent 6–8% decrease in DNMS performance at each delay (relative to Same trials) for Different trials.
Fig. 1B shows the influence of the other type of error, miscoded information in the sample phase. This error reflected a proactive influence dependent upon whether the current trial type was the Same or Different. In Fig. 1B, the two curves are parallel because there is no effect of delay on this type of error. The separation between the two curves results from the current trial type being different from the previous trial, resulting in a significant reduction in performance at all (1- to 30-sec) delay intervals.
Fig. 2 shows the data from Fig. 1 rearranged to display the interaction between delay-dependent errors and proactive interference from the preceding trial. Fig. 2 A and B show current trial DNMS performance curves sorted on the basis of the length of the delay interval in the previous trial. Note that if the delay in the previous trial was <15 sec, there was no effect of proactive interference (i.e., the Same/Different curves are not separated), whereas if the previous trial had a delay interval ≥15 sec, proactive interference from the previous trial systematically increased. Fig. 2C shows this effect by a plot of mean performance for Same or Different trials as a function of previous trial delays of 1–30 sec. It is clear that the proactive influence did not contribute appreciably to performance in the current trial unless the delay in the previous trial was 15–30 sec (Fig. 2C). This result suggests that performance factors operating within either the sample or the nonmatch phases of the current trial were differentially susceptible to influences from the previous trial but only if the delay in the previous trial was ≥15 sec.
Figure 2.
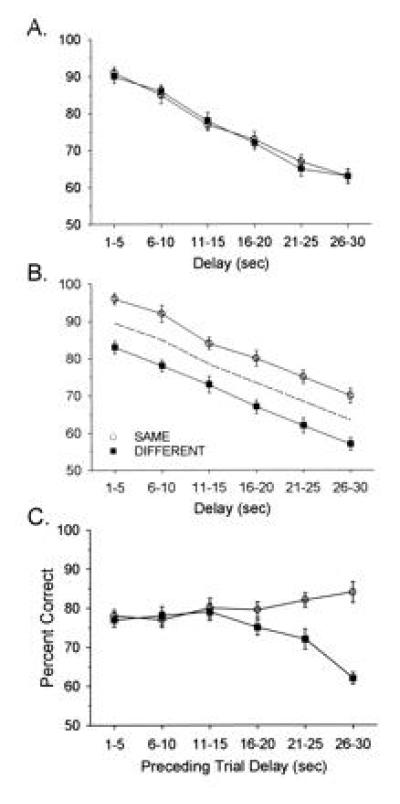
Influence of preceding trial delay and proactive interference. DNMS performance represented in Fig. 1 was analyzed according to the preceding trial type (Same or Different) and the length of the delay interval in the preceding trial. (A) Same plot that in Fig. 1B except only DNMS trials that were preceded by trials with short delays (<15 sec) were included. Each point represents mean (± SEM) DNMS performance from the same seven animals represented in Fig. 1. (B) Same graph as A except for preceding trials with long delays (≥15 sec). Note increase in proactive interference effect Same versus Different. Dashed line represents the mean of both Same and Different curves irrespective of preceding trial type. (C) Same data as in A and B plotted to show separation between Same versus Different pairs of trials as a function of the duration of delay on the previous trial. Each point depicts mean (± SEM) DNMS performance across trial blocks with 1- to 30-sec delays in the current trial (n = 7 animals).
It is important to understand how the above DNMS performance curves relate to ensemble activity, since delay-dependent errors and Mis errors were previously shown by the canonical discriminant analyses (21) to have separate and identifiable “signatures” in the ensemble “codes.” Previous studies have determined that the most relevant sources of variance in the ensemble were root 1 (task phase, sample versus nonmatch), root 2 (error trials), and root 3 (lever position, left versus right), which accounted for a highly significant 78% of overall variance in the ensemble activity. We therefore examined the ensemble codes for roots 1, 2, and 3 in terms of their strengths on individual trials as determined by the magnitude and sign of their discriminant scores (see Methods and ref. 21).
Knowing the strength of the ensemble code for root 3 (lever position) made it possible to determine the percentage of trials that had strong codes (60%) versus weak codes (40%). Of these, the percentages of correct trials with strong codes (SCC; 50%) and weak codes (WCC; 20%) were determined and are shown in Table 1. Likewise, for error trials (30% of total trials), 20% had weak codes in long delay error (LDE) trials, and 10% had strong Mis errors, as shown in Table 1. The majority of WCC trials (17% of 20% of total trials) were trials with short delays. The majority of weak code error trials (16% of 20% of total trials) occurred on long delay trials (i.e., LDE trials). Thus, weak encoding of root 3 during the sample phase was at risk on long, but not short, delay trials.
Table 1.
Percent of total trials for each two-trial combination of correct and error trials
| Preceding trial type | Current trial type
|
|||
|---|---|---|---|---|
| SCC | WCC | LDE | Mis | |
| SCC | 13* (25) | 7 (10) | 3 (10) | 0 (5) |
| WCC | 17* (10) | 11* (4) | 15* (4) | 1 (2) |
| LDE | 12 (10) | 1 (4) | 1 (4) | 8* (2) |
| Mis | 8* (5) | 1 (2) | 1 (2) | 1 (1) |
| Total | 50 | 20 | 20 | 10 |
Chance occurrence of each two-trial combination is shown in parentheses. LDE, long delay error.
*Significant differences from chance [all χ2(2) > 9.3; P < 0.01].
To determine the nature of the interaction between the duration of delay and degree of proactive interference (Figs. 1 and 2), it was necessary to sort trials on the basis of strength of the sample phase code and duration of the previous trial’s delay interval. Due to random presentation, 50% percent of all trials were necessarily preceded by trials with delays ≥15 sec. Fig. 2C shows that significant differences occurred between Same and Different trials preceded by trials with delays ≥15 sec. Further sorting of trials showed that encoding on any trial preceded by a trial with delays ≥15 sec consisted of 50% strong codes, 40% weak codes, and 10% Mis (totals shown in Table 1). Interestingly, as the delay in the preceding trial increased from 15 to 30 sec, the proportion of strong-coded trials did not change (50%); however, the proportion of trials with Mis increased to 30% in both trial categories (Same and Different; Fig. 2C). Conversely, the proportion of weak codes in trials in both of those categories decreased from 40% to 20%. The split between the Same and Different curves in Fig. 2C at delays longer than 15 sec was therefore produced by a decrease in the number of weak codes, and a corresponding disproportionate increase in the number of miscoded trials.
It is necessary to understand the sequence of events leading to these two types of errors to fully account for the observed linkage between them. Table 1 shows the breakdown in the data sorted by preceding trial delay and strength of ensemble code. The majority (15% of 20% of total trials) of LDE trials were preceded primarily by correct trials with weak codes in the sample phase (WCC trials; Table 1). Furthermore, 9% of this 15% of WCC trials were preceded by a WCC trial (Table 1). Thus, most LDE trials were preceded by WCC trials. Conversely, the trials that preceded Mis errors (Mis = 10% of total trials) were quite different; 8% of this 10% (Mis) of total trials were preceded by LDE trials (Table 1). This result indicated that approximately 40% of all LDE trials (8% of total trials) were followed by Mis errors, whereas the remaining 60% of total trials were followed by SCC trials (Table 1). Because it is not possible to distinguish a true SCC from a possible “Mis correct” trial (i.e., if the same trial type occurred on the next trial) the true number of Mis after LDEs could be as high as 16% of total trials. Hence, up to 8% of total correct trials could qualify as Mis correct trials, bringing the percent of LDE trials followed by Mis to 48%. The error trial sequence (LDE to Mis) therefore accounted for 60% of all errors in the DNMS task [significantly greater than random frequency, χ2(2) = 10.83, P < 0.01]. Thus, LDE trials were followed by either a correct trial (SCC, possibly correct Mis) or a Mis error trial. This proactive influence on trials following LDE trials is illustrated by the bidirectional split in the Same and Different curves in Fig. 2C at delays ≥15 sec.
The basis for the statistical linkage between a Mis and delay-dependent error (LDE) in the DNMS task was examined with respect to ensemble encoding. In LDE trials, root 3 was always encoded weakly in the sample phase, and information did not persist across the delay to the nonmatch phase of the same trial (21). Because a Mis (next) occurred with a high probability after an LDE, the end of the LDE trial (nonmatch phase) and the beginning of the Mis trial (sample phase) may have been functionally linked; otherwise, the above two errors could not occur together with higher than chance likelihood (observed = 42%, chance <5%). The statistical association implies that (i) the linkage between both types of errors (LDE to Mis) occurred across trials within the ensemble codes, and (ii) a unique factor in the ensemble firing pattern must have existed only on error and not correct trials. Such a factor was extracted as a significant source of variance (12%) in the canonical discriminant analysis and was identified as root 2. Root 2 encoded the position of the lever press in the nonmatch phase of the task but only in error trials (21).
Fig. 3 shows the adjusted firing surface for root 1 (task phase), root 2 (error trials), and root 3 (lever position) in the nonmatch phase of a correct trial and an LDE trial of the same type. The larger three-dimensional firing surfaces are overall hippocampal ensemble perievent histograms summed over 10 electrodes and averaged over trials (n = 100) from a single animal (26). The smaller three-dimensional surfaces are adjusted by the extracted coefficients showing the distribution of firing for each root. In the nonmatch phase, roots 1 and 3 show only slight changes on error trials, as reported previously (21). However, the additional firing extracted as root 2 contributes to a marked change in the spatiotemporal distribution of firing in the ensemble perievent histogram for error (LDE) trials (Fig. 3B). Fig. 3 demonstrates that not only does root 2 reflect the occurrence of errors, it also encodes the position of the erroneous “match” lever press (Fig. 4). The information in root 2 on an LDE trial could therefore contribute to the subsequent Mis error in the LDE-Mis trial sequence, since it strongly encodes the lever position associated with the error. If the sample phase lever on the next trial is presented at a different position than the code resident in root 2 from the prior LDE trial, Mis error will occur on that trial (see above).
Figure 3.
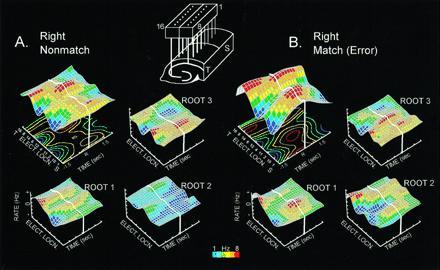
Illustration of hippocampal ensemble activity in correct and error trials in the DNMS task. (A) Mean ensemble firing pattern for the right nonmatch correct trial type is displayed as a three-dimensional firing surface (larger surface, Upper left) constructed from multiple perievent histograms (100 trials each) for 10 different hippocampal neurons recorded ±1.5 sec before and after a right correct lever press (R and thick white line). All neurons were recorded simultaneously from the electrode array shown at the top of the figure. Display of recording sites from CA1 and CA3 alternate along the electrode location axis (Elect. Locn.) of the three-dimensional surface plot to preserve anatomic relationships. S, Septal location; T, temporal location. Color contour plot beneath the firing surface is a two-dimensional projection of the surface activity. Color bar indicates firing rate (1–8 Hz). The three smaller surface patterns (Lower left and Upper and Lower right) depict the same ensemble firing rates “adjusted” by linear discriminant functions (derived by canonical discriminant analysis) corresponding to task phase (root 1), error trials (root 2) and lever position (root 3), as described (21). Note that activity associated with roots 1 and 3 occupy different regions of the surface, and that root 2 shows very little activity. (B) Mean firing pattern for a right “match” error trial for the same ensemble shown in A. Extracted root firing patterns for the same roots are displayed in the Lower left and Upper and Lower right as in A. Adjusted firing surfaces for task phase (nonmatch) and lever position (right) are similar to correct right lever (roots 1 and 3). Note the increase in activity associated with root 2 which is the source of the difference in overall mean ensemble firing (above) between correct and error trials.
Figure 4.

Comparison of within-trial and between-trial interactions of roots 2 and 3 on correct versus error trials. Scatter diagrams show root 1 versus root 3 and root 1 versus root 2 ensemble discriminant scores as two-dimensional plots. Each point reflects the intersection of two ensemble discriminant scores, one for each root for a single behavioral event (i.e., upper left cluster of red points on the correct trial plot reflects single trial scores during left sample lever presses). Colors indicate events related to the same trial types (blue, right sample trials; red, left sample trials). In correct trials, the same color clusters are diagonally opposite, reflecting opposite lever positions in the two different phases of the task as dictated by the nonmatch contingency. (Top Left) Correct trial: Normal distribution of root 3 discriminant scores in both types of correct DNMS trials. (Middle Left) Root 2 scores (plotted against root 1) on the same trials. There was no separation in scores with respect to lever position (horizontal axis) in either phase of the task on correct trials. (Bottom Left) Same as the top plot for root 3 except that discriminant scores are plotted for the following (Middle) trial as a function of the previous trial type (Top). Mixture of colors indicates the lack of relationship between encoding on the previous trial (Top) and encoding on the next trial (Bottom). (Top Right) Error (LDE) Trial: Illustration of (sequential) error trial “cascade.” (Top Right) Same as Top left plot except that ensemble scores are from LDE trials. Note weak encoding in root 3 during the sample phase illustrated by the mixture of colors and the lack of separation into distinct color-coded clusters. Nonmatch phase scores reflect the “match” error response. Root 2 scores on the same LDE trials show distinctly separated clusters, but only in the nonmatch phase, which correspond to the same lever position as root 3 scores in the nonmatch phase of the same trial (orange arrow). (Bottom Right) Miscode trial: Distinctly separated color-coded clusters of root 3 ensemble scores consistently reflect that same root 2 information (Middle Right) in the sample phase on the next (Mis) trial following LDE trials. The same information is encoded in the sample phase on the next (Mis) trial as in the preceding nonmatch phase regardless of the current trial type. This illustrates “carryover” of information (green arrow) between trials as the basis for proactive interference. The reversal of color clusters along the diagonal indicates that the nonmatch decision rule was applied to the miscoded sample information that caused a match error with respect to the nonmatch contingency.
Fig. 4 shows scattergrams depicting two-dimensional plots of ensemble discriminant scores for individual trials (each point) for roots 2 and 3, which are graphed two-dimensionally against root 1 (phase of the task). Scattergrams of root 2 scores (Fig. 4 Middle) are compared with scattergrams of root 3 scores on the same trial (Fig. 4 Top), as well as the next trial in the sequence (Fig. 4 Bottom). The correct trial sequence is plotted on the left. On correct trials, root 2 (error indicator) scores were not differentiated with respect to lever position in either the sample or nonmatch phases of the task, whereas root 3 scores were clearly and appropriately clustered in each phase according to the nonmatch decision rule for each DNMS trial type (red or blue). The fact that the colored symbols for root 3 in the next correct trial (Fig. 4 Bottom Left) were mixed (random) indicates that there was no significance to the order of trial occurrence, and no effect of prior trial.
In LDE trials, however (Fig. 4 Middle Right), root 2 was highly differentiated with respect to lever position within the nonmatch phase, indicating the occurrence of a match error on one or the other lever. The absence of differentiation of root 2 in the sample phase demonstrates that it registered only information related to the lever response in the nonmatch phase. Root 3 is weakly encoded in the sample phase in LDE trials (Fig. 4 Top Right) and is not differentiated with respect to position code. Hence, root 3 registers the same (match error) response as root 2 in the nonmatch phase (orange arrow) in LDE trials. The maintained segregation of colors (encoded responses) on the next (Mis) trial (Fig. 4 Bottom Right) indicates that the same lever position code in root 2 on the LDE trial is “carried over” and strongly encoded in root 3 in the sample phase of the next trial. This constitutes the basis for the Mis on the next trial (Fig. 4, green arrow).
The carryover of the root 2 code generates an error, if the trial type is Different from the previous LDE trial, but paradoxically, the trial will be categorized as correct (SCC; Table 1) if the trial type is the Same as the LDE trial (i.e., the sample lever and carryover code will be the same position; Fig. 2C). Hence, LDEs (20% of total) were almost always followed by trials in which sample information was encoded strongly (8% Mis errors and 12% SCCs; Table 1), and since LDEs occurred more frequently at long delays, the incidence of Mis trials also increased after long delays.
DISCUSSION
DNMS performance has been considered an example of short-term memory in a number of mammalian species ranging from rodent to man (cf. refs. 5, 22, and 31, 32, 33). Because the task involves the use of trial specific information, it is presumed that between-trial strategies play only a minor role in the successful performance of the task. However, there have been clear demonstrations that between-trial strategies can successfully coexist in the performance of the DNMS task (34, 35). Prior electrophysiological correlates of DNMS performance in rodents and monkeys have, for the most part, focused on the importance of the representation of trial-specific information by cells in the medial temporal cortex, subiculum, hippocampus, and other structures (cf. refs. 20, 27, 36, and 37).
The current findings support the notion that both within- and between-trial factors operate in the DNMS paradigm to control encoding of information in hippocampal ensembles. This analysis focused directly on factors related to errors in performance as determined by strong and weak encoding of sample information in relation to length of DNMS trial delay. It was determined that once a delay-dependent error (LDE) occurred in a DNMS trial, there was a predictable cascade of events that extended over the course of the next trial (Table 1 and Fig. 4). This cascade incorporated a strategy that involved the deliberate transference or carryover of position-specific (response) information between trials.
The advantage of this carryover strategy after an LDE is that it truncates the condition after an LDE in which the animal is out-of-sync with respect to the proper sequence of within-trial events. Without such a strategy, the only means of correcting this condition would be to wait until a correct DNMS response occurs by chance. Use of the carryover strategy in the trial following the LDE ensures that sample phase information is always strongly encoded (even though it may be miscoded) in the next trial. Hence, the lever position information strongly encoded in the sample phase by root 3 in the trial after an LDE is the same as that encoded by root 2 on the prior LDE trial (Figs. 3 and 4). The adjusted firing surface for root 2 in Fig. 3B shows enhanced activity at electrode locations that overlap with those showing activity related to roots 1 and 3. Overall ensemble activity is therefore enhanced by root 2 in error trials such that the same response code will necessarily recur during the sample phase on the next trial, thus setting the condition for a Mis to occur if the trial is not the same type (Fig. 2).
Thus, to avoid confusion, the animal presumably encodes the sample phase response of the next trial in exactly the same way as the error response in the prior LDE trial, even though the strategy has a 50% risk of a deliberate miscoding of lever position. The strategy does however provide definitive feedback to the animal as to which phase (sample or nonmatch) of the trial it is in, as well as persistent (across the delay) position information (left or right) to which the nonmatch “decision rule” can be applied. Application of the strategy thus resynchronizes the animal within one trial to the order of response events required to satisfy the nonmatch contingency. At the very least, following this strategy, information will be strongly encoded, and the chances of reward are no less than 50%. This can be contrasted with the expected positive outcome if the sample response on the next trial after an LDE were weakly encoded and a long delay occurred on the next trial (22%; Table 1).
Current assessment is that “memories are fragmentary, condensed, often distorted and inaccurate representations of past experience” (1). Accepting this view, the analysis described here strongly suggests that the hippocampus does play a major role in delay-dependent memory tasks, but this role is less apparent if certain conditions (i.e., strength of encoding and between-trial strategies) are not accounted for. Moreover, it cannot be assumed that information processing in the hippocampus is the same on each DNMS trial within a session, irrespective of length of delay. Neither can the possibility be totally excluded that events from preceding trials conspire to change the circumstances under which hippocampal encoding becomes more important (38). For instance, it was shown here that as conditions change, different encoding strategies may exist within hippocampal ensembles to “reorient” responding to appropriate task contingencies and/or to avoid lengthy runs of errors.
Central to understanding such processes is the need to characterize the mechanism by which hippocampal ensembles encode task-relevant events. The limited evidence currently available from ensemble recording suggests that one key factor in the prevention of memory failure is the strength of the event code. This hypothesized relationship between strength of code and loss of information due to interference and length of delay is shown in Fig. 5 as different biphasic functions exhibiting differential decay times. The curves show that strength of information encoding and time course of information decay interact during delay-dependent memory tasks and vary from weak to strong as depicted by the height of each curve. Hence, when ensemble encoding is strong (Fig. 5), the code persists longer and proactive interference is low, leading to more likely correct performance. However, when encoding is weak (next highest curves in Fig. 5), the spatiotemporal patterns encoded within the ensemble (Fig. 3 A and B) are at risk for corruption or decay of information content across the DNMS delay interval (27, 36) and performance is reduced. The dashed curve in Fig. 5 represents the minimal encoding capacity of hippocampal-lesioned animals, perpetually at risk on delay-dependent memory tasks because there is no (hippocampal) mechanism for increasing the strength of encoding to either protect against proactive interference or to sustain the encoded information across moderate to long delay intervals (29). Conversely, if a memory task does not contain a high percentage of interference and/or delay-type influences, animals with the hippocampus removed may perform as well as intact animals (8, 10).
Figure 5.
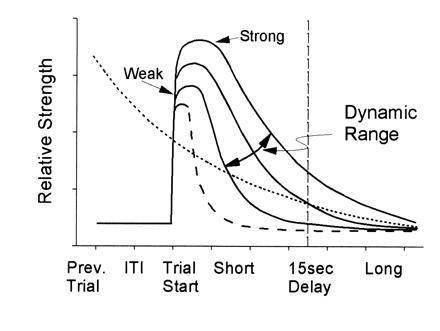
Schematic illustration of dynamic properties of hippocampal memory. Opposing influences on DNMS performance, strength of hippocampal ensemble encoding (solid lines) and proactive interference (dotted line). The horizontal axis represents the relationship between strength of encoding and DNMS delay intervals. At short delays, encoding can be relatively weak and resistant to interference, but only for a certain delay duration. At long delays, only strong encoding prevents interference across the delay and results in correct performance. The intersection between two curves defines the critical point at which strength of encoding (vertical axis) is able to counter proactive influences (dotted line). Note that the time constant of decay also varies with strength of encoding. The proactive interference curve was purposely plotted with the same relative decay as the strong encoding curve, and represents encoding from the previous trial. The dynamic range (strong to weak) of hippocampal encoding is illustrated by the three solid curves and the oblique arrow. Encoding in the absence of a hippocampus is indicated by the dashed line.
The ability to vary the strength of hippocampal information encoding when necessary provides a means of compensating (within limits) for conditions that accelerate interference. The process is dynamic in that circumstances which provoke delay-dependent errors can be adapted to within only a single trial merely by changing the strength of encoding of task-relevant information (Fig. 5). Such a mechanism would be consistent with several of the well-known cognitive factors identified in human memory, such as “priming” and “chunking” to avoid proactive or retroactive interference, facilitation of memory by repetition, and distributed versus massed trials, all of which appear to influence memory by altering the strength of encoded information (1, 3, 4, 39, 40).
Acknowledgments
This work was supported by National Institutes of Health Grants DA03502 and DA00119 (to S.A.D.) and DA08549 (to R.E.H.).
Footnotes
The publication costs of this article were defrayed in part by page charge payment. This article must therefore be hereby marked “advertisement” in accordance with 18 U.S.C. §1734 solely to indicate this fact.
Abbreviations: DNMS, delayed-nonmatch-to-sample; LDE, long delay error; Mis, miscode(s); SCC, strong code correct; WCC, weak code correct.
References
- 1.Conway M A. Nature (London) 1996;380:214. [Google Scholar]
- 2.Rolls E T. Hippocampus. 1991;1:258–261. doi: 10.1002/hipo.450010310. [DOI] [PubMed] [Google Scholar]
- 3.Squire L R. Psychol Rev. 1992;99:195–231. doi: 10.1037/0033-295x.99.2.195. [DOI] [PubMed] [Google Scholar]
- 4.Squire L R, Knowlton B, Musen G. Annu Rev Psychol. 1993;44:453–495. doi: 10.1146/annurev.ps.44.020193.002321. [DOI] [PubMed] [Google Scholar]
- 5.Peinado-Manzano M A. Behav Brain Res. 1990;38:117–134. doi: 10.1016/0166-4328(90)90010-c. [DOI] [PubMed] [Google Scholar]
- 6.Sutherland R J, McDonald R J. Behav Brain Res. 1990;37:57–79. doi: 10.1016/0166-4328(90)90072-m. [DOI] [PubMed] [Google Scholar]
- 7.Zola-Morgan S M, Squire L R. Science. 1990;250:288–290. doi: 10.1126/science.2218534. [DOI] [PubMed] [Google Scholar]
- 8.Jarrard L E. Behav Neural Biol. 1993;60:9–26. doi: 10.1016/0163-1047(93)90664-4. [DOI] [PubMed] [Google Scholar]
- 9.Angeli S J, Murray E A, Mishkin M. Neuropsychologia. 1993;31:1021–1030. doi: 10.1016/0028-3932(93)90030-4. [DOI] [PubMed] [Google Scholar]
- 10.O’Boyle V J, Jr, Murray E A, Mishkin M. Soc Neurosci Abstr. 1993;23:438. [Google Scholar]
- 11.Zola-Morgan S, Squire L R, Amaral D G, Suzuki W A. J Neurosci. 1989;9:4355–4370. doi: 10.1523/JNEUROSCI.09-12-04355.1989. [DOI] [PMC free article] [PubMed] [Google Scholar]
- 12.Otto T, Schottler F, Staubli U, Eichenbaum H, Lynch G. Behav Neurosci. 1991;105:111–119. doi: 10.1037//0735-7044.105.1.111. [DOI] [PubMed] [Google Scholar]
- 13.Suzuki W A, Zola-Morgan S, Squire L R, Amaral D G. J Neurosci. 1993;13:2430–2451. doi: 10.1523/JNEUROSCI.13-06-02430.1993. [DOI] [PMC free article] [PubMed] [Google Scholar]
- 14.M’Harzi M, Jarrard L E, Willig F, Palacios A, Delacour J. Behav Neural Biol. 1991;56:221–239. doi: 10.1016/0163-1047(91)90364-v. [DOI] [PubMed] [Google Scholar]
- 15.Zola-Morgan S, Squire L R, Clower R P, Rempel N L. J Neurosci. 1993;13:251–265. doi: 10.1523/JNEUROSCI.13-01-00251.1993. [DOI] [PMC free article] [PubMed] [Google Scholar]
- 16.Bunsey M, Eichenbaum H. Behav Neurosci. 1993;107:740–747. doi: 10.1037//0735-7044.107.5.740. [DOI] [PubMed] [Google Scholar]
- 17.Cohen N J, Eichenbaum H. Memory, Amnesia, and the Hippocampal System. Cambridge, MA: MIT Press; 1993. [Google Scholar]
- 18.Eichenbaum H, Otto T, Cohen N J. Behav Brain Sci. 1994;17:449–518. [Google Scholar]
- 19.Rawlins J N, Lyford G L, Seferiades A, Deacon R M, Cassaday H J. Behav Neurosci. 1993;107:420–433. doi: 10.1037//0735-7044.107.3.420. [DOI] [PubMed] [Google Scholar]
- 20.Aggleton J P, Keith A B, Rawlins J N, Hunt P R, Sahgal A. Behav Brain Res. 1992;52:61–71. doi: 10.1016/s0166-4328(05)80325-0. [DOI] [PubMed] [Google Scholar]
- 21.Deadwyler S A, Bunn T, Hampson R E. J Neurosci. 1996;16:354–372. doi: 10.1523/JNEUROSCI.16-01-00354.1996. [DOI] [PMC free article] [PubMed] [Google Scholar]
- 22.Otto T, Eichenbaum H. Hippocampus. 1992;2:323–334. doi: 10.1002/hipo.450020310. [DOI] [PubMed] [Google Scholar]
- 23.Wible C G, Shiber J R, Olton D S. Behav Neurosci. 1992;106:751–761. doi: 10.1037//0735-7044.106.5.751. [DOI] [PubMed] [Google Scholar]
- 24.Miller R. In: Studies of Brain Function. Braitenberg V, Barlow H B, Bullock T H, Florey E, Grusser O-J, Peters A, editors. New York: Springer; 1991. [Google Scholar]
- 25.Hampson R E, Heyser C J, Deadwyler S A. Behav Neurosci. 1993;107:715–739. doi: 10.1037//0735-7044.107.5.715. [DOI] [PubMed] [Google Scholar]
- 26.Deadwyler S A, Hampson R E. Science. 1995;270:1316–1318. doi: 10.1126/science.270.5240.1316. [DOI] [PubMed] [Google Scholar]
- 27.Hampson R E, Deadwyler S A. In: Long Term Potentiation. Baudry M, Davis J, editors. Cambridge, MA: MIT Press; 1996. vol. 3. [Google Scholar]
- 28.Christian E P, Deadwyler S A. J Neurophysiol. 1986;55:331–348. doi: 10.1152/jn.1986.55.2.331. [DOI] [PubMed] [Google Scholar]
- 29.Hampson R E, Byrd D R, Konstantopoulos J K, Bunn T, Jarrard L E, Deadwyler S A. Soc Neurosci Abstr. 1995;21:1215. [Google Scholar]
- 30.Deadwyler S A, Hampson R E. In: Annual Review of Neuroscience. Cowan W M, Shooter E M, Stevens C F, Thompson R F, editors. Inc., Palo Alto, CA: Annual Reviews; 1997. [Google Scholar]
- 31.Rawlins J N P. Behav Brain Sci. 1985;8:479–528. [Google Scholar]
- 32.Dunnett S B. Psychopharmacology. 1985;87:357–363. doi: 10.1007/BF00432721. [DOI] [PubMed] [Google Scholar]
- 33.Squire L R, Zola-Morgan S, Chen K S. Behav Neurosci. 1988;102:210–221. doi: 10.1037//0735-7044.102.2.210. [DOI] [PubMed] [Google Scholar]
- 34.Deacon R M, Rawlins J N. J Exp Psychol Anim Behav Processes. 1995;21:285–292. doi: 10.1037//0097-7403.21.4.285. [DOI] [PubMed] [Google Scholar]
- 35.Steele K, Rawlins J N. Behav Brain Res. 1993;54:1–10. doi: 10.1016/0166-4328(93)90043-p. [DOI] [PubMed] [Google Scholar]
- 36.Optican L M, Richmond B J. J Neurophysiol. 1987;57:162–178. doi: 10.1152/jn.1987.57.1.162. [DOI] [PubMed] [Google Scholar]
- 37.Miller E K, Li L, Desimone R. J Neurosci. 1993;13:1460–1478. doi: 10.1523/JNEUROSCI.13-04-01460.1993. [DOI] [PMC free article] [PubMed] [Google Scholar]
- 38.Bunsey M, Eichenbaum H. Nature (London) 1996;379:255–257. doi: 10.1038/379255a0. [DOI] [PubMed] [Google Scholar]
- 39.Ochsner K N, Chiu C Y, Schacter D L. Curr Opin Neurobiol. 1994;4:189–194. doi: 10.1016/0959-4388(94)90071-x. [DOI] [PubMed] [Google Scholar]
- 40.Goodie A S, Fantino E. Nature (London) 1996;380:247–249. doi: 10.1038/380247a0. [DOI] [PubMed] [Google Scholar]