

Two polarity proteins, partitioning defective 3 homologue (Par3) and mammalian homologues of Drosophila lethal(2)giant larvae (Lgl1/2), antagonize each other in modulating myosin II activation during cell–cell contact formation in Madin-Darby canine kidney cells. Altering the counteraction between Par3 and Lgl1/2 leads to entosis without matrix detachment.
Abstract
Cell–cell contact formation following cadherin engagement requires actomyosin contraction along the periphery of cell–cell contact. The molecular mechanisms that regulate myosin activation during this process are not clear. In this paper, we show that two polarity proteins, partitioning defective 3 homologue (Par3) and mammalian homologues of Drosophila Lethal (2) Giant Larvae (Lgl1/2), antagonize each other in modulating myosin II activation during cell–cell contact formation in Madin-Darby canine kidney cells. While overexpression of Lgl1/2 or depletion of endogenous Par3 leads to enhanced myosin II activation, knockdown of Lgl1/2 does the opposite. Intriguingly, altering the counteraction between Par3 and Lgl1/2 induces cell–cell internalization during early cell–cell contact formation, which involves active invasion of the lateral cell–cell contact underneath the apical-junctional complexes and requires activation of the Rho–Rho-associated, coiled-coil containing protein kinase (ROCK)–myosin pathway. This is followed by predominantly nonapoptotic cell-in-cell death of the internalized cells and frequent aneuploidy of the host cells. Such effects are reminiscent of entosis, a recently described process observed when mammary gland epithelial cells were cultured in suspension. We propose that entosis could occur without matrix detachment and that overactivation of myosin or unbalanced myosin activation between contacting cells may be the driving force for entosis in epithelial cells.
INTRODUCTION
Cell–cell contact formation is initiated by the contact of exploratory membrane protrusions, which is followed by the formation of cadherin clusters through homophilic cadherin interactions (Adams et al., 1998; Krendel and Bonder, 1999; Nakagawa et al., 2001; Ehrlich et al., 2002; Vaezi et al., 2002; Yamada and Nelson, 2007). Cadherin engagement then triggers actin cytoskeleton rearrangement (Krendel and Bonder, 1999; Vasioukhin et al., 2000; Hansen et al., 2002; Kovacs et al., 2002; Green et al., 2010). Subsequently, actin polymerization and myosin II–driven contraction of actin bundles along the peripheral cell cortex of cadherin clusters lead to cell–cell contact expansion (Krendel et al., 1999; Ivanov et al., 2004, 2005; Shewan et al., 2005; Zhang et al., 2005; Yamada and Nelson, 2007; Cavey et al., 2008). The intricacies of the molecular mechanisms that modulate actomyosin contraction during cell–cell contact formation are poorly understood.
Following initial cell–cell contact formation, polarized epithelial cells specify cell contact regions into apical and basal-lateral domains through groups of evolutionarily conserved proteins that are called polarity proteins. These include the apical-junctional partitioning defective 3 homologue/partitioning defective 6 homologue/atypical protein kinase C (Par3/Par6/aPKC) and Crumbs3/Pals1/Patj and the basal-lateral Scribble/Lgl/Dlg complexes (Macara, 2004; Martin-Belmonte and Mostov, 2008). These core polarity complexes do not function independently, but interact with one another in establishing and maintaining cell polarization (Macara, 2004). Par3, Lgl (Lgl1 and Lgl2 in mammals), and Pals1 all bind directly to Par6 (Joberty et al., 2000; Lin et al., 2000; Betschinger et al., 2003; Hurd et al., 2003; Plant et al., 2003; Yamanaka et al., 2003). Like Par3, Lgl interacts with and is phosphorylated by aPKC (Izumi et al., 1998; Joberty et al., 2000; Lin et al., 2000; Betschinger et al., 2003; Yamanaka et al., 2003). The binding of Par3 and Lgl to Par6 appears to be mutually exclusive (Plant et al., 2003; Yamanaka et al., 2003, 2006). It is not known whether these polarity proteins are also involved in regulating early cell–cell contact formation.
Cell-in-cell structures, in which an intact cell resides in another host cell, have been described for decades and are commonly observed in different types of tumors (Overholtzer and Brugge, 2008). Molecular mechanisms underlying the formation of cell-in-cell structures are poorly understood. Entosis is a recently described process that accounts for homotypic cell-in-cell structures—the target cell is internalized by a host cell of the same type (Overholtzer et al., 2007). This process was observed in a limited number of normal and tumor epithelial cell lines grown exclusively in suspension. It was originally proposed as a tumor-suppressive mechanism, because entosis frequently results in the death of internalized target cells in a nonapoptotic pathway (Overholtzer et al., 2007). More recently, entosis was described as a nongenetic means of generating aneuploidy, which is caused by frequent cytokinesis defects in the host cells (Krajcovic et al., 2011). Entosis appears to require cadherin-mediated cell–cell adhesion and the activation of the Rho–Rho-associated, coiled-coil containing protein kinase (ROCK)–myosin II pathway (Overholtzer et al., 2007). Whether entosis could occur under adhesive culture conditions and what could drive entosis are not clear.
In this paper, we show that entosis can be effectively induced under adhesive culture conditions in Madin-Darby canine kidney (MDCK) cells. We identified Lgl and Par3 as critical, antagonistic regulators of actomyosin contractility during early stages of cell–cell contact formation.
RESULTS
Overexpression of Lgl led to cell–cell internalization in MDCK cells
To study the function of mammalian Lgl, we established stable Tet-Off MDCK cell lines expressing N-terminally Venus-tagged human Lgl2. As previously reported (Musch et al., 2002; Yamanaka et al., 2003), ectopically expressed Venus-Lgl2 localizes predominantly to the cell membrane in unpolarized cells and is restricted to the lateral cell–cell contact in polarized confluent cells (Figure 1A). Interestingly, when monitoring live cells under a fluorescence microscope, we frequently observed a bright, circled Venus-Lgl2 signal that appeared to be contained in a cell (Figure 1A). This was seen when cells were seeded at high density, but more frequently when cells were plated sparsely (Figure 1A). Differential interference contrast (DIC) imaging revealed that the Venus-Lgl2–surrounded structures appeared to contain nuclei. This was confirmed by DNA staining, suggesting that they were intact cells (Figure 1A). Immunostaining of fixed Venus-Lgl2 cells with anti–β-catenin antibody indicated that those structures were also surrounded by β-catenin (Figure 1B). It is possible that the observed phenomenon is caused by one cell sitting on top of or being wrapped by the protrusions of another cell. Alternatively, it could also reflect one cell being internalized by another—a cell-in-cell structure. To explore these possibilities, we performed confocal three-dimensional reconstruction of Venus-Lgl2 cells stained with anti–β-catenin antibody (Figure 1C). Clearly, cells with brighter Venus-Lgl2/β-catenin signals are inside other cells, suggesting cell–cell internalization. To determine whether there was complete cell internalization, we performed cell surface biotinylation analysis. Indeed, many Venus-Lgl2–surrounded cells were protected from biotin labeling, suggesting complete internalization (Figure 1D).
FIGURE 1:

Overexpression of Lgl2 led to cell–cell internalization of MDCK cells. (A) Images of MDCK cells stably expressing Venus-Lgl2 (green). DNA was stained with Hoechst 33342. DIC images are shown on the right. Scale bar: 10 μm. (B) Images of Venus-Lgl2–expressing cells. Fixed cells were stained with anti–β-catenin antibody (red). DNA was stained with Hoechst 33342. Scale bar: 10 μm. (C) Confocal images of control (left) and internalizing Venus-Lgl2–expressing cells. Reconstituted y,z (left) and x,z (bottom) views along the indicated lines within each image are presented. Fixed cells were stained with anti–β-catenin antibody (red). DNA was stained with Hoechst 33342. (D) Surface biotinylation of Venus-Lgl2 cells. Cells were incubated with biotin (0.5 mg/ml), fixed, and stained with streptavidin–Alexa Fluor 568 (red). DNA was stained with Hoechst 33342. Scale bar: 10 μm. (E) Quantification of cell–cell internalization. Paired analysis of control MDCK T23, Venus-Lgl2 cells in the presence of doxycycline (V-Lgl2 (+Dox)) or in the absence of doxycycline (V-Lgl2 (−Dox)). Cells were fixed at indicated time points after plating on coverglass and were stained with anti–β-catenin antibody. Paired cells were analyzed. Percentages of half (more than half of one cell body was inside the other) and complete (the whole cell body of one cell was inside the other) internalization between paired cells were quantified and represented as different colors in the columns. Data were from three independent experiments (n > 200 for each set of data). Error bars represent SD. (F) Representative images of Venus-Lgl2 cells from a live-cell, time-lapse analysis. Live cells were stained with Hoechst 33342 (blue). Merged images from green and blue channels are presented. Time points are presented as minutes:seconds.
We noticed that Venus-Lgl2–induced cell–cell internalization appeared to happen more frequently between two contacting cells during the early stages after cells were plated on substrate. To quantitate such events, we seeded the cells at a density that favored paired cell–cell contact and monitored the progress of cell–cell internalization. Such an assay is referred as a “paired analysis.” We counted those paired cells that exhibited more than half of one cell body to be inside the other as internalizing cells, and those that showed one continuous Venus-Lgl2/β-catenin circle residing in another as completely internalized cells. As shown in Figure 1E, the cell–cell internalization between paired Venus-Lgl2 cells started as early as 2 h after plating, peaked at 6–8 h, and gradually dropped thereafter, suggesting that such cell–cell internalization involves early cell–cell contact formation. We performed identical paired analysis for parental MDCK T23 cells and MDCK II cells. While <20% of paired control cells appeared to be internalizing each other, complete internalization was rarely observed (Figure 1E). A similar degree of cell–cell internalization was observed in multiple independent Venus-Lgl2 cell lines; most importantly, when Venus-Lgl2 cells were cultured in the presence of doxycycline (+Dox) to suppress the ectopic expression of Venus-Lgl2, the internalization rates were inhibited to control levels (Figure 1E), indicating that the observed cell–cell internalization was caused by ectopic expression of Venus-Lgl2.
When cells were seeded at a high density, we were not able to quantitate incomplete internalization, because one cell was usually in contact with multiple cells, and cell–cell contacts appeared to be constantly remodeling. However, at 6–8 h after plating, ∼5–7% (5.5 ± 0.6% at 6 h; 7.2 ± 1.1% at 8 h, n = 2000) of the cells appeared to be completely internalized by other cells (Supplemental Figure S1A). This internalization rate was gradually reduced to ∼3% (3.1 ± 0.6%) at 12 h, when some of the internalized cells started to be surrounded by large vacuoles (described in the following section). Complete cell–cell internalization was not observed when control MDCK cells or Venus-Lgl2 cells cultured in the presence of doxycycline were plated at high cell density (unpublished data).
Cell–cell internalization was also observed in stable cell lines overexpressing Lgl1 (Figure S1, B and C), the other mammalian homologue of Lgl, suggesting that this is a common feature for the Lgl family of proteins. Furthermore, we could reproduce Lgl-induced cell–cell internalization by transiently overexpressing Lgl2 in MDCK cells (Figure S3).
We performed live-cell, time-lapse analysis of paired Venus-Lgl2 cells after they were plated on culture dishes. As shown in Figure 1F and Supplemental Movie S1, cell–cell internalization appeared to be achieved by active invasion of one cell starting at the cell–cell contact region, and complete internalization could occur within 1 h.
Fate of internalized cells and host cells
Although the rate of cell–cell internalization between paired Venus-Lgl2 cells was high at 6–8 h after they were plated on substrate, the rate reduced gradually after 8 h. Time-lapse analysis indicated that many internalized cells were released, probably due to cell movement on the substrate, contact with other cells, and the division of host or internalized cells (unpublished data). At 12 h after plating, some of the internalized cells appeared to be surrounded by large vacuoles that gradually shrank. This was accompanied by nuclear disintegration inside the vacuole and diffusion and reduction of the Venus-Lgl2 signal. Eventually, the vacuole disappeared in the host cells. A typical example of this process is shown in Figure 2A and Movie S2. We have also performed transmission electron microscopy (TEM) analysis of such cell-in-cell death, which clearly indicated nuclear disintegration inside the vacuoles (Figure 2B).
FIGURE 2:

Fate of internalized cells and host cells. (A) Representative images of Venus-Lgl2 cells from a live-cell, time-lapse analysis. Live cells were stained with Hoechst 33342 (blue). DIC and merged images from green and blue channels are presented. Time points are presented as hours:minutes. (B) TEM images showing degrading internalized Venus-Lgl2 cells. (C) A number of internalized cells die through apoptosis. Venus-Lgl2–expressing cells were fixed and stained with anti-cleaved caspase3 antibody (red). DNA was stained with Hoechst 33342. White and red arrowheads indicate dying internalized cells that are negative or positive for cleaved caspase3 staining, respectively. Scale bars: 10 μm. (D) Quantitation of internalized cells that exhibited nuclear disintegration and were cleaved-caspase3-positive in Venus-Lgl2–expressing cells at 16 h after plating. Cells were treated with dimethyl sulfoxide (DMSO; control), caspase inhibitor ZVAD-FMK (ZVAD, 20 μM), or autophagic/lysosomal inhibitor 3-MA (5 mM). Data were from three independent experiments. Error bars indicate SD values. (E and F) Venus-Lgl2–induced cell–cell internalization led to cytokinesis defect in the host cells. (E) Images of Venus-Lgl2 cells fixed at 12 h after plating. DNA was stained with Hoechst 33342. H, host cell; I, internalized cell. (F) Quantification of binucleated host cells at different time points after Venus-Lgl2 cells were plated on coverglass.
To test whether the internalized cells died through apoptosis, we stained the cells for the presence of cleaved caspase 3, a hallmark of apoptotic cell death. Interestingly, only 25% of internalized cells that exhibited nuclear disintegration were positive for cleaved caspase 3 (Figure 2, C and D), suggesting that the majority of the internalized cells were dying through a nonapoptotic pathway. The percentage of cleaved caspase 3–positive, dying cells could be further reduced by treating the cells with ZVAD-FMK, a caspase inhibitor (Figure 2D). Remarkably, when we treated the cells with an autophagic/lysosomal inhibitor, 3-methyladenine (3-MA), more than 80% of internalized dying cells were positive for cleaved caspase 3 staining (Figure 2D), suggesting a switch from nonapoptotic to apoptotic cell death.
As for the host cells or the invaded cells, an interesting observation is that many of them were binucleated at 12 and 16 h after plating on substrate (Figure 2, E and F). Time-lapse analysis suggest that if the host cell started cell division before digesting the internalized target cell, the internalized cell might affect cleavage furrow ingression and prevent the completion of cytokinesis of the host cell (Movie S3).
Entosis without matrix detachment
The interesting effects we observed in Venus-Lgl2–expressing MDCK cells, such as homotypic cell–cell internalization, predominantly nonapoptotic cell-in-cell death of the internalized cells, and binucleation of the host cells, are reminiscent of a recently described phenomenon called “entosis,” which was first observed when mammary gland epithelial cells were cultured in suspension (Overholtzer et al., 2007; Krajcovic et al., 2011).
It is proposed that entosis requires cell detachment from the matrix (Florey et al., 2010). One possible explanation for Venus-Lgl2–induced cell–cell internalization would be that overexpression of Lgl2 affected cell attachment to the substrate. On contact with the substrate, cell spreading and the formation of lamellipodia appeared normal for cells overexpressing Venus-Lgl2 (Figure 1A). We compared focal adhesion formation between control and Venus-Lgl2–expressing cells after they were plated on coverglass, and we could not detect an obvious difference in the number or size of focal adhesions (Figure 3, A–C). When active entosis was happening between paired Venus-Lgl2 cells, the host cell still attached to the substratum and formed normal focal adhesions (Figure 3C). Importantly, when control MDCK cells were cultured in suspension, we did not observe enhanced cell–cell internalization (Figure 3D), suggesting that nonadhesive culturing condition is not sufficient to induce significant entosis in normal MDCK cells and that Lgl-induced entosis is independent of matrix detachment.
FIGURE 3:

Venus-Lgl2–induced cell–cell internalization does not involve matrix detachment. (A and B) Overexpression of Venus-Lgl2 does not affect cell attachment to the substratum. (A) The formation of focal adhesions appears normal in Venus-Lgl2 cells. Control (top panel) and Venus-Lgl2 (bottom panel) cells were fixed at 6 h after plating on coverglass and were stained with anti-paxillin antibody. DNA was stained with Hoechst 33342. A single cell is shown. (B) Numbers and average size of paxillin-staining focal adhesions were quantified from single control and Venus-Lgl2 cells from (A). Data were from three independent experiments. *, p > 0.05. (C) The formation of focal adhesions appears normal for host cell of paired, internalizing Venus-Lgl2 cells. Representative images of paired control and internalizing Venus-Lgl2 cells are shown. Cells were stained with anti-paxillin antibody (red) and DNA dye (blue). H, host cell; I, internalized cell. (D) Suspension culture does not enhance cell–cell internalization for control MDCK cells. Equal amounts of MDCK T23 cells were seeded either on poly-l-lysine–coated coverglass or in polyhema-coated plates. Cells attached to coverglass were directly fixed at different time points, while cells in suspension were harvested, spun onto coverglass, and fixed. Fixed cells were stained with anti–β-catenin antibody and Hoechst 33342. Paired cells were analyzed, and the cell–cell internalization percentages are presented.
Venus-Lgl2–induced entosis involves invasion of lateral cell–cell contacts underneath the apical-junctional complexes
It appears that overexpression of Lgl had a dramatic impact on early stages of cell–cell contact formation. We compared the distribution of actin filaments and adherens and tight junction proteins between paired control and Venus-Lgl2 cells. Actin filaments were concentrated in the cell–cell contact region, as well as in the peripheral cell cortex, in contacting control cells (Figure S2A). In paired internalizing Venus-Lgl2 cells, actin filaments appeared to be enriched at the front of invading cells, where Venus-Lgl2 was also concentrated (Figure S2A). Similar to β-catenin, E-cadherin and Scribble were enriched at cell–cell contacts in control cells and colocalized with Venus-Lgl2 in internalizing Venus-Lgl2 cells (Figure S2, B and C). At 6 h after cell seeding, the apical-junctional proteins ZO-1, Par3 and aPKC were already accumulated at the apical regions of the cell–cell contact, which could be revealed by three-dimensional reconstitution of Z-stack confocal images (Figure 4, A–C, and Movies S4–S6). Interestingly, in paired Venus-Lgl2 cells, although these apical-junctional proteins were still apically localized, their size appeared to change as cell–cell internalization progressed, and they were frequently seen as an apical ring-like structure surrounding the trailing tail of invading cells (Figure 4, A–C). These results suggest that Venus-Lgl2 does not affect the overall polarization of cell–cell contact and that cell–cell internalization appears to involve the expansion and invasion of the contacting lateral membrane underneath the apical-junctional complexes.
FIGURE 4:
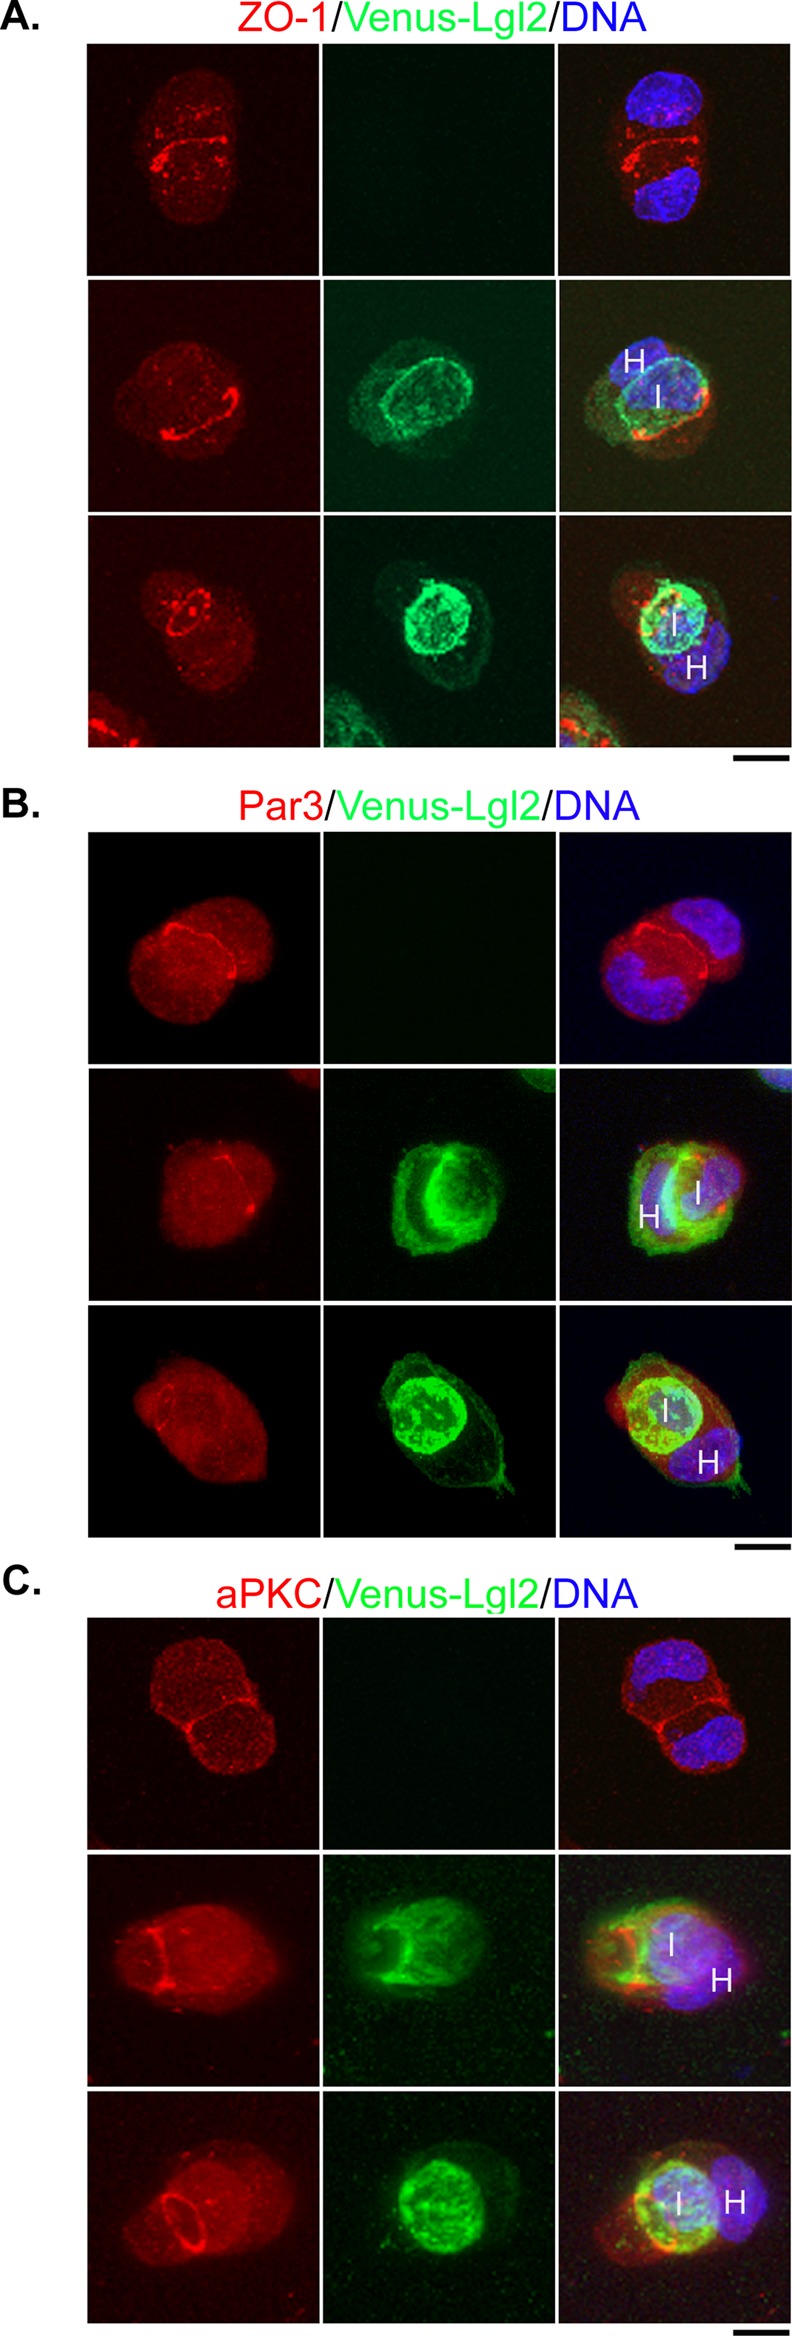
Localization of apical-junctional proteins in control and internalizing Venus-Lgl2 cells. Control MDCK T23 (A–C, top panels) or Venus-Lgl2–expressing MDCK cells (A–C, bottom two panels) were plated on poly-l-lysine–coated coverglass (1 × 10⁵ cells/well of a 24-well plate). Cells were fixed at 6 h after plating and were stained with anti-ZO-1 (A), anti-Par3 (B), or anti-aPKC (C) antibodies (red). DNA was stained with Hoechst 33342 (blue). Maximal projections of Z-stack confocal images are presented. Z-stack images were acquired at 1-μm intervals from basal to apical of the cells by confocal microscopy. H, host cell; I, internalized cell. Scale bars: 10 μm. The 360-degree rotation views of each projection image are presented as Movies S4–S6.
If the expansion and invasion of the lateral cell–cell contact were the cause of Venus-Lgl2–induced cell–cell internalization, we would expect that the invasion front of internalizing cells or the completely internalized cells would be surrounded by double membranes from both the host and the invading cells. The fact that actin, β-catenin, and E-cadherin were all seen concentrated along the invasion front of internalizing cells and around the completely internalized cells supports our hypothesis. However, those immunostainings could not distinguish the contacting membranes of different cells. To definitively test our hypothesis, we transiently transfected plasmids expressing Venus-Lgl2 or monomeric red fluorescent protein (mRFP)-Lgl2 into MDCK cells, respectively. The transfected cells were then mixed and plated at low cell density for the paired analysis, as described. Confocal microscopy analysis of internalizing paired Venus-Lgl2/mRFP-Lgl2 cells indicated that the internalized cells were indeed surrounded by both Venus-Lgl2 and mRFP-Lgl2 (Figure S3A), suggesting a double-membrane structure.
Since E-cadherin was concentrated between the double membranes of completely internalized cells, we reasoned that this portion of E-cadherin should be protected from degradation by extracellular proteases. Using surface trypsin sensitivity assay, we found that a significant fraction of E-cadherin was protected from trypsin digestion in Venus-Lgl2 cells when calcium was chelated (Figure S3B), further demonstrating that those cells were indeed completely internalized and remained in contact with membranes from the host cells.
Venus-Lgl2–induced entosis requires activation of the Rho-ROCK-myosin II pathway
Entosis appears to rely on the Rho-ROCK-myosin II pathway (Overholtzer et al., 2007). To test whether Lgl-induced cell–cell internalization is mediated through a similar mechanism, we utilized pharmacological approaches to specifically block individual components of the pathway and investigated their effects on Lgl2-induced cell–cell internalization using paired analysis. Indeed, blocking Rho activation by membrane-permeable C3 toxin (CT04), ROCK activity by Y27632 or H-1152, or myosin II activity by blebbistatin all resulted in dramatic inhibition of Venus-Lgl2–induced cell–cell internalization (Figures 5A and S4). On the other hand, treatment with the myosin light chain kinase inhibitor ML-7 led to partial inhibition of Venus-Lgl2–induced cell–cell internalization (Figure 5A), suggesting that the Rho-ROCK-myosin II cascade plays a major role in mediating the effects of Venus-Lgl2.
FIGURE 5:

Overexpression of Venus-Lgl2 results in enhanced MLC2 phosphorylation. (A) Venus-Lgl2–induced entosis relies on activation of the Rho-ROCK-myosin pathway. Quantitation of cell–cell internalization between paired control or Venus-Lgl2 cells under different treatment, as indicated. Control and Venus-Lgl2 cells were plated at low density on coverglass in culturing medium containing DMSO (0.2%), myosin II inhibitor blebbistatin (25 μM), Rho inhibitor CT04 (4.0 μg/ml), ROCK inhibitors H-1152 (2 μM) and Y-27632 (20 μM), and myosin light chain kinase inhibitor ML-7 (20 μM), as indicated. Six hours later, cells were fixed and stained with anti–β-catenin antibody. All the inhibitors were added when the cells were seeded on coverglass, except CT04, which was added 12 h before cells were dissociated and replated. Error bars indicate SD values. (B) Western blot analysis. Control MDCK T23 cells, Venus-Lgl2 cells grown in the presence (V-Lgl2 + Dox) or absence (V-Lgl2 − Dox) of doxycycline were plated on culture dishes. Six hours later, total cell lysates were harvested and subjected to Western blotting using anti-MLC2, anti-pMLC2 (S19), and anti–α-tubulin antibodies. (C) Quantitation of pMLC2 (S19) levels from Western blot analysis as described in (B). Data were from three independent experiments. Error bars indicate SD values. *, p < 0.001. (D, F) Representative images of paired control (top panel) and Venus-Lgl2 cells (bottom panel) fixed at 6 h after plating. Cells were stained with anti-pMLC2 (S19) (D, red) or anti-MLC2 antibody (F, red), and DNA dye (blue). Scale bar: 10 μm. (E) Quantification of anti-pMLC2 (S19) fluorescence intensity at the peripheral cell cortex in paired control and Venus-Lgl2 cells from (D). *, p < 0.001. (G) Representative images of paired Venus-Lgl2 cells at different stages of entosis. Cells were fixed at 6 h after plating and stained with anti-pMLC2 (S19) antibody (red). H, host cell; I, internalized cell. Scale bar: 10 μm.
Overexpression of Venus-Lgl2 leads to enhanced myosin II activation during cell–cell contact formation
Because Venus-Lgl2–induced cell–cell internalization requires activation of the Rho-ROCK-myosin II pathway (Figure 5A), we first asked whether RhoA activation was altered. However, we could not reproducibly detect changes in RhoA activation using Rho-GTP pulldown assays from control and Venus-Lgl2 cell lysates (unpublished data). As myosin II activation requires phosphorylation of the myosin regulatory light chain 2 (MLC2), which could be mediated by ROCK (Vicente-Manzanares et al., 2009), we then compared the phosphorylation status of MLC2 between control and Venus-Lgl2 cells at 6 h after cell seeding. Remarkably, while the total protein levels of MLC2 were identical in control, Venus-Lgl2(+Dox), and Venus-Lgl2(−Dox) cells, the amount of Ser-19–phosphorylated MLC2 (pMLC2(S19)) was almost doubled in Venus-Lgl2(−Dox) cells (Figure 5, B and C). Similar results were obtained when a pMLC2(T18, S19)-specific antibody was used (unpublished data). Consistent with the Western blot analysis, we observed significantly enhanced pMLC2(S19) immunostaining at the peripheral cell cortex in Venus-Lgl2–expressing cells, compared with control cells (Figure 5, D and E). The total MLC2 immunostaining was not obviously different (Figure 5F). The strong peripheral pMLC2(S19) staining was observed throughout all stages of cell–cell internalization (Figure 5G). Interestingly, although Venus-Lgl2 seems to be more concentrated at cell–cell contacts, no obvious increase of pMLC2(S19) signal was observed at cell–cell contact regions (Figure 5G). We conclude that overexpression of Venus-Lgl2 leads to enhanced MLC2 phosphorylation at the peripheral cell cortex of contacting MDCK cells.
Venus-Lgl2–expressing cells preferentially invade control cells
To more directly and precisely reveal the effect of overexpressed Lgl2 on myosin activation, we performed “mix and replate” experiments. Control MDCK T23 and Venus-Lgl2 cells were mixed at a 1:1 ratio, plated at low density on coverglasses, and fixed and stained with anti-pMLC2(S19) antibody at 6 h after plating. Quantitation of the peripheral pMLC2(S19) fluorescence intensity indicated that Venus-Lgl2 cells had twice as much (2.25 ± 0.06, n = 50) pMLC2(S19) signal than control cells (Figure 6A). Interestingly, when performing the mix and replate experiments, we noticed that a high percentage of paired control and Venus-Lgl2 cells exhibited cell–cell internalization. We repeated such experiments for paired cell–cell internalization analysis and stained the cells with anti–β-catenin antibody (Figure 6B). Consistent with previous results (Figure 1E), ∼20% (19.9 ± 1.2, n = 200) of paired control cells and 60% (61.0 ± 2.0, n = 200) of paired Venus-Lgl2 cells showed cell–cell internalization (Figure 6C). Remarkably, nearly 90% (86.0 ± 3.5, n = 200) of paired control/Venus-Lgl2 cells were internalizing each other (Figure 6C). Interestingly, among those internalizing paired control/Venus-Lgl2 cells, 93% exhibited the Venus-Lgl2 cell invading the control cell (Figure 6, B and C). As Venus-Lgl2 cells have higher pMLC2 levels, and hence higher myosin II activity, these results suggest unbalanced myosin II activation between contacting cells may lead to entosis and cells with higher myosin II activity may preferentially invade contacting cells with lower myosin II activity.
FIGURE 6:

Entosis between Venus-Lgl2 and control cells. (A) Representative images of paired [control/Venus-Lgl2] cells stained with anti-pMLC2(S19) antibody (red) at 6 h after plating on coverglass. DNA was stained with Hoechst 33342. H: host cell; I: internalized cell. Scale bar: 10 μm. (B) Venus-Lgl2 cells invade control cells—mix and replate experiment. Representative images of paired (control/Venus-Lgl2) cells are presented. Control and Venus-Lgl2–expressing MDCK cells were mixed and replated on coverglass, fixed 6 h later, and stained with anti–β-catenin antibody (red). DNA was stained with Hoechst 33342. H, host cell; I, internalized cell. Scale bar: 10 μm. (C) Quantitation of cell–cell internalization. Mixed control and Venus-Lgl2–expressing cells were plated on coverglass and fixed 6 h later. Cells were stained with anti–β-catenin antibody and Hoechst 33342. Control and Venus-Lgl2 cells were distinguished by the presence or absence of Venus-Lgl2 signal. Percentage of internalizing paired ([control/control], [Venus-Lgl2/Venus-Lgl2], and [control/Venus-Lgl2]) cells were plotted. Internalizing (control/Venus-Lgl2) pairs were divided into two categories representing Venus-Lgl2 cell invading control cell (inside) and vice versa (outside). Data were from three independent experiments. Error bars indicate SD values.
Endogenous Lgl is required for myosin II activation during cell–cell contact formation
Although overexpression of Lgl had a significant effect on myosin II activation, it is not known whether endogenous Lgl plays a role in modulating myosin II activity. We then knocked down endogenous Lgl1 and Lgl2 by expressing short hairpin RNAs (shRNAs) specific for canine Lgl1 and Lgl2, as previously described (Yamanaka et al., 2006). The knockdown (KD) efficiency was confirmed by Western blot and immunostaining analysis (Figure S5). Control KD and Lgl1/2 double KD cells were then replated on a culture dish at low density, and the pMLC2(S19) level was compared at 6 h after plating, as we did for Venus-Lgl2 cells. Remarkably, while the total MLC2 level was similar between control and Lgl1/2 KD cells, a significant reduction of pMLC2 (S19) level was observed in Lgl1/2 double KD cells using Western blot analysis (Figure 7, A and B). Immunostaining analysis also revealed an obvious reduction of pMLC2 (S19) signal in Lgl1/2 KD cells, especially when comparing contacting control cells (green fluorescent protein [GFP]-negative) and Lgl1/2 KD cells (GFP-positive; Figure 7, C and D). These results demonstrate that endogenous Lgl1/2 is required for myosin activation during early cell–cell contact formation.
FIGURE 7:

Knockdown of Lgl1/2 results in reduced MLC2 phosphorylation and invasion by control cells. (A) MDCK cells were transfected with plasmids expressing control or Lgl1/2 shRNA. Forty-eight hours later, cells were replated at low density on culture dishes. Cell lysates were harvested 6 h later and subjected to Western blotting using anti-MLC2, anti-pMLC2 (S19), and anti–α-tubulin antibodies. (B) Quantitation of MLC2 and pMLC2 (S19) levels from Western blot analysis as described in (A). Data were from three independent experiments. Error bars indicate SD values. *, p < 0.01. (C) Representative images of paired control (GFP-negative) and Lgl1/2 KD (GFP-positive) cells stained with anti-pMLC2 (S19) antibody (red). DNA was stained with Hoechst 33342. Scale bar: 10 μm. (D) Quantification of anti-pMLC2 (S19) fluorescence intensity at the peripheral cell cortex in control and Venus-Lgl2 cells from (C). Data were from three independent experiments. Error bars indicate SD values. *, p < 0.01. (E) Control cells invade Lgl1/2 KD cells. Control (GFP-negative) or Lgl1/2 shRNA (GFP-positive) transfected cells were collected 48 h after transfection, mixed, and replated on coverglass for paired analysis. Representative images of paired [Lgl1/2 KD/Lgl1/2 KD] cells (top panel) and [control/Lgl1/2 KD] cells (bottom two panels) are shown. Cells were fixed at 6 h after replating and stained with anti–β-catenin antibody (red). DNA was stained with Hoechst 33342. Scale bar: 10 μm. (F) Quantitation of cell–cell internalization in paired analysis as described in (D). Percentage of internalizing paired ([control/control], [Lgl1/2 KD/Lgl1/2 KD], and [control/Lgl1/2 KD]) cells were plotted. Internalizing (control/Lgl1/2 KD) pairs were divided into two categories representing Lgl1/2 KD cell invading control cell (inside) and vice versa (outside). Data were from three independent experiments. Error bars indicate SD values.
Entosis between control cells and Lgl1/2 KD cells
Next we performed the paired cell–cell internalization assay for Lgl1/2 KD cells. Interestingly, no obvious cell–cell internalization was observed between paired Lgl1/2 KD cells. However, in a limited number of paired GFP-positive Lgl1/2 KD and GFP-negative nontransfected control cells, cell–cell internalization was frequently observed. To confirm this result, we performed mix and replate experiments using Lgl1/2 KD cells (GFP-positive) and pure control cells (GFP-negative). Indeed, while < 20% of paired control/control (18.6 ± 1.2, n = 200) and Lgl1/2 KD/Lgl1/2 KD (15.6 ± 1.6, n = 200) cells were positive for cell–cell internalization, close to 60% (57.5 ± 2.7, n = 200) of paired Lgl1/2 KD/control cells were internalizing each other (Figure 7, E and F). Interestingly, among those internalizing paired Lgl1/2 KD/control cells, 87.6% showed GFP-negative control cells were internalized by GFP-positive Lgl1/2 KD cells (Figure 7, E and F). Because control cells have higher myosin activity than Lgl1/2 KD cells (Figure 7, A and B), these results further confirmed our hypothesis that cells with higher myosin activity preferentially invade cells with lower myosin activity. Most importantly, these results indicate that the endogenous level of myosin activity is sufficient for driving entosis if the contacting cell has lower myosin activation.
Depletion of Par3 leads to enhanced myosin II activation and entosis without matrix detachment
The paired analysis allowed us to further study the mechanisms underlying Lgl-induced cell–cell internalization. As previous studies suggested that mammalian Lgl counteracts Par3 function in regulating tight junction assembly (Plant et al., 2003; Yamanaka et al., 2003, 2006), we tested Par3 KD cells we generated recently (Hao et al., 2010). Interestingly, stable depletion of endogenous Par3 also led to dramatic entosis during early stages of cell–cell contact formation, very similar to Venus-Lgl2 overexpression (Figures 8, A and B, and S6A). The apical-junctional proteins ZO-1 and aPKC also marked the invasion sites between paired internalizing Par3 KD cells (Figure S6, B and C). The cell–cell internalization between Par3-depleted cells was also blocked by Rho, ROCK, and myosin II inhibition, and partially by myosin light chain kinase (MLCK) inhibition (Figure 8C). The completely internalized cells also underwent predominantly nonapoptotic cell death (unpublished data). Importantly, Par3 depletion also led to enhanced MLC2 phosphorylation, while the total MLC2 level was not altered (Figures 8, D and E, and S6, D and E). The effects of Par3 depletion on cell–cell contact and MLC phosphorylation were observed in multiple Par3-stable KD cell lines expressing different shRNAs against distinct regions of Par3. Most importantly, they could be rescued by reexpressing shRNA-resistant human Par3 (Figures 8, B, D, and E, and S6, D and E), indicating that they were attributed to Par3 depletion. Again, we performed mix and replate experiments for control and Par3 KD cells. Dramatic cell–cell internalization was observed between paired control/Par3 KD cells and, like Venus-Lgl2 cells, Par3 KD cells were predominantly found to be internalized by control cells (Figure 8F). Thus depletion of Par3 phenocopies the effects of Lgl overexpression on early stages of cell–cell contact formation.
FIGURE 8:

Depletion of Par3 leads to enhanced MLC2 phosphorylation and entosis during cell–cell contact formation. (A) Images of control (top panel) or Par3 KD (bottom panels) lentivirus-transduced MDCK cells. Cells were fixed at 6 h after plating and stained with anti–β-catenin antibody (red). DNA was stained with Hoechst 33342. Virus-transduced cells express GFP. H, host cell; I, internalized cell. Scale bar: 10 μm. (B) Quantitation of cell–cell internalization. Stable cell lines transduced by control lentivirus (control), lentiviruses expressing different Par3 shRNA (Par3-KD1 and Par3-KD2), and corresponding rescue cell lines expressing shRNA-resistant human Par3 were subjected to paired analysis. Cells were fixed at 6 h after plating and analyzed as described in Figure 1E. Data were from three independent experiments. Error bars indicate SD values. (C) Par3 KD-induced cell–cell internalization requires Rho, ROCK, and myosin II activation. Control and Par3 KD cells were treated as described in Figure 5A. Percentages of cell–cell internalization between paired cells at 6 h after plating are presented. Data were from three independent experiments. Error bars indicate SD values. (D) Par3 depletion results in enhanced MLC2 phosphorylation. Control, Par3 KD, and Par3 KD rescue cells were plated at low density on culture dishes. Cell lysates were harvested 6 h later and subjected to Western blotting using anti-Par3, anti-MLC2, anti-pMLC2 (S19), and anti–α-tubulin antibodies. (E) Quantitation of pMLC2 levels from Western blot analysis in (D). Data were from three independent experiments. Error bars indicate SD values. * p < 0.001. (F) Par3 KD cells invade control cells. Control (GFP-negative) and Par3 KD (GFP-positive) cells were mixed and replated on coverglass. Cells were fixed at 6 h after plating and stained with anti–β-catenin antibody and Hoechst 33342. Percentage of internalizing paired ([control/control], [Par3 KD/Par3 KD], and [control/Par3 KD]) cells are shown. Internalizing (control/Par3 KD) pairs were divided into two categories representing Par3 KD cell invading control cell (inside) and vice versa (outside). Data were from three independent experiments. Error bars indicate SD values.
Lgl and Par3 antagonize each other in regulating cell–cell contact formation
We have shown that both overexpression of Lgl and depletion of Par3 led to enhanced myosin II activation during early stages of cell–cell contact formation. Previous studies have suggested that Lgl and Par3 may functionally compete with each other in association with the Par6/aPKC complex. In Lgl1/2-depleted MDCK cells, a significant increase of Par3 in the Par6/aPKC complex was observed (Yamanaka et al., 2006). Consistently, we observed a dramatic reduction of endogenous Par3 in the immunoprecipitated proteins associated with Par6 in Venus-Lgl2–overexpressing cells, while the association between endogenous aPKC and Par6 was not affected (Figure 9A). If Par3 and Lgl are functionally antagonizing each other during cell–cell contact formation, we would expect that overexpression of Par3 in Venus-Lgl2 cells or knocking down Lgl1/2 in Par3-depleted cells should inhibit the effects of Lgl overexpression and Par3 depletion, respectively. We used the paired cell–cell internalization assay to test our hypothesis. Indeed, overexpression of Par3 inhibited Venus-Lgl2–induced cell–cell internalization (Figure 9B) and KD of Lgl1/2 blocked cell–cell internalization between Par3-depleted cells (Figure 9C). We conclude that endogenous Par3 and Lgl antagonize each other in regulating cell–cell contact formation.
FIGURE 9:

Lgl and Par3 antagonize each other in regulating cell–cell internalization. (A) Overexpression of Lgl inhibits the association of Par3 with Par6/aPKC complex. Total cell lysates from control MDCK T23, Venus-Lgl2 cells cultured in the presence (V-Lgl2 (+Dox)) or absence (V-Lgl2 (−Dox)) of doxycycline were subjected to immunoprecipitation using anti-Par6B antibodies. The immunoprecipitates were separated by SDS–PAGE and blotted with anti-Par3, anti-aPKC, anti-Par6B, and anti–α-tubulin antibodies. (B) Overexpression of Par3 inhibits Venus-Lgl2–induced cell–cell internalization. Venus-Lgl2 cells transfected with pK-mRFP or pK-mRFP-Par3 expression plasmids. Twenty-four hours after transfection, cells were subjected to paired analysis and fixed at 6 h after replating. Only paired cells that expressed mRFP or mRFP-Par3 were counted. Cell–cell internalization was defined by Venus-Lgl2 signal. Data were from three independent experiments. Error bars indicate SD values. (C) Knockdown of Lgl1/2 inhibits cell–cell internalization induced by Par3 depletion. Stable Par3 KD cells were cotransfected with pSuper-Lgl1, pSuper-Lgl2, and mRFP (5:5:1 ratio). Forty-eight hours after transfection, cells were subjected to paired analysis, fixed at 6 h after plating, and stained with anti–β-catenin antibody. Only contacting paired cells that both expressed mRFP were counted. Data were from three independent experiments. Error bars indicate SD values. (D) Working model. We propose that Par3 and Lgl1/2 antagonize each other in modulating myosin II activation along the peripheral cell cortex of contacting cells, through the Rho-ROCK pathway. The antagonistic effect between Par3 and Lgl1/2 is probably mediated through competitive binding of the Par6/aPKC complex. Balanced myosin II activation is critical for normal cell–cell contact formation and expansion (a). Overactivation of myosin II will lead to entosis, for example, when Lgl is overexpressed or Par3 is depleted (b). Unbalanced myosin II activation between two contacting cells, such as paired control/Venus-Lgl2, control/Par3 KD, and control/Lgl1/2 KD cells, will also result in entosis (c). Myosin II activity is reflected by the intensity of pMLC signal (red).
DISCUSSION
Previous studies revealed that actomyosin contraction along the peripheral cell cortex drives cell–cell contact expansion (Krendel et al., 1999; Ivanov et al., 2004, 2005; Shewan et al., 2005; Yamada and Nelson, 2007; Cavey and Lecuit, 2009). We have now identified Par3 and Lgl1/2 as critical players in modulating actomyosin contraction during early stages of cell–cell contact formation. Par3 and Lgl1/2 appear to exert opposing effect on myosin activation: while depletion of Par3 leads to enhanced myosin activation, knockdown of Lgl1/2 results in the opposite. It is noteworthy that while MLC2 phosphorylation was significantly enhanced at the peripheral cell cortex in contacting cells overexpressing Venus-Lgl2 or depleted of Par3, such enhancement was not observed at the cell–cell contacts, suggesting the existence of dominant inhibitory mechanisms for myosin II activation at this region, as was proposed previously (Wildenberg et al., 2006; Yamada and Nelson, 2007). Although endogenous Par3 and Lgl1/2 seem to be more concentrated at cell–cell contacts, their effects on myosin activation appear to occur across the peripheral cell cortex. Par3 has been recently shown to associate with the plasma membrane through direct interaction with membrane-bound lipids (Krahn et al., 2010). Lgl is also considered a membrane-associated protein, although the mechanism for its membrane targeting is not known (Vasioukhin, 2006). We propose that endogenous Par3 and Lgl1/2 may regulate myosin activation at the peripheral cell cortex, rather than at the cell–cell contact region, during early stage of cell–cell contact formation (Figure 9D).
Surprisingly, overexpression of Lgl and depletion of Par3 both led to entosis—the formation of cell-in-cell structures. The cell–cell internalization we observed in MDCK cells has all the characteristics described for entosis, such as the dependence on Rho, ROCK, and myosin activities; the resulting nonapoptotic cell-in-cell death of the target cells; and the frequent aneuploidy of the host cells. So far, the only known inducer of entosis is matrix detachment in culture (Florey et al., 2010). Our study indicates that entosis could happen without matrix detachment, especially during early stages of cell–cell contact formation, suggesting that it could be a more general phenomenon when cell–cell contacts are compromised. Under adhesive culturing conditions, simple epithelial cells specify cell–cell contacts into apical and basal-lateral domains shortly after cadherin engagement. We show that entosis induced by Lgl and Par3 involves active invasion of the lateral membrane underneath the apical-junctional complexes (Figures 4 and S6), probably due to uncontrolled expansion of the lateral cell–cell contacts driven by enhanced actomyosin contraction along the peripheral cell cortex. The induced entosis under adhesive culturing conditions will allow us to follow the fate of affected cells for long periods of time, which is usually not possible for cells cultured in suspension. It will also make it easier for us to explore the biological relevance and the underlying molecular mechanisms of such a fascinating phenomenon, which was described more than a century ago (Overholtzer and Brugge, 2008).
One important finding of our study is that while myosin II activation is required for cell–cell contact expansion, this activation must be carefully controlled for normal cell–cell contact formation. Overactivation of myosin II will disrupt normal cell–cell contact formation and lead to entosis, for example, when Lgl is overexpressed or Par3 is depleted (Figure 9D). A more intriguing finding is that the activities of myosin II in two contacting cells need to be balanced for normal cell–cell contact formation. Unbalanced myosin II activation between two contacting cells, such as paired control/Venus-Lgl2, control/Par3 KD, and control/Lgl1/2 KD cells, will also result in entosis (Figure 9D). Heterogeneity is often observed in cultured normal and tumor cell lines, which may lead to differences in myosin II activation within the individual cells. We hypothesize that such unbalanced myosin II activation may be a major driving force for entosis in epithelial cells.
How do Lgl and Par3 modulate myosin II activation? Drosophila Lgl has been shown to physically interact with myosin and negatively regulate myosin activity (Strand et al., 1994). This inhibitory effect of Lgl on myosin has been proposed as underlying the function of Lgl in regulating cell polarization and asymmetric cell division of neuroblasts (Barros et al., 2003), although such a notion has been challenged by a recent study showing that the function of Lgl in neuroblasts is instead through inhibition of aPKC (Atwood and Prehoda, 2009). Our results indicate that mammalian Lgl positively regulates myosin II activation during cell–cell contact formation, which is opposite to what was proposed for Drosophila. We were not able to detect an association of Lgl with myosin II or MLC2, even in cells overexpressing Venus-Lgl2 (unpublished data), suggesting that the effect of Lgl on myosin may be indirect in our system.
Because both Par3 and Lgl physically interact and form a complex with Par6 and aPKC, albeit in a mutually exclusive manner (Plant et al., 2003; Yamanaka et al., 2003, 2006), the antagonistic function of Par3 and Lgl on myosin activation may be mediated through Par6 and/or aPKC (Figure 9D). There are several potential ways by which Par6/aPKC could modulate the Rho-ROCK-myosin pathway. In cultured hippocampal neurons, Par6 and aPKC have been shown to regulate Rho activation and affect spine morphogenesis (Zhang and Macara, 2008). Although we could not reproducibly detect changes in Rho activation in cells overexpressing Lgl or depleted of Par3, we could not rule out the possibility of technique issues. Nonetheless, blocking Rho activation inhibited entosis induced by Lgl overexpression or Par3 depletion (Figures 5A and 8C). In polarized epithelial cells, aPKC was proposed as an antagonist of myosin II–driven centripetal contraction of the circumferential actin cables (Kishikawa et al., 2008). Recently it was shown that aPKC could phosphorylate ROCK and regulate its localization at cell–cell junctions (Ishiuchi and Takeichi, 2011), suggesting a direct role of aPKC in myosin activation.
This simple paired cell–cell internalization assay will be useful for further determining the molecular mechanisms by which Lgl and Par3 regulate myosin II activation. Although we are currently focusing on early stages of cell–cell contact formation, such mechanisms could also play critical roles during later stages of cell polarization and epithelial morphogenesis, in which the importance of Par3 and Lgl has been well documented.
MATERIALS AND METHODS
Reagents
Monoclonal mouse anti-Lgl1 antibody was a kind gift from Patrick Brennwald (University of North Carolina). Rabbit anti-Lgl2 antibody was generated using recombinant glutathione S-transferase fusion protein of the C-terminal 90 amino acids of human Lgl2. The following antibodies were also used: monoclonal mouse anti–α-tubulin (Sigma-Aldrich, St. Louis, MO), anti-ZO-1 (Zymed; Invitrogen, Carlsbad, CA), anti–β-catenin (BD Biosciences, San Jose, CA), anti–E-cadherin (BD Biosciences), anti-Scribble (Santa Cruz Biotechnology, Santa Cruz, CA), anti-pMLC2 (S19; Cell Signaling Technology, Danvers, MA); monoclonal rat anti–E-cadherin (Santa Cruz Biotechnology); polyclonal rabbit anti-aPKC (Santa Cruz Biotechnology), anti-Par6B (Santa Cruz Biotechnology), anti-pMLC2 (T18S19; Cell Signaling Technology), anti-Par3 (Millipore, Billerica, MA), anti-MLC2 (Cell Signaling Technology); secondary Alexa Fluor 488, 594, and 680 (Invitrogen, Carlsbad, CA) and IRDye800 (Rockland Immunochemicals, Gilbertsville, PA) conjugated goat anti-mouse or rabbit antibodies. Hoechst 33342 (Invitrogen) was used for DNA staining and rhodamine-conjugated phalloidin (Invitrogen) was used to visualize filamentous actin. Pharmacological inhibitors used were: membrane-permeable Rho inhibitor (CT04; Cytoskeleton, Denver, CO), ROCK inhibitor Y-26732 and H-1152 (EMD; Millipore, Billerica, MA), MLCK inhibitor (ML-7; EMD; Millipore), myosin II inhibitor (blebbistatin; Sigma-Aldrich), caspase inhibitor ZVAD-FMK (EMD; Millipore), and 3-MA (Sigma-Aldrich).
Cell culture and stable cell lines
MDCK cells were cultured in DMEM supplemented with 10% fetal bovine serum (FBS) and penicillin–streptomycin (100 IU/ml and 100 mg/ml, respectively) at 37°C in a humidified 5% CO2 atmosphere.
Stable Tet-Off–inducible MDCK cell lines were generated as previously described (Du et al., 2001). Briefly, an enhanced yellow fluorescent protein (Venus) was cloned into pTRE2Hyg vector (Clontech, Mountain View, CA). cDNAs encoding human Lgl2 or mouse-Lgl1 were inserted downstream of, and in-frame with, Venus, respectively. These plasmids were transfected into MDCK T23 cells, which express the tetracycline-repressible transactivator. Cells were passaged 24 h posttransfection onto P-100 plates in medium containing 200 μg/ml hygromycin B and 20 ng/ml doxycycline. After selection for 7–10 d, individual colonies were isolated using cloning rings (Thermo Fisher Scientific, Lafayette, CO), and the expression of Venus-fusion proteins was assessed by immunofluorescence microscopy and Western blotting after removal of doxycycline.
Cell–cell internalization assay
For adhesive paired analysis, monolayer cells were trypsinized and dissociated from culture dishes and resuspended in culture medium. Cells (1×10⁵) were seeded in each well of a 24-well tissue culture plate (Corning Lifesciences, Tewksbury, MA) supplied with or without poly-l-lysine–coated coverglass (15-mm, round; Fisher). At different time points, cells were fixed and immunostained. For most paired analyses, cells were fixed at 6 h after seeding.
For the suspension assay, 1 × 10⁵ cells were seeded in each well of a 24-well tissue culture plate (Corning Lifesciences) that was precoated with polyhema (Figure 3D). At indicated time points, cells were carefully transferred to another well that was supplied with a poly-l-lysine–coated coverglass, and immediately centrifuged in an accuSpin 3 (Fisher Scientific, Pittsburgh, PA) benchtop centrifuge on a plate holder. Cells on the coverglass were immediately fixed and analyzed.
Surface biotinylation
Cells that were seeded on poly-l-lysine–coated coverglass were washed with PBS + CaCl2 (1.8 mM), incubated with biotin (0.5 mg/ml in PBS + CaCl2) for 10 min at 37°C, washed with PBS + CaCl2, and fixed with 4% paraformaldehyde (PFA). Fixed cells were stained with streptavidin-Alexa568 (Invitrogen) and Hoechst 33342.
TEM
Venus-Lgl2 cells were plated on tissue culture dishes for 12 h, washed in PBS, trypsinized, and harvested. The cell pellet was fixed in 2% glutaraldehyde in 0.1 M sodium cacodylate (NaCac) buffer (pH 7.4), postfixed in 2% osmium tetroxide in NaCac, stained en bloc with 2% uranyl acetate, dehydrated with a graded ethanol series, and embedded in epon-araldite resin. Thin sections were cut with a diamond knife on a Leica EM UC6 ultramicrotome (Leica Microsystems, Bannockburn, IL), collected on copper grids, and stained with uranyl acetate and lead citrate. Cells were observed in a JEM 1230 transmission electron microscope (JEOL USA, Peabody, MA) at 110 kV and imaged with an UltraScan 4000 charge-coupled device (CCD) camera and First Light Digital Camera Controller (Gatan, Pleasanton, CA).
Transient shRNA-mediated KD
pSuper-based vectors were used for the KD of Lgl1 and Lgl2 in MDCK cells, as previously described (Yamanaka et al., 2006). Briefly, long oligos containing target sequences were cloned downstream of the H1 promoter of pSuper or pSuper-GFP. After sequencing verification, individual plasmids were electroporated into MDCK cells using Nucleofector (Lonza, Basel, Switzerland) to test KD efficiency by Western blot or immunofluorescence analysis. For Lgl1/2 double KD, equal amounts of pSuper-Lgl1 and pSuper-Lgl2 (1 μg each) were mixed and electroporated into MDCK cells. Cells were harvested 48 h later for analysis. The shRNA target sequence for Lgl1 is 5′-GGTGGCACTCTGCAAGTAC-3′; and for Lgl2 it is 5′-GATGAGAGTTTCACACTGC-3′.
Lentivirus-mediated stable KD and rescue
pLV-mU6-EF1-GFP vector (Biosettia, San Diego, CA) was used for lentivirus-mediated stable KD of Par3 in MDCK cells, as previously described (Zheng et al., 2010; Hao et al., 2010). Briefly, long oligos containing target sequences were cloned downstream of the U6 promoter in pLV-mU6-EF1-GFP to generate specific shRNA vectors. Once sequence-verified and KD efficiency-tested by transient transfection, the shRNA vectors were cotransfected with the lenti-packaging mix (Invitrogen) into HEK293 cells, and the pseudovirus-containing supernatant was collected 48 h posttransfection. Virus supernatant was used to infect MDCK cells cultured in 12-well plates. At 24 h after infection, the cells were passaged onto P-100 plates, and transduced clones (based on virus-mediated expression of GFP) were marked and isolated using cloning rings 1 wk later. The KD efficiency was analyzed by Western blot and immunostaining of Par3. Target sequences for Par3 were 5′-GGTCACACCTTCAGTTCTTCG-3′ (Par3-KD1) and 5′-GGAACAAGCGAGGAATGATCC-3′ (Par3-KD2).
For rescue experiments, human Par3 cDNA, which is resistant to Par3-KD1 and Par3-KD2, was PCR-amplified and cloned in pK-HA3 vector. The HA3-Par3 cassette was cut out and cloned in pCDH-CMV-MCS-EF1-Puro, a lentivirus-mediated expression vector. Lentiviruses were produced as described above. Virus supernatant was used to infect selected Par3-KD1 or Par3-KD2 cells, respectively. Transduced cells were selected with puromycin (1 μg/ml), and individual puromycin-resistant cell lines were isolated. After Western blot analysis, cell lines that showed ectopic Par3 expression levels similar to endogenous Par3 were selected for the rescue experiments.
Western blotting and immunoprecipitation
Cells (4 × 10⁶) were seeded on a 100-mm culture dish. Six hours later, cells were washed with cold phosphate-buffered saline (PBS) and collected in cell lysis buffer (25 mM HEPES, pH 7.4, 150 mM NaCl, 0.5% Triton X-100, 0.5 mM EDTA, 5 mM MgCl2, 1 mM dithiothreitol, 1 mM phenylmethylsulfonyl fluoride, 10 μg/ml leupeptin, 20 μg/ml aprotinin, 10 μg/ml pepstatin, 10 mM NaF, 1 mM NaVO3). Cell debris was removed by centrifugation at 14,000 rpm for 20 min at 4°C. SDS sample buffer was added to equal amounts of cell lysate, and proteins were separated by SDS–PAGE, transferred onto nitrocellulose membranes, and analyzed with the antibodies indicated in the text. Immunoprecipitation was performed as previously described (Du and Macara, 2004). Briefly, control MDCK T23 or stable Tet-Off–inducible MDCK cells expressing Venus-Lgl2 were cultured in medium in the presence or absence of doxycycline. Each type of cell (1.2 × 10⁷ per type) was seeded on three 100-mm culture dishes. Six hours later, cells were harvested and lysed in cell lysis buffer. Equal amounts of cleared cell lysate were incubated with 2 μg anti-Par6B antibody at 4°C for 1 h. Protein G agarose (Millipore), blocked with 5% bovine serum albumin (BSA; Sigma-Aldrich), was added, and the mixture was incubated for 45 min at 4°C. Immunoprecipitates were washed four times with cell lysis buffer and separated by SDS–PAGE. Proteins were transferred to nitrocellulose membrane and detected using anti-Par3, anti-aPKC, and anti-Par6B antibodies.
Immunofluorescence microscopy
MDCK cells grown on poly-l-lysine–coated coverglass were fixed with 4% paraformaldehyde in PBS and permeabilized with 0.5% Triton X-100 in PBS. Fixed cells were blocked with 10% normal goat serum/1% BSA in PBS for 1 h, and then incubated for 1 h with the primary antibodies. Cells were then washed and incubated for 1 h with DNA stain Hoechst 33342 and goat anti-mouse or anti-rabbit secondary antibodies coupled to Alexa Fluor 488 or Alexa Fluor 594 (Invitrogen). Epifluorescent images were taken on a Nikon TE2000 inverted microscope using a CFI PLAN FLUOR 60×/1.4 numerical aperture (N.A.) oil-immersion objective and MetaMorph software (Molecular Devices, Sunnyvale, CA). Confocal images were captured on a Zeiss 510 LSM confocal microscope using a Plan Apochromat 63×/1.4 N.A. oil-immersion objective (Carl Zeiss, Oberkochen, Germany) and analyzed using the LSM Image Examiner (Carl Zeiss) and Adobe Photoshop software (San Jose, CA).
Quantification of focal adhesions and phosphorylated MLC2
For quantification analysis, all images were taken using identical microscopic settings. For quantification of focal adhesions, 20 cells in each group were randomly selected to quantify the number and average size of focal adhesions using ImageJ software. A particle analysis was performed on images to select focal adhesions based on anti-paxillin staining, and the number and size of the particles were quantified. Similarly, ImageJ software was used to quantify the fluorescence intensities of cortical pMLC2 (S19) staining.
E-cadherin trypsin protection assay
Cells (4 × 10⁶) were seeded on a 100-mm culture dish. Six hours later cells were treated with crystalline trypsin (0.05%wt/vol) in Hank's balanced salt solution (HBSS) in the presence of either 2 mM CaCl2 or 2 mM ethylene glycol tetraacetic acid for 30 min at 37°C before adding HBSS-Ca2+-fetal bovine serum (FBS; 0.05%) to stop the action of trypsin. Cells were collected and lysed directly with 2X sample buffer. Equal volumes of samples were analyzed by SDS–PAGE, whiich was followed by Western blot analysis with an antibody directed against the ecto-domain of E-cadherin (DECMA-1). α-Tubulin was used as a sample loading control.
Live-cell, time-lapse analysis
Live-cell, time-lapse analyses were performed as previously described (Du and Macara, 2004). Cells were grown on Delta T dishes (Bioptechs, Butler, PA) in F10 medium supplemented with 10% FBS and antibiotics. For visualizing nuclei, 2 μg/ml of Hoechst 33342 was added to the medium, and the cells were incubated for 5 min. After several washes, the dish was filled with F10 medium and sealed with a 40-mm coverslip. The dish was then placed in a temperature control system (Bioptechs) that maintained a temperature of 37°C. Time-lapse sequences were collected on a Nikon TE2000 microscope using a CFI Plan Fluor 40×/1.3 N.A. oil-immersion objective, a CoolSnap CCD camera, and MetaMorph software.
Supplementary Material
Acknowledgments
We thank Patrick Brennwald of the University of North Carolina for the anti-Lgl1 antibody. We also thank Robert Smith of Medical College of Georgia Electron Microscopy Core for helping with electron microscopy analysis. This work was supported by grants from the National Institutes of Health (GM079560) and the American Cancer Society (RSG0717601CSM) to Q.D.
Abbreviations used:
- 3-MA
3-methyladenine
- aPKC
atypical protein kinase C
- BSA
bovine serum albumin
- CCD
charge-coupled device
- DIC
differential interference contrast
- DMSO
dimethyl sulfoxide
- FBS
fetal bovine serum
- GFP
green fluorescent protein
- HBSS
Hank's balanced salt solution
- KD
knockdown
- Lgl1/2
mammalian homologues of Drosophila lethal(2)giant larvae
- MDCK
Madin-Darby canine kidney
- MLC2
myosin regulatory light chain 2
- MLCK
myosin light chain kinase
- mRFP
monomeric red fluorescent protein
- N.A.
numerical aperture
- Par3
partitioning defective 3 homologue (Caenorhabditis elegans)
- Par6
partitioning defective 6 homologue
- PBS
phosphate-buffered saline
- ROCK
Rho-associated, coiled-coil containing protein kinase
- shRNA
short hairpin RNA
- TEM
transmission electron microscopy
Footnotes
This article was published online ahead of print in MBoC in Press (http://www.molbiolcell.org/cgi/doi/10.1091/mbc.E11-11-0940) on April 11, 2012.
REFERENCES
- Adams CL, Chen YT, Smith SJ, Nelson WJ. Mechanisms of epithelial cell-cell adhesion and cell compaction revealed by high-resolution tracking of E-cadherin-green fluorescent protein. J Cell Biol. 1998;142:1105–1119. doi: 10.1083/jcb.142.4.1105. [DOI] [PMC free article] [PubMed] [Google Scholar]
- Atwood SX, Prehoda KE. aPKC phosphorylates Miranda to polarize fate determinants during neuroblast asymmetric cell division. Curr Biol. 2009;19:723–729. doi: 10.1016/j.cub.2009.03.056. [DOI] [PMC free article] [PubMed] [Google Scholar]
- Barros CS, Phelps CB, Brand AH. Drosophila nonmuscle myosin II promotes the asymmetric segregation of cell fate determinants by cortical exclusion rather than active transport. Dev Cell. 2003;5:829–840. doi: 10.1016/s1534-5807(03)00359-9. [DOI] [PubMed] [Google Scholar]
- Betschinger J, Mechtler K, Knoblich JA. The Par complex directs asymmetric cell division by phosphorylating the cytoskeletal protein Lgl. Nature. 2003;422:326–330. doi: 10.1038/nature01486. [DOI] [PubMed] [Google Scholar]
- Cavey M, Lecuit T. Molecular bases of cell-cell junctions stability and dynamics. Cold Spring Harb Perspect Biol. 2009;1:a002998. doi: 10.1101/cshperspect.a002998. [DOI] [PMC free article] [PubMed] [Google Scholar]
- Cavey M, Rauzi M, Lenne PF, Lecuit T. A two-tiered mechanism for stabilization and immobilization of E-cadherin. Nature. 2008;453:751–756. doi: 10.1038/nature06953. [DOI] [PubMed] [Google Scholar]
- Du Q, Macara IG. Mammalian Pins is a conformational switch that links NuMA to heterotrimeric G proteins. Cell. 2004;119:503–516. doi: 10.1016/j.cell.2004.10.028. [DOI] [PubMed] [Google Scholar]
- Du Q, Stukenberg PT, Macara IG. A mammalian Partner of inscuteable binds NuMA and regulates mitotic spindle organization. Nat Cell Biol. 2001;3:1069–1075. doi: 10.1038/ncb1201-1069. [DOI] [PubMed] [Google Scholar]
- Ehrlich JS, Hansen MD, Nelson WJ. Spatio-temporal regulation of Rac1 localization and lamellipodia dynamics during epithelial cell-cell adhesion. Dev Cell. 2002;3:259–270. doi: 10.1016/s1534-5807(02)00216-2. [DOI] [PMC free article] [PubMed] [Google Scholar]
- Florey O, Krajcovic M, Sun Q, Overholtzer M. Entosis. Curr Biol. 2010;20:R88–r89. doi: 10.1016/j.cub.2009.11.020. [DOI] [PubMed] [Google Scholar]
- Green KJ, Getsios S, Troyanovsky S, Godsel LM. Intercellular junction assembly, dynamics, and homeostasis. Cold Spring Harb Perspect Biol. 2010;2:a000125. doi: 10.1101/cshperspect.a000125. [DOI] [PMC free article] [PubMed] [Google Scholar]
- Hansen MD, Ehrlich JS, Nelson WJ. Molecular mechanism for orienting membrane and actin dynamics to nascent cell-cell contacts in epithelial cells. J Biol Chem. 2002;277:45371–45376. doi: 10.1074/jbc.M207747200. [DOI] [PMC free article] [PubMed] [Google Scholar]
- Hao Y, Du Q, Chen X, Zheng Z, Balsbaugh JL, Maitra S, Shabanowitz J, Hunt DF, Macara IG. Par3 controls epithelial spindle orientation by aPKC-mediated phosphorylation of apical Pins. Curr Biol. 2010;20:1809–1818. doi: 10.1016/j.cub.2010.09.032. [DOI] [PMC free article] [PubMed] [Google Scholar]
- Hurd TW, Gao L, Roh MH, Macara IG, Margolis B. Direct interaction of two polarity complexes implicated in epithelial tight junction assembly. Nat Cell Biol. 2003;5:137–142. doi: 10.1038/ncb923. [DOI] [PubMed] [Google Scholar]
- Ishiuchi T, Takeichi M. Willin and Par3 cooperatively regulate epithelial apical constriction through aPKC-mediated ROCK phosphorylation. Nat Cell Biol. 2011;13:860–866. doi: 10.1038/ncb2274. [DOI] [PubMed] [Google Scholar]
- Ivanov AI, Hunt D, Utech M, Nusrat A, Parkos CA. Differential roles for actin polymerization and a myosin II motor in assembly of the epithelial apical junctional complex. Mol Biol Cell. 2005;16:2636–2650. doi: 10.1091/mbc.E05-01-0043. [DOI] [PMC free article] [PubMed] [Google Scholar]
- Ivanov AI, McCall IC, Parkos CA, Nusrat A. Role for actin filament turnover and a myosin II motor in cytoskeleton-driven disassembly of the epithelial apical junctional complex. Mol Biol Cell. 2004;15:2639–2651. doi: 10.1091/mbc.E04-02-0163. [DOI] [PMC free article] [PubMed] [Google Scholar]
- Izumi Y, Hirose T, Tamai Y, Hirai S, Nagashima Y, Fujimoto T, Tabuse Y, Kemphues KJ, Ohno S. An atypical PKC directly associates and colocalizes at the epithelial tight junction with ASIP, a mammalian homologue of Caenorhabditis elegans polarity protein PAR-3. J Cell Biol. 1998;143:95–106. doi: 10.1083/jcb.143.1.95. [DOI] [PMC free article] [PubMed] [Google Scholar]
- Joberty G, Petersen C, Gao L, Macara IG. The cell-polarity protein Par6 links Par3 and atypical protein kinase C to Cdc42. Nat Cell Biol. 2000;2:531–539. doi: 10.1038/35019573. [DOI] [PubMed] [Google Scholar]
- Kishikawa M, Suzuki A, Ohno S. aPKC enables development of zonula adherens by antagonizing centripetal contraction of the circumferential actomyosin cables. J Cell Sci. 2008;121:2481–2492. doi: 10.1242/jcs.024109. [DOI] [PubMed] [Google Scholar]
- Kovacs EM, Goodwin M, Ali RG, Paterson AD, Yap AS. Cadherin-directed actin assembly: E-cadherin physically associates with the Arp2/3 complex to direct actin assembly in nascent adhesive contacts. Curr Biol. 2002;12:379–382. doi: 10.1016/s0960-9822(02)00661-9. [DOI] [PubMed] [Google Scholar]
- Krahn MP, Klopfenstein DR, Fischer N, Wodarz A. Membrane targeting of Bazooka/PAR-3 is mediated by direct binding to phosphoinositide lipids. Curr Biol. 2010;20:636–642. doi: 10.1016/j.cub.2010.01.065. [DOI] [PubMed] [Google Scholar]
- Krajcovic M,, et al. A non-genetic route to aneuploidy in human cancers. Nat Cell Biol. 2011;13:324–330. doi: 10.1038/ncb2174. [DOI] [PMC free article] [PubMed] [Google Scholar]
- Krendel M, Gloushankova NA, Bonder EM, Feder HH, Vasiliev JM, Gelfand IM. Myosin-dependent contractile activity of the actin cytoskeleton modulates the spatial organization of cell-cell contacts in cultured epitheliocytes. Proc Natl Acad Sci USA. 1999;96:9666–9670. doi: 10.1073/pnas.96.17.9666. [DOI] [PMC free article] [PubMed] [Google Scholar]
- Krendel MF, Bonder EM. Analysis of actin filament bundle dynamics during contact formation in live epithelial cells. Cell Motil Cytoskeleton. 1999;43:296–309. doi: 10.1002/(SICI)1097-0169(1999)43:4<296::AID-CM3>3.0.CO;2-U. [DOI] [PubMed] [Google Scholar]
- Lin D, Edwards AS, Fawcett JP, Mbamalu G, Scott JD, Pawson T. A mammalian PAR-3-PAR-6 complex implicated in Cdc42/Rac1 and aPKC signalling and cell polarity. Nat Cell Biol. 2000;2:540–547. doi: 10.1038/35019582. [DOI] [PubMed] [Google Scholar]
- Macara IG. Parsing the polarity code. Nat Rev Mol Cell Biol. 2004;5:220–231. doi: 10.1038/nrm1332. [DOI] [PubMed] [Google Scholar]
- Martin-Belmonte F, Mostov K. Regulation of cell polarity during epithelial morphogenesis. Curr Opin Cell Biol. 2008;20:227–234. doi: 10.1016/j.ceb.2008.01.001. [DOI] [PubMed] [Google Scholar]
- Musch A, Cohen D, Yeaman C, Nelson WJ, Rodriguez-Boulan E, Brennwald PJ. Mammalian homolog of Drosophila tumor suppressor lethal (2) giant larvae interacts with basolateral exocytic machinery in Madin-Darby canine kidney cells. Mol Biol Cell. 2002;13:158–168. doi: 10.1091/mbc.01-10-0496. [DOI] [PMC free article] [PubMed] [Google Scholar]
- Nakagawa M, Fukata M, Yamaga M, Itoh N, Kaibuchi K. Recruitment and activation of Rac1 by the formation of E-cadherin-mediated cell-cell adhesion sites. J Cell Sci. 2001;114:1829–1838. doi: 10.1242/jcs.114.10.1829. [DOI] [PubMed] [Google Scholar]
- Overholtzer M, Brugge JS. The cell biology of cell-in-cell structures. Nat Rev Mol Cell Biol. 2008;9:796–809. doi: 10.1038/nrm2504. [DOI] [PubMed] [Google Scholar]
- Overholtzer M, Mailleux AA, Mouneimne G, Normand G, Schnitt SJ, King RW, Cibas ES, Brugge JS. A nonapoptotic cell death process, entosis, that occurs by cell-in-cell invasion. Cell. 2007;131:966–979. doi: 10.1016/j.cell.2007.10.040. [DOI] [PubMed] [Google Scholar]
- Plant PJ, Fawcett JP, Lin DC, Holdorf AD, Binns K, Kulkarni S, Pawson T. A polarity complex of mPar-6 and atypical PKC binds, phosphorylates and regulates mammalian Lgl. Nat Cell Biol. 2003;5:301–308. doi: 10.1038/ncb948. [DOI] [PubMed] [Google Scholar]
- Shewan AM, Maddugoda M, Kraemer A, Stehbens SJ, Verma S, Kovacs EM, Yap AS. Myosin 2 is a key Rho kinase target necessary for the local concentration of E-cadherin at cell-cell contacts. Mol Biol Cell. 2005;16:4531–4542. doi: 10.1091/mbc.E05-04-0330. [DOI] [PMC free article] [PubMed] [Google Scholar]
- Strand D, Jakobs R, Merdes G, Neumann B, Kalmes A, Heid HW, Husmann I, Mechler BM. The Drosophila lethal(2)giant larvae tumor suppressor protein forms homo-oligomers and is associated with nonmuscle myosin II heavy chain. J Cell Biol. 1994;127:1361–1373. doi: 10.1083/jcb.127.5.1361. [DOI] [PMC free article] [PubMed] [Google Scholar]
- Vaezi A, Bauer C, Vasioukhin V, Fuchs E. Actin cable dynamics and Rho/Rock orchestrate a polarized cytoskeletal architecture in the early steps of assembling a stratified epithelium. Dev Cell. 2002;3:367–381. doi: 10.1016/s1534-5807(02)00259-9. [DOI] [PubMed] [Google Scholar]
- Vasioukhin V. Lethal giant puzzle of Lgl. Dev Neurosci. 2006;28:13–24. doi: 10.1159/000090749. [DOI] [PubMed] [Google Scholar]
- Vasioukhin V, Bauer C, Yin M, Fuchs E. Directed actin polymerization is the driving force for epithelial cell-cell adhesion. Cell. 2000;100:209–219. doi: 10.1016/s0092-8674(00)81559-7. [DOI] [PubMed] [Google Scholar]
- Vicente-Manzanares M, Ma X, Adelstein RS, Horwitz AR. Non-muscle myosin II takes centre stage in cell adhesion and migration. Nat Rev Mol Cell Biol. 2009;10:778–790. doi: 10.1038/nrm2786. [DOI] [PMC free article] [PubMed] [Google Scholar]
- Wildenberg GA, Dohn MR, Carnahan RH, Davis MA, Lobdell NA, Settleman J, Reynolds AB. p120-catenin and p190RhoGAP regulate cell-cell adhesion by coordinating antagonism between Rac and Rho. Cell. 2006;127:1027–1039. doi: 10.1016/j.cell.2006.09.046. [DOI] [PubMed] [Google Scholar]
- Yamada S, Nelson WJ. Localized zones of Rho and Rac activities drive initiation and expansion of epithelial cell-cell adhesion. J Cell Biol. 2007;178:517–527. doi: 10.1083/jcb.200701058. [DOI] [PMC free article] [PubMed] [Google Scholar]
- Yamanaka T, Horikoshi Y, Izumi N, Suzuki A, Mizuno K, Ohno S. Lgl mediates apical domain disassembly by suppressing the PAR-3-aPKC-PAR-6 complex to orient apical membrane polarity. J Cell Sci. 2006;119:2107–2118. doi: 10.1242/jcs.02938. [DOI] [PubMed] [Google Scholar]
- Yamanaka T, Horikoshi Y, Sugiyama Y, Ishiyama C, Suzuki A, Hirose T, Iwamatsu A, Shinohara A, Ohno S. Mammalian Lgl forms a protein complex with PAR-6 and aPKC independently of PAR-3 to regulate epithelial cell polarity. Curr Biol. 2003;13:734–743. doi: 10.1016/s0960-9822(03)00244-6. [DOI] [PubMed] [Google Scholar]
- Zhang H, Macara IG. The PAR-6 polarity protein regulates dendritic spine morphogenesis through p190 RhoGAP and the Rho GTPase. Dev Cell. 2008;14:216–226. doi: 10.1016/j.devcel.2007.11.020. [DOI] [PMC free article] [PubMed] [Google Scholar]
- Zhang J, Betson M, Erasmus J, Zeikos K, Bailly M, Cramer LP, Braga VM. Actin at cell-cell junctions is composed of two dynamic and functional populations. J Cell Sci. 2005;118:5549–5562. doi: 10.1242/jcs.02639. [DOI] [PubMed] [Google Scholar]
- Zheng Z, Zhu H, Wan Q, Liu J, Xiao Z, Siderovski DP, Du Q. LGN regulates mitotic spindle orientation during epithelial morphogenesis. J Cell Biol. 2010;189:275–288. doi: 10.1083/jcb.200910021. [DOI] [PMC free article] [PubMed] [Google Scholar]
Associated Data
This section collects any data citations, data availability statements, or supplementary materials included in this article.