Abstract
A novel evodiamine (EVO)-phospholipid complex (EPLC) was designed to improve the bioavailability of EVO. A central composite design approach was employed for process optimization. EPLC were characterized by differential scanning calorimetry, ultraviolet spectroscopy, Fourier transformed infrared spectroscopy, 1H-NMR spectroscopy, matrix-assisted laser desorption/ionization time-of-flight spectroscopy, apparent solubility, and dissolution rate. After oral administration of EPLC, the concentrations of EVO at different time points were determined by high-performance liquid chromatography. The optimal formulation for EPLC was obtained where the values of X1, X2, and X3 were 2, 0.5, and 2.5 mg/mL, respectively. The average particle size and zeta potential of EPLC with the optimized formulation were 246.1 nm and −26.94 mV, respectively. The EVO and phospholipids in the EPLC were associated with non-covalent interactions. The solubility of EPLC in water and the dissolution rate of EPLC in phosphate-buffered solution (pH 6.8) were substantially enhanced. The plasma EVO concentration-time curves of EPLC and free EVO were both in accordance with the two-compartment model. The peak concentration and AUC0−∞ of EPLC were increased, and the relative bioavailability was significantly increased to 218.82 % compared with that of EVO.
KEY WORDS: bioavailability, evodiamine, phospholipid complex, process optimization
INTRODUCTION
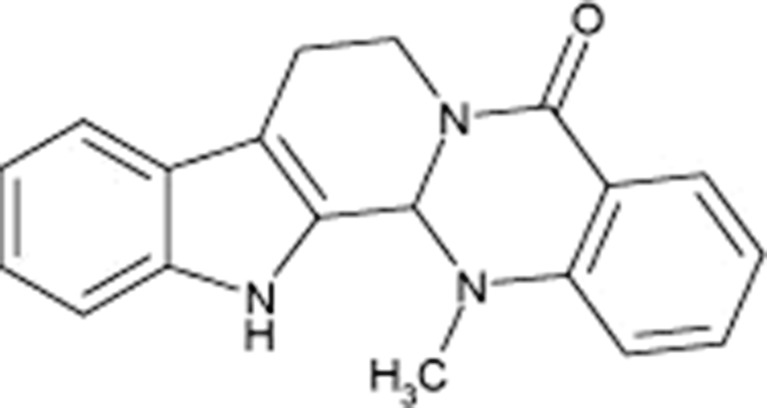
Evodiamine (EVO; C19H17N3O; MW 303.36; Fig. 1), a quinoline alkaloid, is extracted from the fruit of a Chinese herb (Evodia rutaecarpa, or colloquially, “Wu-Chu-Yu” in Chinese). It has been shown to possess a multitude of pharmacological activities, such as antitumor, anti-inflammatory, antinociceptive, anti-obesity, and thermoregulatory effects. In particular, it has drawn much attention due to its cytotoxicity or inhibitory activity on cancer cells, including those of lung, colon, prostate, breast, melanoma, T cell leukemia, and cervix. Studies demonstrate that EVO has antitumor potential in a wide variety of tumor cells by inhibiting proliferation, inducing apoptosis and reducing invasion and metastasis (1). More importantly, EVO shows little toxicity against normal human peripheral blood cells (2).
Fig. 1.
The chemical structure of EVO
Despite the promising biological effects of EVO, clinical translation of these results has been hampered by extremely poor oral bioavailability, as reported by Shyr et al. (3). The low bioavailability might be due to extensive first-pass metabolism (3,4), low solubility, and low dissolution rate.
The complex of a natural active ingredient and phospholipids, phytosome, was first investigated for cosmetic applications before proving itself as a potential drug-delivery system. Phytosome technology has been considered to be a major advancement in clinical research for active phyto-constituents with poor bioavailability (5–7). Indeed, the solubility and bioavailability of several therapeutic candidates may be greatly enhanced by phytosome technology (8). In addition, phytosome (e.g., vegetal complex of curcumin and capsaicin) may induce alterations in target cell membrane structure and thereby exert potent pharmacological effects (9).
In the experiments outlined below, the phytosome technology was employed to develop an alternative drug-delivery system for EVO, so as to address the poor oral bioavailability without compromising safety. The objectives of this study were as follows: (1) EVO-phospholipid complex (EPLC) was prepared by solvent evaporation method. To properly formulate EPLC, a circumscribed central composite design approach was used for optimization of process variables on the complexation rate of EPLC. (2) The physicochemical properties of EPLC were investigated by differential scanning calorimetry (DSC), ultraviolet (UV), Fourier transformed infrared (FT-IR), 1H-NMR, and matrix-assisted laser desorption/ionization time-of-flight (MALDI-TOF) spectroscopy. The apparent solubility of EPLC was also investigated in order to evaluate the increased solubility properties of EPLC in comparison to that of free EVO material and the physical mixture. (3) The pharmacokinetics and bioavailability of EPLC were investigated.
MATERIALS AND METHODS
Materials
EVO was purchased from Yuancheng Technology Development Co., Ltd. (Wuhan, China), purity 99.13 %, and phospholipid was purchased from Sinopharm Chemical Reagent Co., Ltd. (Shanghai, China); the phosphatide content was approximately 60 % (w/w). Honokiol was purchased from Xiaocao Botanical Development Co., Ltd. (Xi’an, China), purity of 99.60 %. 2-cyano-4-hydroxycinnamic acid (CHCA) was purchased from Sigma-Aldrich. Inc. (St Louis, MO, USA). All other chemical reagents were of analytical grade or better.
Preparation of EPLC
EPLC was prepared by solvent evaporation method (10). Weighed phospholipids and EVO (at molar ratios of 0.5, 1.03, 1.75, 2.47, and 3, respectively) were placed in a 100-mL round-bottom flask, and then 50 mL of mixed solvents of ethanol and tetrahydrofuran (with volume fraction of ethanol at 0, 0.21, 0.50, 0.79, and 1.00, respectively) were added to form the mixture containing 1–5 mg/mL of EVO. The reaction proceeded under magnetic stirring (Type 85-2, Sile apparatus Co., Ltd., Shanghai, China) at 60 °C for 3 h. Next, the reaction medium was evaporated off with hypobaric drying method and the residue was further dried under vacuum at 40 °C for 12 h. After placing the raw product in a desiccation chamber for another 12 h, the dried residue was crushed in a mortar and sieved with a 100 mesh filter. The resultant EPLC was transferred into an amber bottle, flushed with nitrogen and stored in a desiccation chamber at ambient temperature.
The Complexation Rate of EPLC
A certain amount of EPLC (equal to 125 mg of EVO), prepared as described above, was dispersed in 5 mL of chloroform. Both EPLC and phospholipids were easily dissolved in chloroform (11), but free EVO material remained practically insoluble in chloroform. The non-complexed EVO was separated, dissolved in absolute ethyl alcohol and assayed using a UV-Spectrophotometer (UV-5130, Shimadzu, Kyoto, Japan) at 225 nm. In detail, the free EVO concentration was calculated from standard curves. The standard regression equation in the range of C = 1.05~4.20 μg/mL was linear (A = 0.1776 C + 0.006, r = 0.9997; A means the absence of EVO). The recoveries of EVO are (99.71 ± 0.26) % (n = 9), which showed that the above method was reliable for determination under the described conditions. The complexation rate of EPLC was determined by the following formula:
 |
where “m1” is the total content of EVO added, “m2” is the content of EVO “present as a complex,” and “m3” is the free EVO or non-complexed EVO.
Determination of the Content of EVO in EPLC
The content of EVO in phospholipid complex was determined as follows (12). Briefly, approximately 10.5 mg of EPLC was dissolved in 100 mL of mobile phase (methanol/water = 75:25, v/v) and 10-μL aliquot of the resulting solution was injected into a high-performance liquid chromatography (HPLC) system. The stationary phase (Lichrospher C18 column, 250 × 4.6 mm, 5 μm) was kept at 35 °C, and the mobile phase was run at the flow rate of 1 mL/min. Effluent was monitored at 225 nm.
Central Composite Design
Based on the preliminary experiment, factors (independent variables) which have relatively great influence on the complexation rate (dependent variable) were chosen. These included: phospholipid-to-drug ratio (X1, mol/mol), volume fraction of ethanol in the reaction medium (X2, v/v), and concentration of EVO (X3, mg/mL). An optimization procedure, namely circumscribed central composite design, was performed. Briefly, these three factors with five levels each were evaluated and experimental trials were performed at all 20 possible combinations (13,14). Complexation rates were taken as the response variable. The data were fitted to a linear model (including linear effects, Eq. 1 and a quadratic model (including linear and quadratic main effects plus two-way interactions, Eq. 2 by SPSS program (Version 17.0, SPSS Inc., Chicago, USA). The models were expressed as follows, respectively:
 |
1 |
 |
2 |
where Y was the dependent variable (complexation rate), a0 and b0 were the intercepts representing the arithmetic mean response of the 20 runs, and ai, bi were the estimated coefficients for the factor Xi. The main effects (X1, X2, and X3) represented the average result of changing one factor at a time from its minimal to maximal value. The interaction terms (X1X2, X2X3, and X1X3) showed how the response changes when two factors were simultaneously changed. The polynomial terms (X21, X22, and X23) were included to investigate non-linearity. The level values of three independent variables and the composition of the central composite design batches were presented in Tables I and II.
Table I.
Coded Levels and “Real” Values for Each Factor Under Study
| Factors | Levels | ||||
|---|---|---|---|---|---|
| −1.732 | −1 | 0 | 1 | 1.732 | |
| X 1 (mol/mol) | 0.50 | 1.03 | 1.75 | 2.47 | 3.00 |
| X 2 (v/v) | 0.00 | 0.21 | 0.50 | 0.79 | 1.00 |
| X 3 (mg/mL) | 1.00 | 1.85 | 3.00 | 4.15 | 5.00 |
Table II.
Composition of Central Composite Design Batches (Mean±SD, n = 3)
| Batches | X 1 | X 2 | X 3 | Complexation rate (%) |
|---|---|---|---|---|
| 1 | 1.03 | 0.21 | 1.85 | 88.71 ± 1.68 |
| 2 | 2.47 | 0.21 | 1.85 | 95.43 ± 1.69 |
| 3 | 1.03 | 0.79 | 1.85 | 86.45 ± 0.33 |
| 4 | 2.47 | 0.79 | 1.85 | 94.26 ± 2.01 |
| 5 | 1.03 | 0.21 | 4.15 | 95.28 ± 1.18 |
| 6 | 2.47 | 0.21 | 4.15 | 95.20 ± 0.30 |
| 7 | 1.03 | 0.79 | 4.15 | 71.52 ± 0.06 |
| 8 | 2.47 | 0.79 | 4.15 | 75.56 ± 0.08 |
| 9 | 0.50 | 0.50 | 3.00 | 87.21 ± 0.29 |
| 10 | 3.00 | 0.50 | 3.00 | 91.80 ± 0.77 |
| 11 | 1.75 | 0 | 3.00 | 94.75 ± 0.09 |
| 12 | 1.75 | 1.00 | 3.00 | 72.41 ± 0.40 |
| 13 | 1.75 | 0.50 | 1.00 | 96.07 ± 0.18 |
| 14 | 1.75 | 0.50 | 5.00 | 85.14 ± 0.11 |
| 15–20 | 1.75 | 0.50 | 3.00 | 93.41 ± 0.22 |
Characterization of EPLC
Differential Scanning Calorimetry
The samples, sealed in the aluminum crimp cells, were heated at the speed of 5 °C/min from 0 to 300 °C under a nitrogen atmosphere. The phase transition onset temperatures of phospholipids, pure EVO, EPLC, and the physical mixture were determined and compared with the help of a differential scanning calorimeter (Netzsch STA-449 C, Selb, Germany).
The UV Spectroscopy
The tested samples (phospholipid, EVO, EPLC, and physical mixture) were dissolved in ethanol and then scanned with a UV spectrometer (UV-5130, Shimadzu, Kyoto, Japan) over the wavelength range of 200–600 nm.
The FT-IR Spectroscopy
The tested samples (phospholipid, EVO, EPLC, and physical mixture) were taken in KBr pellets using a FT-IR spectrophotometer instrument (Spectrum One NTS, PerkinElmer Inc., Massachusetts, USA).
The 1H-NMR Spectroscopy
The tested samples (phospholipid, EVO, EPLC, and physical mixture) were dissolved in D-substituted solvent and then analyzed with a 1H-NMR spectrometer (Brucker Advance DRX-500, Brucker BioSciences Corporation, Billerica, MA, USA) at 500 MHz.
The MALDI-TOF Spectroscopy
The MALDI-TOF spectroscopy of the tested samples (phospholipid, EVO, EPLC, and physical mixture) was carried out by using a MALDI-TOF mass spectrometry (Voyager DE Pro, Applied biosystems company, Carlsbad, CA, USA). CHCA (MW, 189.17) was used as internal standard. The angiotensin linear 3.1 bic model was chosen.
Scanning Electron Microscopy
The EPLC powders were dispersed in a pH 7.4 phosphate-buffered solution and a drop of suspension was placed on a slide slip before it was fixed, dehydrated, and freeze-dried. And then, the sediments were coated with platinum in a sputter coater (E-1010, Hitachi, Japan), and their surface morphology was viewed and photographed with a Hitachi scanning electron microscope (3,000 N, Hitachi, Japan).
Particle Size and Zeta Potential
The particle size and zeta potential of EPLC were determined at 25 °C using photon correlation spectroscopy (Zeta-Sizer Nano-ZS90, Malvern, UK); 100 mg of EPLC powders were dispersed in about 15 mL of double-distilled water before analysis.
Apparent Solubility Studies
Apparent solubility was determined by adding excess EVO and EPLC to 6 mL of water or n-octanol in sealed glass containers at 25 °C. Each experiment was performed in triplicate. The liquids were agitated for 24 h, and then centrifuged to remove excess EVO at 4,000 rpm for 10 min. The supernatant was filtrated through a 0.45-μm membrane. Then 1 ml filtrate was mixed with 9 mL of mobile phase (methanol/water = 75: 25, v/v) and a 10 μL aliquot of the resulting solution was injected into a HPLC system and detected at 225 nm to measure the concentration of EVO (15,16).
Dissolution Studies
The dissolution studies were carried out according to dissolution test apparatus specifications of China pharmacopoeia (2010 edition, paddle method). The dissolution flasks were immersed in a water bath at 37 °C; 900 mL of dissolution medium (pH 6.8 phosphate-buffered saline) was continuously stirred at 100 rpm. The complex and the physical mixture of phospholipids and EVO equivalent to 5.5 mg of EVO were added on the surface of the stirred dissolution medium at the beginning of the study. At different time intervals, 5 mL of samples were withdrawn and filtrated using 0.12 μm cellulose nitrate membranes. Five milliliters of fresh medium were supplemented into the corresponding flasks. Then 1 mL of filtrate was mixed with 9 mL of mobile phase (methanol/water = 75: 25, v/v) and 10-μL aliquot of the resulting solution was injected into a HPLC column for analysis as described above.
In vivo Pharmacokinetics Study of EPLC
Chromatography
The plasma concentrations of EVO were determined by a HPLC system. The stationary phase (Lichrospher C18 column, 250 × 4.6 mm, 5 μm) was kept at 35 °C, and the mobile phase (methanol/water = 75: 25, v/v) was run at a flow rate of 1 mL/min. Honokiol was chosen as an internal standard (3). Effluent was monitored at 225 nm. The peaks of EVO and honokiol were detected at about 5.7 and 8.2 min, respectively.
Plasma Sample Preparation
Under ether anesthesia, 500 μL of ophthalmic vein blood samples were collected from both groups of rats into centrifuge tubes at 0.083, 0.167, 0.333, 0.667, 1, 2, 4, 6, 8, 10, 12, and 24 h after dosing. Each blood sample was centrifuged at 3,000×g for 10 min. One hundred fifty microliters of plasma sample was taken from the upper layer, and then 10 μL of internal standard solution (Honokiol, 20 μg/mL) and 75 μL of ammonia solution were added to the resulting plasma and agitated for 30 s. After 750 μL of ethyl ether was added to the solution above, this mixture was shaken for 3 min and then centrifuged at 4,000×g for 10 min. Five hundred microliters of the organic layer was drawn into the respective centrifuge tube and evaporated under nitrogen at 40 °C. The residue was reconstituted with 100 μL of methanol and centrifuged at 12,000×g for 10 min. Forty microliters of the supernatant was retained for HPLC analysis (17). The same sample handling process was used for the determination of linearity, precision, and accuracy. Various quantities of EVO were added to the blank rat plasma, and the resulting concentrations of EVO were 0.01, 0.05, 0.075, 0.1, 0.5, 1.5, and 2.0 μg/mL, respectively. These calibrations were subjected to the entire analytical procedure, so as to test the linearity, precision, and accuracy of the method.
Pharmacokinetic Study of EPLC in Rats
Male Sprague–Dawley rats (270 ± 20 g) were obtained from the Laboratory Animal Center of Chongqing Medical University. All experiments were approved by the Institutional Animal Care and Use Committee of Chongqing Medical University.
Twelve male rats were fasted for 12 h but allowed to take water freely prior to the experiment. These rats were divided randomly into two groups, one group for administration of EVO (suspended in 2.5 ml of 0.5 % CMC solution) at a dose of 500 mg/kg and the other group for administration of the complex at a dose equivalent to 500 mg/kg of EVO (3,18). Peak concentration and peak time were derived directly from the concentration-time curve. The other pharmacokinetic parameters were computed using the standard software program DAS 2.1.1 (Mathematical pharmacology professional committee of China, Shanghai, China).
Statistical Analysis
All data were expressed as mean±standard deviation. An F test for analysis of variance (ANOVA) was performed for validation of the fitting model.
RESULTS AND DISCUSSIONS
Preparation of EPLC
As depicted in Table II, complexation rate (in percent) for the 20 batches varied considerably from 71.52 to 96.07 %. Quadratic model fitting (Eq. 4) of the experimental data is apparently superior to the linear model (Eq. 3) with respect to the correlation coefficient (R2). Accordingly, the quadratic model (Eq. 4) was chosen as the optimal fitting model and was further validated with an F test for ANOVA analysis to evaluate the significance of the regression. The data from Table III indicate that the model is statistically significant (Fcalculation > Fcritical; p < 0.001) and explains 95 % of the observed variance (R2 = 0.994).
 |
3 |
 |
4 |
Table III.
ANOVA of the Quadratic Model
| Source | Sum of squares | Degrees of freedom | Mean square | F critical | p value |
|---|---|---|---|---|---|
| Regression | 1,027.932 | 9 | 114.215 | 93.397 | <0.001 |
| Residual | 6.114 | 5 | 1.223 | ||
| Total | 1,034.046 | 14 |
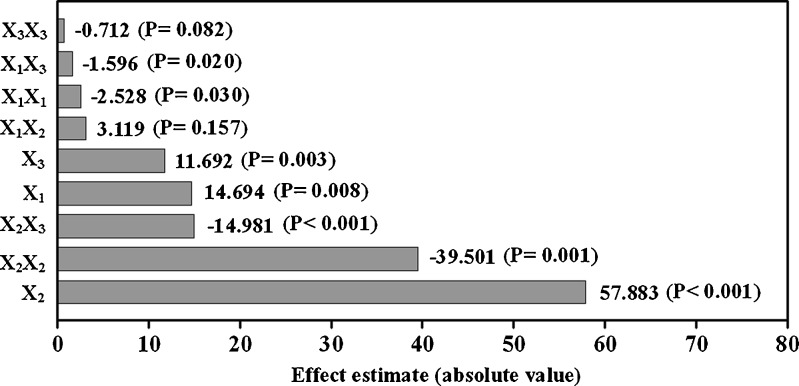
The results presented in Fig. 2 indicate that all linear main effects (X1, X2, and X3) were statistically significant (p values were all below 0.01). These linear effects had positive effects on the response variable, meaning that complexation rate increases as these variables increase. The quadratic effects (X21 and X22) and the interaction terms (X1X3 and X2X3) were also statistically significant (p values are equal to 0.03, 0.001, 0.02, and <0.001, respectively) but had negative effects on the response variable. The opposite signaling between linear and quadratic effects suggested that the two variables (X1 and X2) were approaching maximum values. Moreover, the effects of the interactions between variables (e.g., X1X3 or X2X3) were contrary to that of individual effects, suggesting a complex relationship between variables and response (13). The influence of main variables on complexation rate decreased in the order of X2, X22, X2X3, X1, and X3.
Fig. 2.
Pareto diagrams for effect estimation. The effects presenting probability values higher than 0.05 are not considered as statistically significant
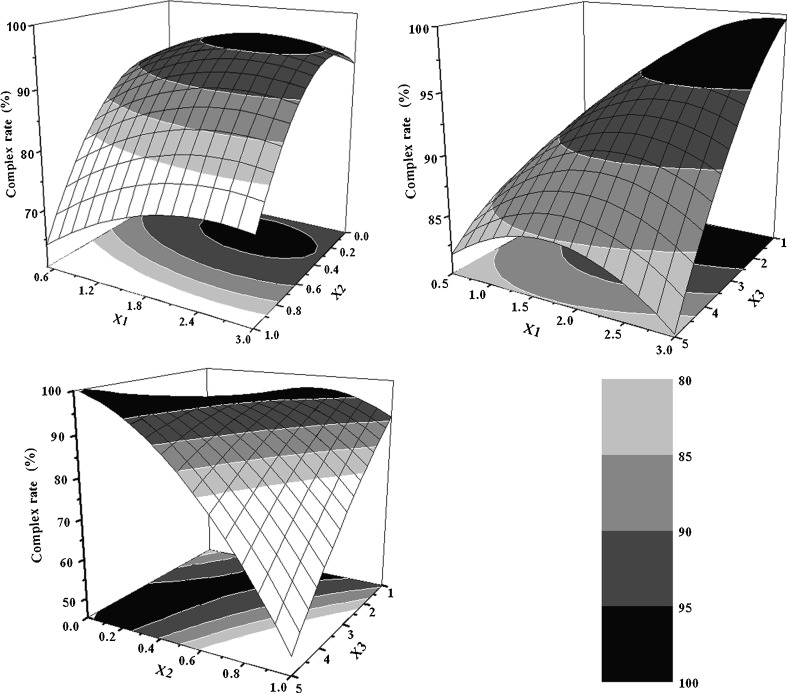
The relationship between variables and response could be easily visualized by means of response surface methodology (13,19,20). Based on the mathematical model of Eq. 4, predicted response surfaces and contour plots were generated using Origin software (Version 7.5, Origin Lab Corp., Wellesley, USA). As depicted in Fig. 3, high level of X1 and low levels of X2 and X3 were found to be favorable conditions for obtaining high complexation rate (in percent). Particularly, X2 was found to exhibit significant influence on complexation rate (in percent). Both non-polar solvent and polar solvent can be used to prepare phytosome (vegetal phospholipid complex) (10,16,19,21–24). On one hand, our preliminary study showed that the complexation rate of EPLC prepared by non-polar solvent (e.g., tetrahydrofuran) was usually much higher than that prepared by polar solvent (e.g., ethanol) when the same amount of EVO was added. On the other hand, polar solvent, was more cost-effective (the price of ethanol is about one quarter that of tetrahydrofuran). Considering the above information, the mixed polar and non-polar solvents (ethanol and tetrahydrofuran) at suitable volume ratio were chosen as a reaction solvent in our experiment in order to obtain a relatively high complexation rate of phospholipid complex at low cost, which would be favorable towards future mass-production or industrialization.
Fig. 3.
The response surface and contour plots based on complexation rate (Y %) as a function of the factors studied: phospholipid-to-drug ratio (X 1, mol/mol), volume fraction of ethanol in the reaction medium (X 2, v/v), and reaction concentration of EVO (X 3, mg/mL)
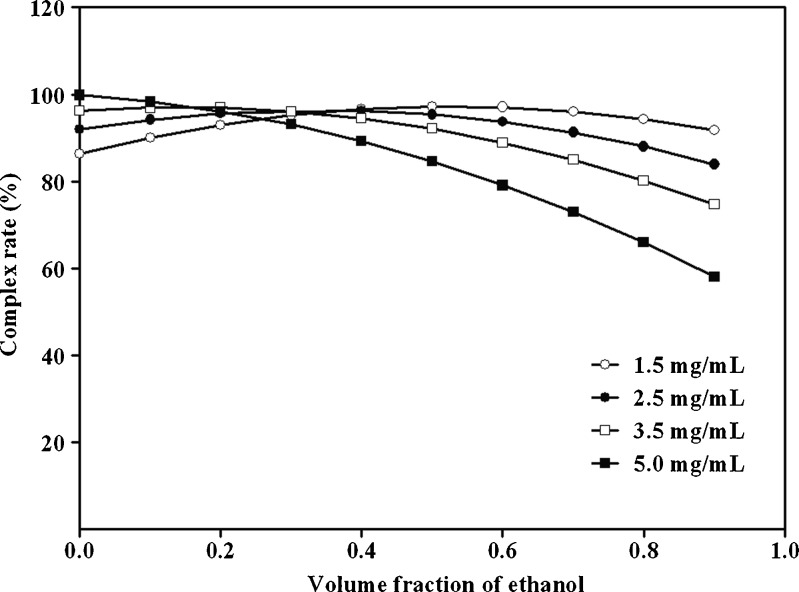
Figure 4 showed the effects of polarity of mixed solvents and the concentration of EVO on complexation rate when phospholipid-to-drug ratio was fixed at 2. When the concentration of EVO was fixed at 5.0 mg/mL, complexation rates of EPLC decreased dramatically from 99.80 to 58.10 % while the volume fraction of ethanol varied from 0 to 1. Similarly, in the case of the concentration of EVO fixed at 3.5 mg/mL, complexation rate decreased slowly from 96.90 to 74.65 % with the incremental change of the volume fraction of ethanol. Moreover, when the concentration of EVO was fixed at 1.5 and 2.5 mg/mL, both of the complexation rate-volume fraction of ethanol curves were parabola. Briefly, the complexation rate reached its highest point (97.21 %) when the concentration of EVO and the volume fraction of ethanol were 1.5 mg/mL and 0.5, respectively. The complexation rate (95.36 %) was very close to the maximal rate and so acceptable when the concentration of EVO and the volume fraction of ethanol were 2.5 mg/mL and 0.5, respectively. Taken together with these previous findings, our results suggested that to develop a cost-effective EPLC with high complexation rate, optimal values for phospholipid-to-drug ratio (X1, mol/mol), volume fraction of ethanol in the reaction medium (X2, v/v) and reaction concentration of EVO (X3, mg/mL) should be 2, 0.5, and 2.5 mg/mL, respectively.
Fig. 4.
Influence of the volume fraction of ethanol in the reaction medium (X 2, expressed as actual value for simplification, ranged from 0 to 1.0) and the concentration of EVO (X 3, fixed at 1.5 (empty circles), 2.5 (filled circles), 3.5 (empty squares), and 5.0 (empty squares) mg/mL, respectively) on complexation rate when phospholipids-to-drug ratio (X 1) is fixed at 2. Complexation rate is calculated based on the quadratic model equation (Equation 4)
Validation of Model Optimization
In order to evaluate the optimization capability of the generated models according to the results of the circumscribed central composite design, EPLC was prepared under the above described protocol (X1, X2, and X3 were set to 2, 0.5, and 2.5 mg/mL, respectively). The complexation rates obtained with the predicted model were shown in Table IV, which was in good agreement with theoretical predictions. The average complexation rate and the content of EVO in EPLC prepared under the optimized conditions were found to be 95.1 ± 0.50 and 24.27 ± 0.97 % (n = 3), respectively.
Table IV.
Observed and Predicted Values of Complexation Rates of EPLC Prepared Under the Optimal Protocol (Mean±SD, n = 3)
| Batches | Predicted values (%) | Observed values (%) | Biasa (%) |
|---|---|---|---|
| 1 | 95.36 | 95.69 ± 0.06 | 0.34 |
| 2 | 95.36 | 93.10 ± 0.11 | 2.37 |
| 3 | 95.36 | 96.51 ± 0.24 | −1.21 |
aBias was calculated according to this equation: bias (%) = (predicted value-observed value)/predicted value × 100 %
Differential Scanning Calorimetry
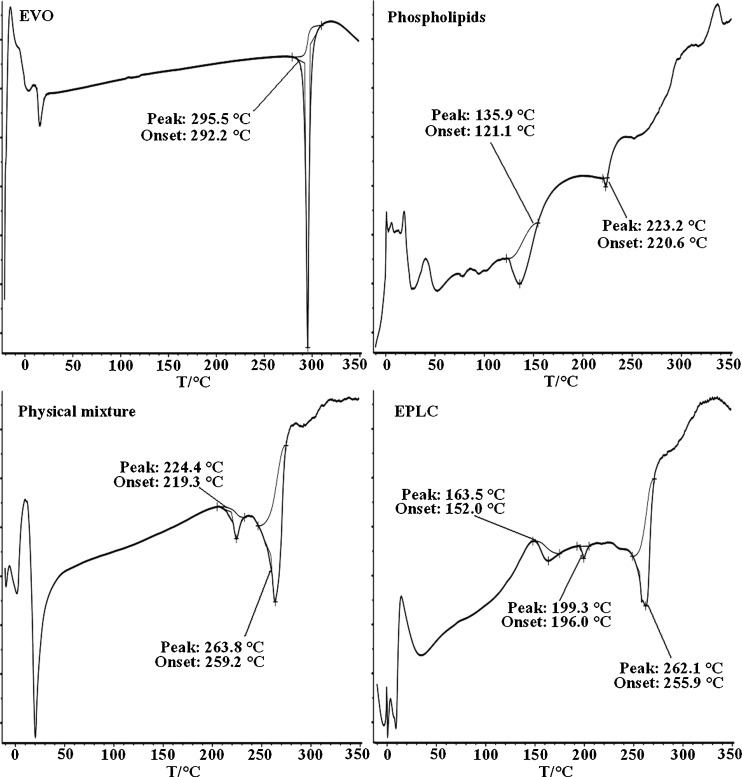
DSC, a fast and reliable method to investigate drug-excipient compatibility, might provide some information about the possible interaction of EVO with phospholipids. Interaction between EVO and phospholipids may be ascertained by the elimination of an endothermic peak, the appearance of new peak, change in peak shape, onset temperature, peak temperature (melting point), relative peak area, or enthalpy (25,26). Figure 5 showed the DSC thermograms of EVO, phospholipids, EPLC, and physical mixture of EVO and phospholipids.
Fig. 5.
DSC thermograms of EVO, phospholipids, EPLC, and physical mixture of EVO and phospholipids
The thermogram of phospholipids exhibited two different peaks: the first one (135.9 °C) is mild, and the formation of this peak might be due to the rapid movements of phospholipid molecule polar head groups; the second endothermal peak at 223.2 °C was very sharp and the appearance of this peak might be owing to the melting or isomerization of the carbon-hydrogen chains in the phospholipids or the change of the crystal during the phase transition from gel state to liquid crystal state (16,25). The thermogram of EVO showed a single peak at 295.5 °C, suggesting that EVO was of high purity. Physical mixture of EVO and phospholipids showed two endothermal peaks, one at 224.4 °C and the other at 263.8 °C. The former had the same onset temperature (220.6 °C) with phospholipids and the later had the same onset temperature (259.2 °C) as the complex. It might be surmised that with rising temperature, phospholipids melt and EVO dissolved in the phospholipid, partially forming the complex, which might be explained by the theory of preparation by melt-out method. Three endothermal peaks which differed radically from that of EVO and phospholipids appeared in the thermogram of the complex, and the intrinsic endothermal peak of EVO was “shielded,” as depicted by Kidd et al. (8). The three new peaks, with onsets and maximums at 152.0 and 163.5 °C, 196.0 and 199.3 °C, and 255.9 and 262.1 °C, respectively, may indicate that EVO and phospholipids had some interaction, as previous researchers claimed in the cases of curcumin-phospholipid complex (27) and silybin-phospholipid complex (28–30). Here, taking EPLC as a hybrid molecule, we assumed that the first broad peak and the second sharp peak of the complex, shifted right and left respectively when compared with the thermogram of phospholipids, corresponding to the rapid movements and phase transition evoked by endothermal peaks of phospholipids, and the third sharp peak corresponded to that of EVO. Previous work had shown that the interactions between drug and phospholipids may be considered to be hydrogen bonding and/or van der Waals forces, although the exact interaction mechanism remained unclear.
The UV Spectroscopy
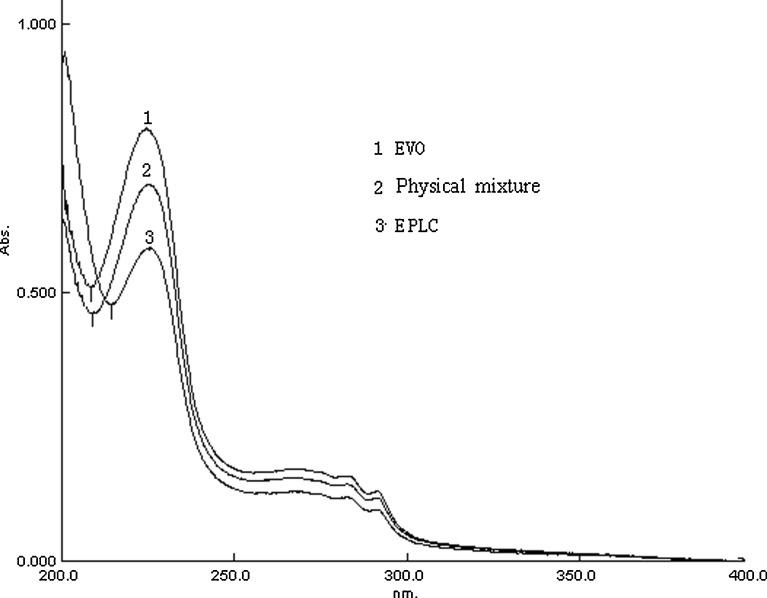
The UV spectra were shown in Fig. 6. In the spectrum profile of EVO, three typical absorption bands were present at 225, 282, and 291 nm. The spectrum profile of physical mixture was quite similar to that of EVO, except for a slight red-shift at the absorbance peak (225 nm) and absorbance trough. In the absorbance curve of EPLC, a slightly more significant red-shift occurred. The changes in the UV spectra among drug, physical mixture and phospholipid complex suggested the successful formation of EPLC. Opposed to our findings, it was reported by Xu et al. (31) that there was no difference between the UV spectra of the luteolin phospholipid complex and that of the physical mixture. The most reasonable interpretation construed from their molecular imaging spectra were that the polyphenol molecule (luteolin) was being shielded from detection by the imaging probes.
Fig. 6.
UV spectra of EPLC, EVO and the physical mixture
The FT-IR Spectroscopy
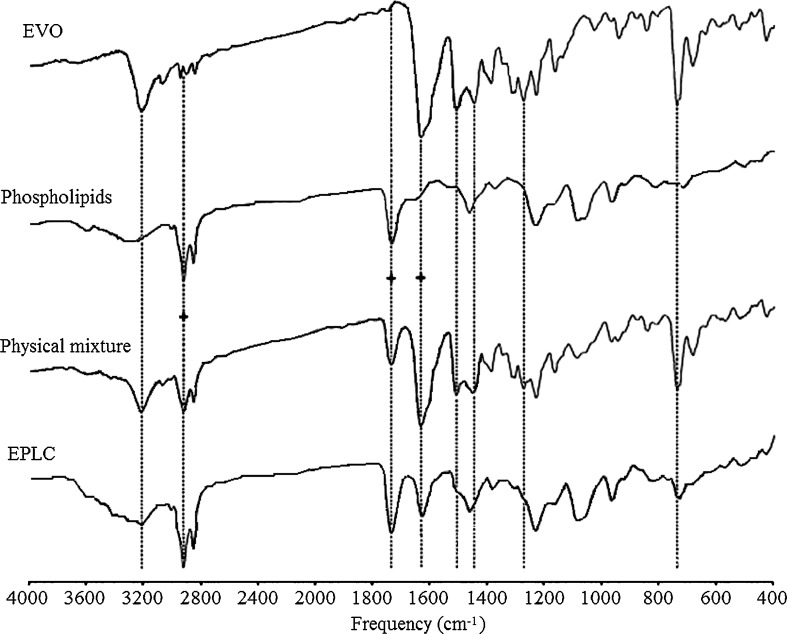
As shown in Fig. 7, the characteristic absorptions of EVO (32,33) were present at 3,216.36, 3,070.79, 2,942.26, 2,903.32, 1,632.41, 1,507.67, 1,446.64, 1,274.40, and 739.70 cm−1. The characteristic absorptions of phospholipids (34) were seen at 2,922.05 cm−1 (–CH2), 1,734.06 cm−1 (C=O), 1,462.87 cm−1 (–CH3), 1,232.60 cm−1 (P=O), 1,080.07 cm−1 (P–O–C), and 966.26 cm−1 (C–C–N). The spectrum of the complex was quite different from that of EVO and phospholipids. As indicated with dashed lines, peaks at 3,216.36, 3,070.79, 1,507.67, and 1,274.40 cm−1 were absent or shielded by phospholipids, and the absorption peaks at 2,942.26 and 2,903.32 cm−1 were likely “drowned” in the big sharp peak (2,922.05 cm−1) of phospholipids occupying the same region. The peak at 1,446.64 cm−1 shifted left to 1,462.87 cm−1 and the other peak shifted right to 731.44 cm−1, respectively. The spectrum profile of the physical mixture nearly perfectly overlaid that of the spectra of EVO and phospholipids. All the differences between spectra were highlighted with dash lines for a clear comparison, and three dash lines with plus signs were used for calibration.
Fig. 7.
FT-IR spectra of EVO, phospholipids, physical mixture, and EPLC
The 1H-NMR and MALDI-TOF Spectroscopy
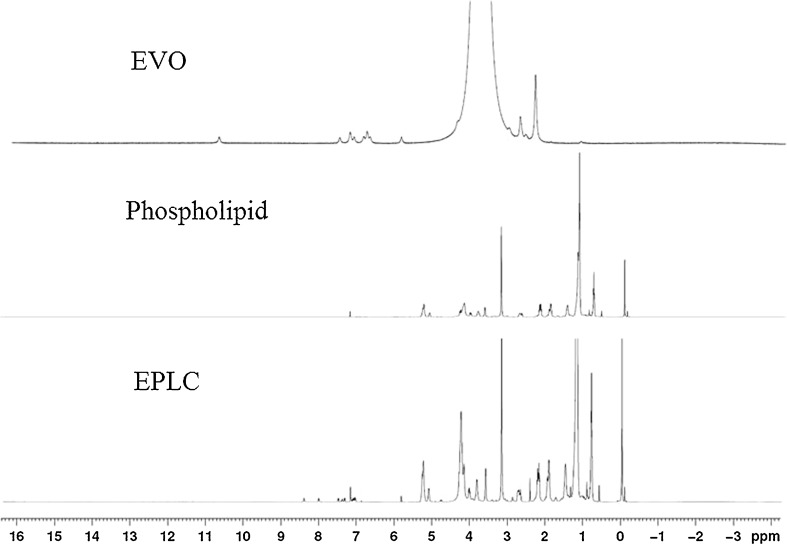
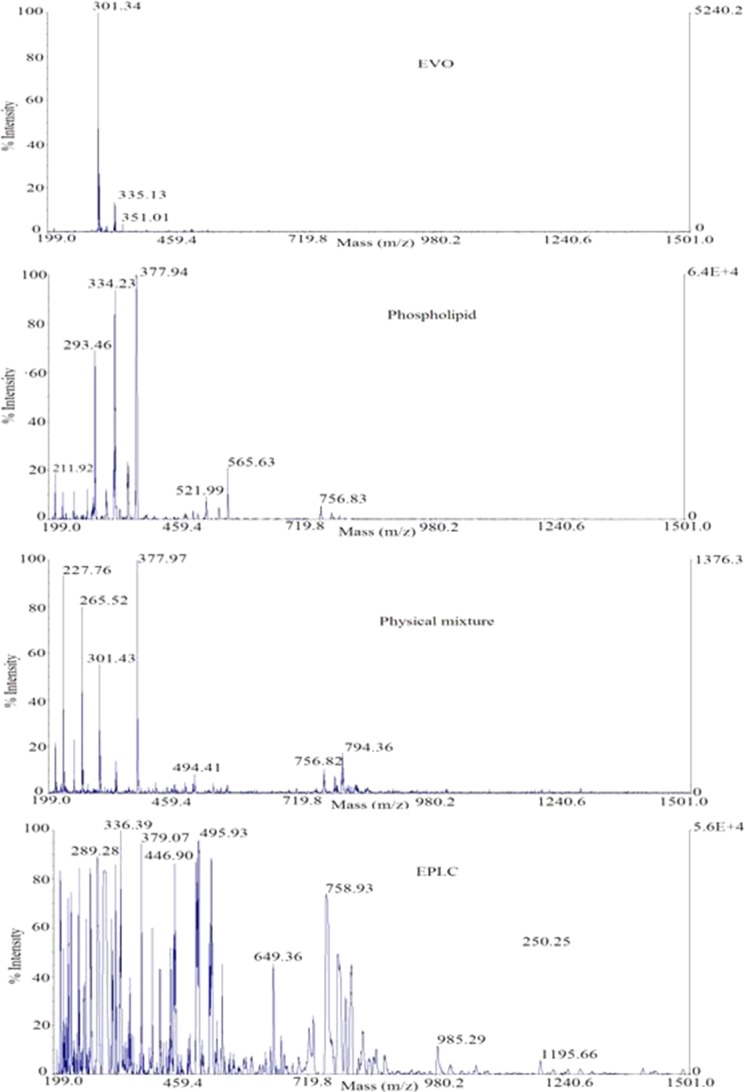
As shown in Figs. 8 and 9, the 1H-NMR and MALDI-TOF spectra of the complex were quite different from that of EVO, phospholipids, or the additive effect. Chemical shift values in 1H-NMR and MALDI-TOF spectra of the EPLC complex indicated that EVO and phospholipids might have some intermolecular interactions. The spectra of the EPLC complex or physical mixture were complicated partly because phospholipid was a mixture instead of a pure compound.
Fig. 8.
Proton NMR spectra of EVO, phospholipids, and EPLC
Fig. 9.
MALDI-TOF spectra of EVO, phospholipids, physical mixture, and EPLC
Scanning Electron Microscopy
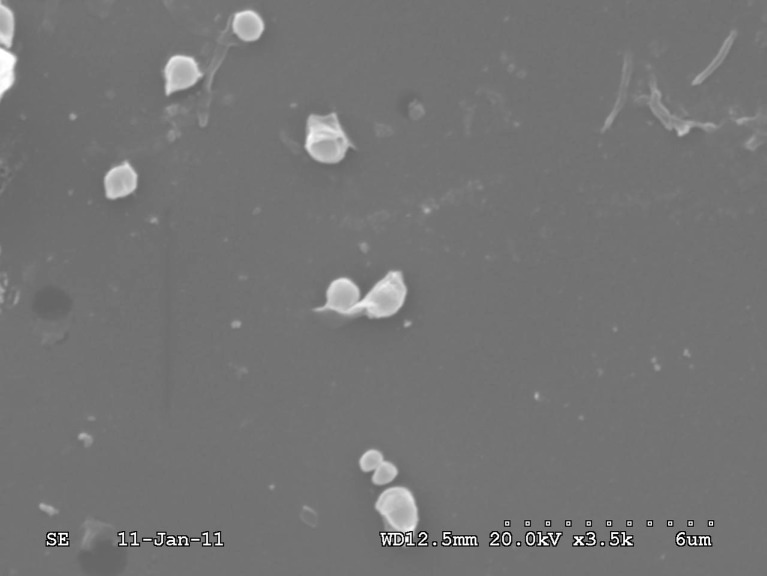
The scanning electron microscopic view, as shown in Fig. 10, indicated the presence of spherical or sphere like structure of the phospholipids complex in water (25,35).
Fig. 10.
Scanning electron micrograph of EPLC
Particle Size and Zeta Potential
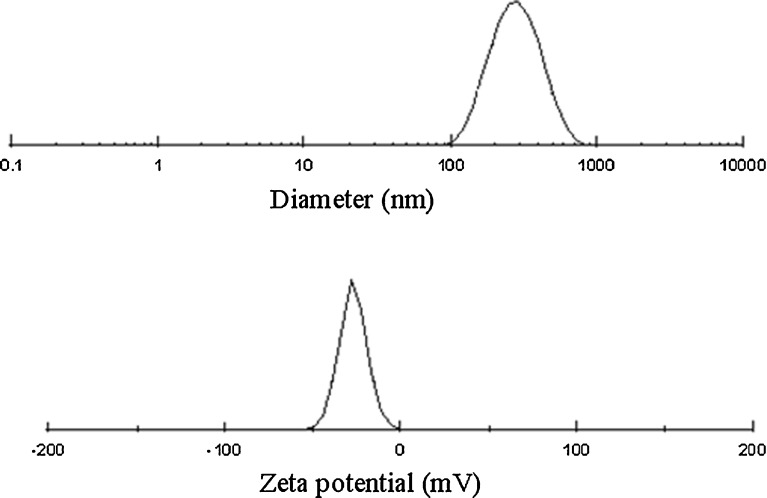
Figure 11 summarized the particle size and zeta potential of EPLC. The particle size was distributed in a narrow range about 246.1 nm with a polydispersity index of 0.164. The zeta potential of EPLC was −26.94 mV with the negative charge coming from the type and composition of phospholipid used. Zeta potential was a reliable indicator in the prediction of stability of particles in liquid medium and the possible interactions with other materials. Previous work had shown that negatively charged lipid vesicles (especially with a charge around −30 mV) had good stability and might be optimized for drug delivery (36). In previous studies, the particle size and zeta-potential were documented to be 169.2 nm and −21.6 mV (for bergenin PLC (B-PLC)), and 112.2 nm and −44.2 mV (for salvianolic acid B-PLC), respectively (35,37).
Fig. 11.
Size distribution and zeta potential profiles of EPLC
Apparent Solubility Studies
Table V showed average apparent solubility of EVO, the physical mixture, and EPLC in water and in n-octanol. The data indicated that EPLC significantly increased the hydrophilicity of EVO (solubility of EPLC in water is 3.43 times that of EVO material, p < 0.05). And the physical mixture also enhanced the solubility of EVO, but in a less-effective way. It was believed that the hydrophobic moiety of EVO held close to the phospholipid molecule by quasi-stable bonding and the non-polar group of EVO was masked by the phospholipid (8).
Table V.
Apparent Solubility of EVO, Physical Mixture, and EPLC in Water and in n-octanol at 25 °C (Mean±SD, n = 3)
| Samples | Apparent solubility (μg/mL) | |
|---|---|---|
| In water (C w) | In n-octanol (C o) | |
| EVO | 3.39 ± 0.06 | 598.59 ± 0.05 |
| Physical mixture | 5.00 ± 0.04 | 602.27 ± 0.03 |
| EPLC | 11.64 ± 0.01 | 617.62 ± 0.04 |
Dissolution Studies
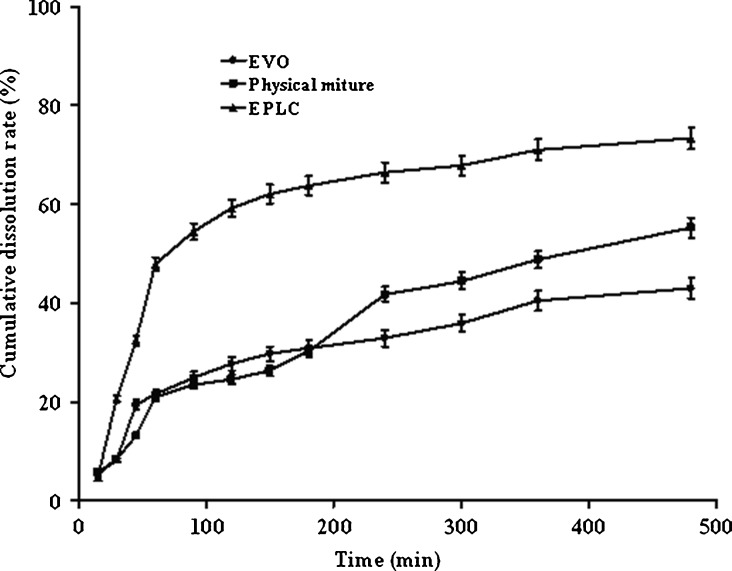
Figure 12 showed the dissolution profiles of EVO from EPLC, EVO, and the physical mixture in phosphate buffer saline (pH 6.8). The dissolution of EPLC was the highest compared with that of EVO material and the physical mixture at almost every corresponding time point. Based on these results, we can conclude that the amphiphilic phospholipid molecules showed a positive effect on the dissolution of EVO and conversion of EVO into phospholipid complex significantly magnifies this effect.
Fig. 12.
Dissolution profiles of EPLC (filled triangles), EVO (filled circles), and physical mixture (filled squares) in phosphate buffer saline (pH 6.8), respectively
Pharmacokinetic Study in Rats
Validation of Extraction and Quantification Method
EVO was completely separated from rat plasma under analytical conditions described above (Fig. 13), and standard curves ranging from 0.01 to 2.00 μg/mL were linear (r = 0.9999). The lowest detection limit was 0.01 μg/mL. The validation of the method for extraction and quantification of EVO from rat plasma was done by performing recovery rate experiments with the procedures described before. The method recovery rates of EVO from high, middle and low concentration ranges were 101.44, 99.82, 96.53 %, respectively. Intra- and inter-day precisions expressed as the relative standard deviation for the method were 2.70–4.14 and 1.89–4.21 %, respectively.
Fig. 13.
Typical chromatograms of EVO. a Blank rat plasma; b blank rat plasma spiked with EVO; c a sample after oral administration of EPLC. 1, EVO and 2, honokiol (internal standard)
Concentration of EVO in Rat Plasma
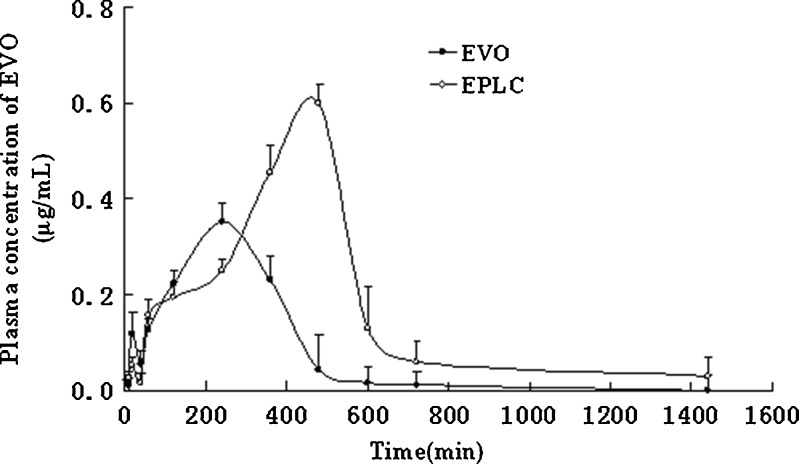
Figure 14 illustrated the drug plasma concentration versus time curves when the equivalent amount of EVO and EPLC were orally administered to rats (n = 6), respectively. The concentration-time curve of EVO displayed a low concentration peak (0.12 μg/mL) at 20 min followed by a much higher concentration peak (0.35 μg/mL) at 4 h, and these results were in agreement with the report written by Shyr et al. (3). In the case of EPLC, the first peak concentration (0.05 μg/mL) was almost half of that of free EVO at 20 min and the second peak concentration (0.60 μg/mL) was about two times that of free EVO at 8 h. Former research on phytosome preparations also confirmed that complexation technology could greatly increase the blood levels of botanical polyphenol constituents when administered orally (8,35).
Fig. 14.
Pharmacokinetic profiles of EVO (filled circles) and EPLC (empty circles) in rats after oral administration of EVO and EPLC equivalent to 500 mg/kg of EVO, respectively (n = 6)
The pharmacokinetic data were simulated by non-linear least squares. The results showed that both of the pharmacokinetic behaviors of EVO and EPLC confirm to two-compartment, first-order absorption for rats in vivo. From the above profile and Table VI, we knew that metabolism of EPLC was much slowly than that of EVO. Furthermore, the complex persisted for a longer period of time in vivo with a higher relative bioavailability of 218.82 % by comparing the AUC0−∞ of EPLC with that of EVO. The relative bioavailabilities of curcumin-PLC, oxymatrine-PLC, bergenin-PLC were documented as 125.80, 329, and 439 % in the literature (19,25,35).
Table VI.
Main Pharmacokinetic Parameters of EVO and EPLC with Non-model in Rats (Mean±SD, n = 6)
| Parameters | EVO | EPLC |
|---|---|---|
| C max (μg/L) | 352.01 | 599.66 |
| T max (h) | 4.00 | 8.00 |
| AUC0−t (μg h−1 L−1) | 1,762.05 | 3,874.88 |
| AUC0−∞ (μg h−1 L−1) | 1,772.35 | 3,878.24 |
| T 1/2 (h) | 1.33 | 2.07 |
| K el (h−1) | 0.52 | 0.33 |
C max peak concentration, T max peak time
The improvement of the relative bioavailability of EPLC after oral administration might be due to the following reasons: (1) the hydrophilicity and solubility of EPLC increased significantly, as a result of the interaction between the non-polar head of water-miscible phospholipid and the poorly water-soluble EVO molecular. Moreover, the high dispersibility of the phospholipid complexes was also responsible for the increased hydrophilicity and solubility of EPLC. (2) The dissolution rate of EPLC increased effectively. Being a lipophilic drug, the absorption and bioavailability of EVO was limited by its dissolution rate. Naturally, the EPLC complex with higher in vitro dissolution rate was expected to have better absorption, longer action time and higher bioavailability than that of EVO. Similar phenomena (the lipophilic drug-phospholipid complex with higher in vitro dissolution rate had better absorption, longer action time and higher bioavailability) were also reported by former researchers (12,16). (3) The extended release of EVO from EPLC and the decreased metabolism rate of EVO in EPLC might also be responsible for the prolonged action time and higher bioavailability. It was reported by Komatsu et al. (4) that free EVO metabolized quickly to EM-2 which eliminated rapidly (the plasma half-life of EM-2 was 1.53 h). The sustained characteristics of EPLC decreased the degradation of EVO from EPLC to EM-2. EVO undergoes extensive hepatic uptake and biliary excretion of enterohepatic circulation, as previously validated by Shyr et al. (3). The intestinal lymphatic transport occurred in the case of salvianolic acid B phospholipid complex (37), and the similar absorption phenomena might also occur in the case of EPLC. If so, EPLC might reduce the first-pass metabolism of EVO by bypassing liver. In the meanwhile, the EPLC which enter the liver might decrease the first-pass metabolism of EVO by complexing EVO into phospholipid and therefore avoiding the direct contact of the EVO with the hepatic metabolism enzymes. Of course, further studies are necessary in order to confirm these hypotheses. (4) The occurrence of intestinal lymphatic transport might be contributed to the better oral bioavailability of EPLC by enhancing the drug absorption through additional absorption route compared with that of free EVO.
CONCLUSIONS
The vegetal drug EVO could be successfully complexed with phospholipids to form phytosome (EPLC). The results of the central composite design study confirmed that the values of phospholipid-to-drug ratio, volume fraction of ethanol in the reaction medium, and reaction concentration of EVO significantly influenced the dependent variable (the complexation rate). DSC, UV, FT-IR, 1H-NMR, and MALDI-TOF spectroscopy curves of EPLC showed that EVO and phospholipids combined and formed supramolecular structures by non-covalent bonding, such as hydrogen bonds or van der Waals forces. The apparent solubility study showed that EPLC apparently increases the hydrophilicity of EVO. The in vitro dissolution rate of EPLC increased significantly. Compared with free EVO, the complex remarkably enhanced the oral bioavailability of EVO in vivo for rats. Further studies are necessary to evaluate the transport of EPLC through the gastrointestinal tract. EPLC is very promising candidate for drug delivery and warrants further study.
ACKNOWLEDGMENTS
The authors wish to thank the National Natural Science Foundation of China (no. 30973645), Chongqing Natural Science Foundation (No. CSCT2012JJB10019), and Specialized Research Fund for the Doctoral Program of Higher Education (no. 20095503120008).
Footnotes
Shan Liu is co-first author.
REFERENCES
- 1.Jiang J, Hu C. Evodiamine: a novel anti-cancer alkaloid from Evodia rutaecarpa. Molecules. 2009;14:1852–1859. doi: 10.3390/molecules14051852. [DOI] [PMC free article] [PubMed] [Google Scholar]
- 2.Liao C, Pan SL, Guh JH, Chang YL, Pai HC, Lin CH, et al. Antitumor mechanism of evodiamine, a constituent from Chinese herb Evodiae fructus, in human multiple-drug resistant breast cancer NCI/ADR-RES cells in vitro and in vivo. Carcinogenesis. 2005;26:968–975. doi: 10.1093/carcin/bgi041. [DOI] [PubMed] [Google Scholar]
- 3.Shyr MH, Lin LC, Lin TY, Tsai TH. Determination and pharmacokinetics of evodiamine in the plasma and feces of conscious rats. Anal Chim Acta. 2006;558:16–21. doi: 10.1016/j.aca.2005.11.045. [DOI] [Google Scholar]
- 4.Komatsu K, Wakame K, Kano Y. Pharmacological properties of galenical preparation. XVI. Pharmacokinetics of EVO and the metabolite in rats. Biol Pharm Bull. 1993;16:935–938. doi: 10.1248/bpb.16.935. [DOI] [PubMed] [Google Scholar]
- 5.Giacomelli S, Gallo D, Apollonio P, Ferlini C, Distefano M, Morazzoni P, et al. Silybin and its bioavailable phospholipid complex (IdB 1016) potentiate in vitro and in vivo the activity of cisplatin. Life Sci. 2002;70:1447–1459. doi: 10.1016/S0024-3205(01)01511-9. [DOI] [PubMed] [Google Scholar]
- 6.Di Pierro F, Menghi AB, Barreca A, Lucarelli M, Calandrelli A. Greenselect phytosome as an adjunct to a low-calorie diet for treatment of obesity: a clinical trial. Altern Med Rev. 2009;14:154–160. [PubMed] [Google Scholar]
- 7.Flaig TW, Glode M, Gustafson D, Bokhoven A, Tao Y, Wilson S, et al. A study of high-dose oral silybin-phytosome followed by prostatectomy in patients with localized prostate cancer. Prostate. 2010;70:848–855. doi: 10.1002/pros.21118. [DOI] [PubMed] [Google Scholar]
- 8.Kidd PM. Bioavailability and activity of phytosome complexes from botanical polyphenols: the silymarin, curcumin, green tea, and grape seed extracts. Altern Med Rev. 2009;14:226–246. [PubMed] [Google Scholar]
- 9.Barry J, Fritz M, Brender JR, Smith PES, Lee DK, Ramamoorthy A. Determining the effects of lipophilic drugs on membrane structure by solid-state NMR spectroscopy: the case of the antioxidant curcumin. J Am Chem Soc. 2009;131:4490–4498. doi: 10.1021/ja809217u. [DOI] [PMC free article] [PubMed] [Google Scholar]
- 10.Bombardelli E, Curri SB, Della LR, Del NP, Tubaro A, Gariboldi P. Complex between phospholipids and vegetal derivatives of biological interest. Fitoterapia. 1989;60:1–9. [Google Scholar]
- 11.Li Y, Pan WS, Chen SL, Yang DJ, Chen XZ, Xu HX. Studies on preparation of puerarin phytosomes and their solid dispersion. Chin Pharm J. 2006;41:1162–1167. [Google Scholar]
- 12.Sikarwar MS, Sharma S, Jain AK, Parial SD. Preparation, characterization and evaluation of Marsupsin-phospholipid complex. AAPS Pharm Sci Tech. 2008;9:129–137. doi: 10.1208/s12249-007-9020-x. [DOI] [PMC free article] [PubMed] [Google Scholar]
- 13.Martins SAM, Prazeres DMF, Fonseca LP, Monteiro GA. Application of central composite design for DNA hybridization onto magnetic microparticles. Anal Biochem. 2009;391:17–23. doi: 10.1016/j.ab.2009.05.006. [DOI] [PubMed] [Google Scholar]
- 14.Tsapatsaris S, Kotzekidou P. Application of central composite design and response surface methodology to the fermentation of olive juice by Lactobacillus plantarum and Debaryomyces hansenii. Int J Food Microbiol. 2004;95:157–161. doi: 10.1016/j.ijfoodmicro.2004.02.011. [DOI] [PubMed] [Google Scholar]
- 15.Yue PF, Zhang WJ, Yuan HL, Yang M, Zhu WF, Cai PL, et al. Process optimization, characterization and pharmacokinetic evaluation in rats of ursodeoxycholic acid-phospholipid complex. AAPS PharmSciTech. 2008;9:322–329. doi: 10.1208/s12249-008-9040-1. [DOI] [PMC free article] [PubMed] [Google Scholar]
- 16.Xiao YY, Song YM, Chen ZP, Ping QN. The preparation of silybin-phospholipid complex and the study on its pharmacokinetics in rats. Int J Pharm. 2006;307:77–82. doi: 10.1016/j.ijpharm.2005.10.001. [DOI] [PubMed] [Google Scholar]
- 17.Xu JH, Liu WY, Zheng F, Sun D, Yang Q, Rao JH. Determination of EVO by high performance liquid chromatography-tandem mass pectrometry and pharmacokinetic studies in rats. Chin J Clin Pharmacol Ther. 2007;12:427–433. [Google Scholar]
- 18.Zhang JQ, Zhang ZR, Yang H, Tan QY, Qing SR, Qiu XL. Lyophilized paclitaxel magnetoliposomes as a potential drug delivery system for breast carcinoma via parenteral administration: in vitro and in vivo studies. Pharm Res. 2005;22:573–583. doi: 10.1007/s11095-005-2496-8. [DOI] [PubMed] [Google Scholar]
- 19.Yue PF, Yuan HL, Li XY, Yang M, Zhu WF. Process optimization, characterization and evaluation in vivo of oxymatrine-phospholipid complex. Int J Pharm. 2010;387:139–146. doi: 10.1016/j.ijpharm.2009.12.008. [DOI] [PubMed] [Google Scholar]
- 20.Shi YJ, Wu PJ, Wei P. Optimization on preparation of hawthorn fruit total flavonoids-phospholipid complex using Plackett–Burman design, central composite design and response surface methodology. Zhong Yao Cai. 2010;33:437–441. [PubMed] [Google Scholar]
- 21.Liu A, Lou H, Zhao L, Fan P. Validated LC/MS/MS assay for curcumin and tetrahydrocurcumin in rat plasma and application to pharmacokinetic study of phospholipid complex of curcumin. J Pharm Biomed Anal. 2006;40:720–727. doi: 10.1016/j.jpba.2005.09.032. [DOI] [PubMed] [Google Scholar]
- 22.Franceschi F, Giori A. (Indena S.p.A.) Phospholipid complexes of olive fruits or leaves extracts having improved bioavailability. Patent app. WO2007118631, 2007.
- 23.Xu YY, Sun YM, Cai ZP, Ping QN. The preparation of silybin-phospholipid complex and the study on its pharmacokinetics in rats. Int J Pharm. 2006;307:77–82. doi: 10.1016/j.ijpharm.2005.10.001. [DOI] [PubMed] [Google Scholar]
- 24.Song Y, Zhuang J, Guo J, Xiao Y, Ping Q. Preparation and properties of a silybin-phospholipid complex. Pharmazie. 2008;63:35–42. [PubMed] [Google Scholar]
- 25.Maiti K, Mukherjee K, Gantait A, Saha BP, Mukherjee PK. Curcumin-phospholipid complex: preparation, therapeutic evaluation and pharmacokinetic study in rats. Int J Pharm. 2007;330:155–163. doi: 10.1016/j.ijpharm.2006.09.025. [DOI] [PubMed] [Google Scholar]
- 26.Zhang JQ, Liu J, Li XL, Jasti BR. Preparation and characterization of solid lipid nanoparticles containing silibinin. Drug Deliv. 2007;14:381–387. doi: 10.1080/10717540701203034. [DOI] [PubMed] [Google Scholar]
- 27.Began G, Sudharshan E, Sanka KU, Rao AAG. Interaction of curcumin with phosphatidylcholine: a spectrofluorometric study. J Agric Food Chem. 1999;47:4992–4997. doi: 10.1021/jf9900837. [DOI] [PubMed] [Google Scholar]
- 28.Hwang SB, Shen TY. Membrane effects of anti-inflammatory agents. 2. Interaction of nonsteroidal anti-inflammatory drugs with liposome and purple membranes. J Med Chem. 1981;24:1202–1212. doi: 10.1021/jm00142a016. [DOI] [PubMed] [Google Scholar]
- 29.Venema FR, Weringa WD. The interactions of phospholipid vesicles with some anti-inflammatory agents. J Colloid Interface Sci. 1988;125:484–500. doi: 10.1016/0021-9797(88)90013-6. [DOI] [Google Scholar]
- 30.Lasonder E, Weringa WD. An NMR and DSC study of the interaction of phospholipids vesicles with some anti-inflammatory agents. J Colloid Interface Sci. 1990;139:469–478. doi: 10.1016/0021-9797(90)90119-9. [DOI] [Google Scholar]
- 31.Xu K, Liu B, Ma Y, Du J, Li G, Gao H, et al. Physicochemical properties and antioxidant activities of luteolin-phospholipid complex. Molecules. 2009;14:3486–3493. doi: 10.3390/molecules14093486. [DOI] [PMC free article] [PubMed] [Google Scholar]
- 32.Shoji N, Umeyama A, Luchi A. Isolation of an amide, a possible key precursor to EVO, from Evodia rutaecarpa. J Nat Prod. 1988;51:161–163. doi: 10.1021/np50055a028. [DOI] [PubMed] [Google Scholar]
- 33.Joshi BS, Moore KM, Pelletier SM, Puar MS. Alkaloids of Zanthoxylum budrunga wall: NMR assignments of dihydrochelerythrine, (±)-EVO and zanthobungeanine. Phytochem Anal. 1991;2:20–25. doi: 10.1002/pca.2800020105. [DOI] [Google Scholar]
- 34.Han Y, Zhou Y, Zhao YF. The purification and the identification of lecithin and its application. Amino Acids & Biotic Resour. 2001;23:28–31. [Google Scholar]
- 35.Qin X, Yang Y, Fan TT, Gong T, Zhang XN, Huang Y. Preparation, characterization and in vivo evaluation of bergenin-phospholipid complex. Acta Pharmacol Sin. 2010;31:127–136. doi: 10.1038/aps.2009.171. [DOI] [PMC free article] [PubMed] [Google Scholar]
- 36.Tan QY, Wang N, Yang H, Zhang LK, Liu S, Chen L, et al. Characterization, stabilization and activity of uricase loaded in lipid vesicles. Int J Pharm. 2010;384:165–172. doi: 10.1016/j.ijpharm.2009.09.036. [DOI] [PubMed] [Google Scholar]
- 37.Peng Q, Zhang ZR, Sun X, Zuo J, Zhao D, Gong T. Mechanisms of phospholipid complex loaded nanoparticles enhancing the oral bioavailability. Mol Pharm. 2010;7:565–575. doi: 10.1021/mp900274u. [DOI] [PubMed] [Google Scholar]


