Abstract
The purpose of this study was to utilize near-infrared (NIR) spectroscopy and near-infrared chemical imaging (NIR-CI) as non-invasive techniques to evaluate the drug loading in letrozole-loaded PLGA nanoparticle formulations prepared by the emulsification–solvent evaporation method. A Plackett–Burman design was applied to evaluate the main effects of amount of drug (X1), amount of polymer (X2), stirring rate (X3), emulsifier concentration (X4), organic to aqueous phase volume ratio (X5), type of organic solvent (X6), and homogenization time (X7) on drug entrapment efficiency. The influence of three different spectral pretreatment methods (multiplicative scatter correction, standard normal variate, and Savitzky–Golay second derivative transformation with third-order polynomial) and two different regression methods (PLS regression and principal component regression (PCR)) on model prediction ability were compared. PLS of spectra that were pretreated with Savitzky–Golay second derivative transformation provided better model prediction than PCR as it revealed better linear correlation (correlation coefficient of 0.991) for both calibration and prediction models. Relatively low values of root mean square errors of calibration (RMSEC = 0.748) and prediction (RMSEP = 0.786) and low standard errors of calibration (SEC = 0.758) and prediction (SEP = 0.589) suggested good predictability for estimation of the loading of letrozole in PLGA nanoparticles. NIR-CI analysis also revealed mutual homogenous distribution of both polymer and drug and was capable of clearly distinguishing the 12 formulations both quantitatively and qualitatively. In conclusion, NIR and NIR-CI could be potentially used to characterize anticancer drug-loaded nanoparticulate matrix.
KEY WORDS: imaging, letrozole, nanoparticle, near-infrared, PCR, PLGA, PLS
INTRODUCTION
Letrozole is a third generation, non-steroidal competitive aromatase inhibitor approved for the endocrine treatment of estrogen receptor positive (ER+) breast cancer. It is commercially available as an oral tablet (Femara®, 2.5 mg daily). For patients with advanced breast cancer, the drug should be continued until tumor progression ends (1). The oral dosage form of letrozole offers uncontrolled delivery and release, lacks specificity, often leads to poor patient compliance, and results in major systemic side effects such as deep vein thrombosis, bone loss, and hypercholestremia, following long-term therapy (1,2). To increase target specificity, improve pharmacokinetic behavior, and tissue distribution, it would be ideal if a sustained delivery system could be used for letrozole. Polymeric nanoparticles are very small in size and are able to cross the highly permeable vasculature supplying blood to the tumor, and enter tumor cells through endocytosis (3). Biodegradable polymers such as poly (d,l-lactic-co-glycolic acid) (PLGA) are biocompatible, FDA approved, and have the ability to release the active agent in a controlled or sustained manner in order to maintain therapeutic blood levels over extended periods of time. This may lead to improved therapeutic efficacy and reduce the dosing frequency for enhanced patient compliance and convenience while reducing the severity and frequency of side effects (4).
The application of traditional analytical methods such as reverse phase high-performance liquid chromatography (RP-HPLC) and UV spectroscopy in pharmaceutical development usually requires destructive extraction procedures of small, nominally random product samples to document product quality (5). Such procedures are time-consuming and often fail to assure zero-defect product quality since they fail to identify the effect of critical process parameters on product quality attributes (6). Process Analytical Technology is a system for designing, analyzing, and controlling manufacturing processes based on continuous monitoring of critical quality and performance attributes of products. It has shifted the focus from laboratory-based “testing to document quality paradigm” to a “continuous quality assurance paradigm” which provides real-time process control to improve the understanding of the physical and chemical processes that occur during pharmaceutical unit operations (5,7).
Near-infrared (NIR) spectroscopy and chemical imaging (NIR-CI) have emerged as valuable tools for pharmaceutical quality analyses since they provide a wealth of chemical and physical information required for measuring process performance (6). The major advantages of NIR spectroscopy and imaging over traditional analytical methods lie in their rapid and nondestructive measurements without the need for any sample pretreatments, its robust instrumentation (8), capacity for remote measurement by interfacing with fiber optic probes, and ability to predict chemical and physical properties from a single spectrum (5,9). NIR imaging combines NIR spectroscopy with digital image processing and provides both spatial and spectral information about the distribution of components in a sample (10). The main disadvantages of NIR spectroscopy and imaging are the minor intensity of absorption and the broadening of absorption bands (11). These drawbacks are compensated for by the application of a user-friendly software for multivariate analysis that allows for the extraction of essential information for the properties of interest of the analyzed system from a large dataset (5).
The purpose of this research was to utilize NIR spectroscopy and chemical imaging as nondestructive methods to evaluate the drug contents in PLGA-based nanoparticles of letrozole through a Plackett–Burman (PB) screening design.
MATERIALS AND METHODS
Materials
Letrozole (purity 99.9 %) was purchased from 2A Pharmachem (Lisle, Illinois, USA). Poly (lactide-co-glycolide) (PLGA, 50:50 of inherent viscosity 0.58dL/g in hexafluoroisopropanol, Mw ≈ 30,000 Da) was purchased from Lactel® International Absorbable Polymers (Pelham, AL, USA). Polyvinyl alcohol (PVA; molecular weight 13, 000–23,000), HPLC-grade dichloromethane, chloroform, and acetonitrile were obtained from Sigma-Aldrich (St. Louis, MO, USA). All reagents and chemicals used were of analytical grade and were used as received.
Design of Experiments
Plackett–Burman experimental designs are fractional factorial designs that are used to identify the main effects of a large number of factors that are likely to affect critical qualities of a particular formulation. Because PB designs are fractional factorial designs, the number of runs needed to investigate main effects is equal to 2n or multiples of 4 and so they can be used to identify critical factors with the least number of experimental runs, with very good degree of accuracy (12,13). They are therefore very useful when the aim is to identify factors or variables that can be fixed or eliminated in further investigations.
In this study, a Plackett–Burman design was applied to examine the effects of amount of drug (X1), amount of polymer (X2), stirring rate (X3), emulsifier concentration (X4), organic to aqueous phase volume (X5), type of organic solvent (X6), and homogenization time (X7) on drug entrapment efficiency, using JMP software, version 8.0.2 (SAS, NC, USA). The independent factors, their high and low levels were based on preliminary studies and also on reports by other authors on their effects on the selected responses (9,14–16). The levels of polymer and drug were selected based on preliminary in vitro release experiments which showed that increasing the drug concentration relative to the polymer (drug/polymer ratio of 1:2) resulted in significantly higher burst release. The different formulation composition and manufacturing conditions are shown in Table I.
Table I.
Plackett–Burman Experimental Design
| Formulation | Amount of drug (mg) (X 1) | Amount of polymer (mg) (X 2) | Stirring rate (rpm) (X 3) | Emulsifier (%w/v) (X 4) | O/W ratio (X 5) | Organic solvent (X 6) | Homogenization time (min) (X 7) |
|---|---|---|---|---|---|---|---|
| 1 | 25 | 400 | 1,200 | 0.4 | 1:10 | CLF | 5 |
| 2 | 25 | 200 | 1,200 | 0.2 | 1:10 | DCM | 5 |
| 3 | 50 | 200 | 600 | 0.4 | 1:10 | DCM | 10 |
| 4 | 50 | 400 | 1,200 | 0.2 | 1:10 | CLF | 10 |
| 5 | 50 | 200 | 1,200 | 0.4 | 1:20 | CLF | 5 |
| 6 | 25 | 200 | 600 | 0.4 | 1:10 | CLF | 10 |
| 7 | 25 | 200 | 1,200 | 0.2 | 1:20 | DCM | 10 |
| 8 | 50 | 400 | 600 | 0.2 | 1:10 | DCM | 5 |
| 9 | 50 | 400 | 1,200 | 0.4 | 1:20 | DCM | 10 |
| 10 | 25 | 400 | 600 | 0.2 | 1:20 | CLF | 10 |
| 11 | 25 | 400 | 600 | 0.4 | 1:20 | DCM | 5 |
| 12 | 50 | 200 | 600 | 0.2 | 1:20 | CLF | 5 |
CLF chloroform, DCM dichloromethane
The PB design model is described by the linear regression equation;
 |
where Y is the response, B0 is the arithmetic mean response and B1, B2,……, Bn are the coefficients of the factors X1, X2…..Xn, respectively.
Preparation of Letrozole-Loaded Nanoparticles
Letrozole-loaded nanoparticles were prepared using the emulsification–solvent evaporation method described by Zidan et al. (9), with some modifications. Briefly, accurately weighed amounts of PLGA and letrozole, based on the experimental design (Table I), were dissolved in 10 ml of organic solvent (dichloromethane or chloroform). PVA solution was prepared with demineralized water by heating and then cooled to room temperature before use. The organic phase was added dropwise to the aqueous phase with stirring at 300 rpm using a Lightnin stirrer (General Signal Co., NY). After the addition of the organic phase, the oil-in-water emulsion was mixed by homogenizing at 6,000 rpm with a probe homogenizer (PowerGen 125, Fisher Scientific, PA) for 5 or 10 min, according to the experimental design (Table I), while stirring. The resulting emulsion was further stirred for about 3 h at room temperature to ensure complete evaporation of the organic solvent. For NIR spectroscopy and chemical imaging analyses, control samples of letrozole only and PLGA only, were prepared using the same method described above. For PLGA only, the levels for formulation 1 (but without letrozole) were used while for letrozole only controls, the levels for formulation 5 (but without PLGA) were used. Three replicates of each formulation and controls were prepared in each case for analyses to ensure reproducibility of the process. Nanoparticles were harvested from the aqueous phase by centrifugation (L8-70M ultracentrifuge, Beckman Coulter Co., USA) at 21,000 rpm for 30 min at 4°C. The obtained nanoparticles were washed twice with 10 ml of double-distilled water and freeze-dried (Labconco Co., MI) for 24 h. The freeze-dried nanoparticles were then stored in a refrigerator at 4°C until further studies.
Characterization of Letrozole-Loaded Nanoparticles
The size of the prepared nanoparticles were analyzed by photon correlation spectroscopy using a Zetasizer Nano-ZS (Malvern Instruments Inc., Westborough, MA) at an angle of 90° in 10-mm path length cells at 25°C. About 5 mg of the freeze-dried nanoparticles was suspended in demineralized water and sonicated for about 2 min. About 1 ml of the suspension was placed in a disposable cuvette and the particle size determined. Particle size was expressed as the mean number weighted.
Surface morphology of the nanoparticles was visualized by scanning electron microscopy (JSM-6390 LV, JOEL, Tokyo, Japan). Powdered nanoparticles were fixed to aluminum stubs with double-sided carbon tape and sputter-coated with gold (Desk V, Denton Vacuum, NJ) before SEM observation under high vacuum.
The amount of letrozole in PLGA nanoparticles was assayed using a validated HPLC method developed according to the USP monograph (USP31/NF 26) of letrozole assay. The HPLC system (Shimadzu, Kyoto, Japan) consisted of two LC-10AD VP pumps, a SIL-10AD VP autoinjector at room temperature, a variable programmable SPD-10AV VP UV–vis detector and a SCL-10A VP system controller connected to a class VP 5.03 data processing system. The stationary phase was a Zorbax SB-C8, 4.6 × 150 mm column (3.5 μm packing) fitted with an SB-C8, 4.6 × 12.5 mm reliance guard column (Agilent Technologies), while the mobile phase was water and acetonitrile (55:45 v/v). Elution was carried out isocratically at a flow rate of 1.0 ml/min and an injection volume of 20 μL at a wavelength of 232 nm. The developed chromatographic method, validated according to ICH Q2R1 guidelines (17) showed linearity (R2 = 0.9998) in the range from 1 to 60 μg/ml, accuracy with recovery between 95 and 105 %, LOD of 0.213 μg/ml and LOQ of 0.75 μg/ml.
Approximately 5 mg of freeze-dried nanoparticles were dissolved in 5 ml of chloroform by vigorous vortexing and sonication for about 5 min. The resulting solution was then filtered through a 0.22-μm filter. About 100 μL of the resulting solution was then diluted with 900 μL of the mobile phase and assayed by HPLC. Experiments were performed in triplicate and the entrapment efficiency (EE) was calculated according to the formula:
 |
NIR Spectroscopy
NIR spectra for the 12 formulations were collected using a Foss NIR spectrometer equipped with a 5000 Rapid Content Analyzer module (Foss NIRSystems, model 6500, Laurel, MD) and a Vision software (version 3.2) for data collection. Spectra acquisition was carried out in the diffuse reflectance mode over the range of 1,100-2,500 nm, using a tungsten-halogen lamp, a quartz beam splitter and an indium–gallium arsenide (InGaAs) detector.
Freeze-dried nanoparticles were placed in 2-ml transparent borosilicate glass vials with crimped polyethylene caps and spectra were obtained in sextet for each formulation by scanning directly through the base of the sample vials. The vials were rotated during each scan to ensure representative spectra. Spectral processing and chemometric analyses were performed using Unscrambler software (version 9.7, CAMO Software AS, Oslo, Norway). Three different pretreatment methods were applied to study the effect of each on the robustness of the calibration model, namely multiplicative scatter correction (MSC), standard normal variate (SNV), and third-order polynomial Savitzky–Golay second derivative with a filter width of 7 data points. Principal component analysis was then performed on the pretreated spectra by dividing the 12 formulations into two independent sets, namely calibration set and validation set, according to their measured drug loadings from the destructive entrapment experiment. Each set contained 36 samples. Formulations 1, 2,3,7,8, and 9, covering an actual drug loading range of 4.60–17.89 % were assigned to the calibration set while formulations 4, 5, 6, 10, 11, and 12, covering an actual drug loading range of 3.09–18.53 % were assigned to the validation set. Partial least squares (PLS) and principal component (PCR) regression were then performed to develop the calibration and validation models. The selection of a robust model with the best predictive ability was made according to the following criteria: low standard errors of calibration (SEC) and prediction (SEP), low root mean square errors of calibration (RMSEC), and prediction (RMSEP), high correlation coefficient, and small bias and small differences between RMSEC and RMSEP (18).
Near-Infrared Chemical Imaging
Near-infrared images of the 12 formulations were obtained using Sapphire™ NIR spectral Imaging system (Spectral Dimensions Inc., Olney, MD). The freeze-dried powdered samples were placed on a locally made aluminum plate with a 5-mm hole and NIR light (in the diffuse reflectance mode) from an illumination source was focused on the samples. The reflected light was captured via an imaging optic and passed through a spectral encoder, a liquid crystal tunable filter, which separated the images into their spectral components over the spectral range of 1,100–2,450 nm. The images of the samples at the selected wavelengths were then recorded on an InGaAs focal plane array (FPA) detector. Each pixel in the detector array corresponds to approximately 1,600 μm2 (40 × 40 μm) area of the powder surface and each data set contains 125 wavelength increment scans per spectrum. The resulting three-dimensional data sets, generally referred to as hyper spectral image cubes, consisted of x-axis and y-axis which represented the spatial information and the z-axis, which represented the spectral information.
Reflectance calibration was carried out to account for the background spectral response of the instrument and the ‘dark’ camera response. The background (B) cube image was obtained with the camera focused on a high reflectance standard (Spectralon-99) and dark cube (D) was acquired with the camera focused at a mirror (no reflectance). Reflectance (R) was then obtained by processing the sample (S), dark cube (D), and the background (B) image cubes using the relationship:
 |
Spectral data were analyzed using ISys™ 5.0 software (Spectral Dimensions Inc.) by first converting the data into absorbance using the equation:
 |
As in NIR spectroscopy, three different preprocessing methods namely MSC, SNV, and Savitzky–Golay second derivative with a filter width of 7 points, were applied to the data to reduce or eliminate interferences such as intensity differences and light scattering effects. PLS regression was performed on the data sets. To visualize the differences within formulations, a library was built from the pure component spectra representing this binary system (letrozole and PLGA). The intensity values for the PLS score images were then analyzed based on the library with class 1 representing letrozole. The spectral absorbance for each pixel was decomposed into score values associated with each component. A quantitative measure of the percent drug loading was also determined by calculating the percent standard deviation of the distribution of the pixel intensities derived from the histograms of the PLS score images.
RESULTS AND DISCUSSION
Letrozole-loaded nanoparticles were successfully prepared using the emulsification–solvent evaporation method outlined. Since Placket–Burman designs are resolution 4 designs, only main effects of the selected variables were analyzed and factors that had significant main effects on the responses were selected for further studies during optimization. SEM image (Fig. 1) showed that the prepared nanoparticles were well-formed and non-porous with some agglomeration, which was expected with PLGA.
Fig. 1.
SEM image of letrozole-loaded nanoparticles (formulation 6)
Based on the various factor combinations generated by the Plackett–Burman experimental design, there was observed variation in the particle sizes of the various formulations. The mean particle sizes obtained for the various formulations ranged from 225.4 ± 32.1 nm (formulation 6) to 707.1 ± 51.9 nm (formulation 4; Table II). It was observed from statistical analyses that generally, an increase in the amounts of drug and polymer resulted in a corresponding increase in the particle size. This could be attributed to an increase in the viscosity of the organic phase, resulting in a high viscous resistance against the net shear stress during the emulsification step. This hindered the rapid dispersion of the organic phase into the aqueous phase. The increased viscosity also caused small nanodroplets to coalesce to form larger particles resulting in an increase in the particle size (14,15).
Table II.
Observed Particle Sizes, PDI, Drug Loading, and Entrapment Parameters for the 12 Formulations Determined by Photon Correlation Spectroscopy and Destructive RP-HPLC Analysis
| Formulation | Particle size (nm) | Polydispersity index (PDI) | Theoretical drug loading (%) | Actual drug loading (%) | Actual PLGA loading (%) | Entrapment efficiency (%) |
|---|---|---|---|---|---|---|
| 1 | 461.3 ± 42.3 | 0.381 ± 0.021 | 5.88 | 4.6 ± 0.13 | 95.4 | 78.3 ± 2.15 |
| 2 | 504.1 ± 25.7 | 0.436 ± 0.012 | 11.11 | 8.63 ± 0.36 | 91.37 | 77.67 ± 0.55 |
| 3 | 499.2 ± 31.2 | 0.642 ± 0.011 | 20.0 | 17.89 ± 0.23 | 82.11 | 89.46 ± 1.14 |
| 4 | 707.1 ± 51.9 | 0.390 ± 0.004 | 11.11 | 10.6 ± 0.19 | 89.4 | 95.47 ± 1.75 |
| 5 | 526.5 ± 41.5 | 0.562 ± 0.027 | 20.0 | 16.29 ± 0.27 | 83.71 | 81.45 ± 1.37 |
| 6 | 225.4 ± 32.1 | 0.500 ± 0.029 | 11.11 | 10.43 ± 0.11 | 89.57 | 93.88 ± 0.97 |
| 7 | 420.5 ± 31.5 | 0.349 ± 0.007 | 11.11 | 6.13 ± 0.28 | 93.87 | 55.08 ± 2.49 |
| 8 | 702.2 ± 45.5 | 0.259 ± 0.022 | 11.11 | 9.86 ± 0.10 | 90.14 | 84.76 ± 0.87 |
| 9 | 611.3 ± 38.1 | 0.257 ± 0.022 | 11.11 | 8.57 ± 0.13 | 91.43 | 77.14 ± 1.13 |
| 10 | 415.7 ± 25.2 | 0.817 ± 0.072 | 5.88 | 4.31 ± 0.22 | 95.69 | 73.24 ± 3.77 |
| 11 | 496.4 ± 45.3 | 0.321 ± 0.009 | 5.88 | 3.09 ± 0.20 | 96.91 | 52.61 ± 3.33 |
| 12 | 535.6 ± 22.5 | 0.457 ± 0.005 | 20.0 | 18.53 ± 0.15 | 81.47 | 92.65 ± 0.77 |
For the 12 formulations, the various factor combinations also resulted in entrapment efficiency range from 52.61 ± 3.33 % (formulation 11) to 95.47 ± 1.75 % (formulation 4; Table II). The regression equation explaining the effects of the various factors on EE (Y) is given by:
 |
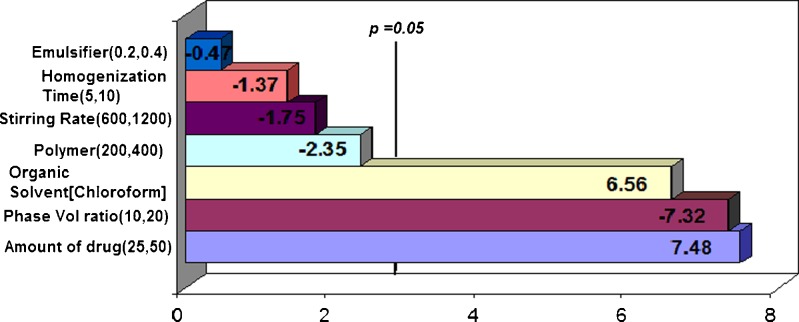
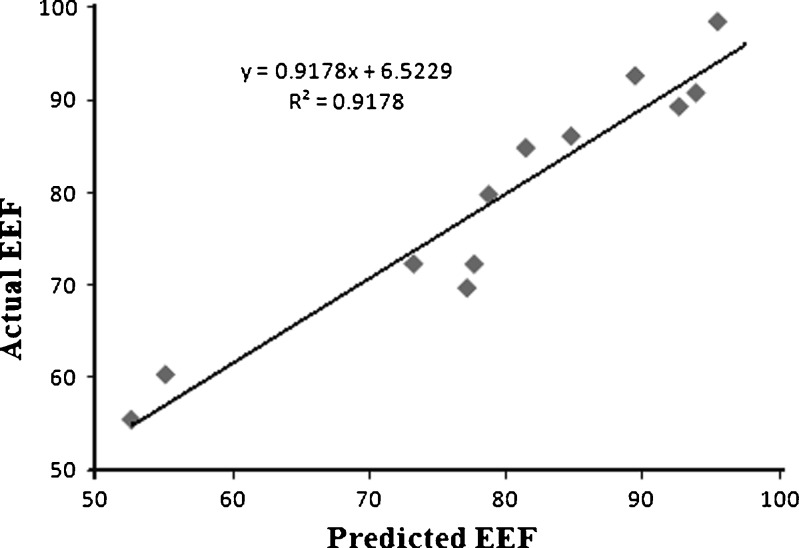
Pareto ranking analysis (Fig. 2) showed that the amount of drug (X1) was the most significant factor controlling the EE, followed by the organic to aqueous phase volume ratio (X5) and the type of organic solvent (X6), as depicted by the length of the bars and their p values being less than the a priori value of 0.05. Other factors such as polymer loading (X2), stirring rate (X3), emulsifier concentration (X4), and homogenization time (X7) also affected EE but their effects were not statistically significant (p > 0.05). A quantile–quantile plot showed a linear correlation between the observed and predicted values of the EE with R2 = 0.92 (Fig. 3). Further analysis by ANOVA confirmed that the model was statistically significant in its prediction of EE (Prob > F = 0.0463). The Prob > F is the observed significance probability (p value) of obtaining a greater F value by chance alone if the specified model fits no better than the overall mean response.
Fig. 2.
Pareto chart showing independent variables and their estimates of effect on EE. The length of the bar shows the order of effect of the factors on EE while the negative sign shows an inverse relationship between the factor and EE
Fig. 3.
Plot of actual EE against predicted EE determined by RP-HPLC analysis
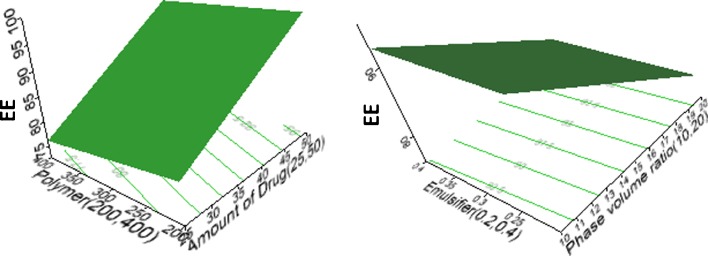
The main effects of the independent variables on EE could also be explained using three-dimensional surface and contour plots (Fig. 4). It could be observed that increasing the amount of drug (X1) from 25 to 50 mg resulted in an increase in the EE. This was because an increase in the amount of drug resulted in a more viscous dispersed phase, leading to increased coalescence of the nanodroplets. This gave rise to nanoparticles with increased sizes and higher EE since more drug was available for encapsulation (14,16).
Fig. 4.
Three-dimensional response surface plots showing the main effects of drug loading, polymer loading, emulsifier concentration, and phase volume ratio on EE
An increase in the organic to aqueous phase volume ratio (X5) resulted in nanoparticles with significantly low EE (p < 0.05) because it led to a corresponding decrease in the viscosity of the medium. The increased volume and decreased viscosity caused more drug molecules to partition into the aqueous phase from the organic phase during the emulsification and solvent evaporation steps, resulting in less drug retention in the polymer matrix and a decrease in the EE (16).
NIR Spectroscopy
Generally, NIR spectra of solid powdered samples recorded in the reflectance mode are affected by variations within spectral groups due to varying particle size distributions (19). These variations result in dissimilar packing densities, intensity differences, light scattering effects, path length variations, and ultimately baseline shifts in the spectra (20). Instrumental effects such as random noise, changes in lamp intensity, and detector response may also cause variations within spectral groups and can adversely affect the robustness and reliability of the multivariate calibration model to be developed (5,20). In an attempt to eliminate, reduce, or standardize the effects of these variations on our multivariate model, we applied three different preprocessing methods, namely multiplicative scatter correction, standard normal variate, and Savitzky–Golay second derivative transformation with third-order polynomial using 7 filter points, to study the influence each pretreatment method on the robustness of our regression model.
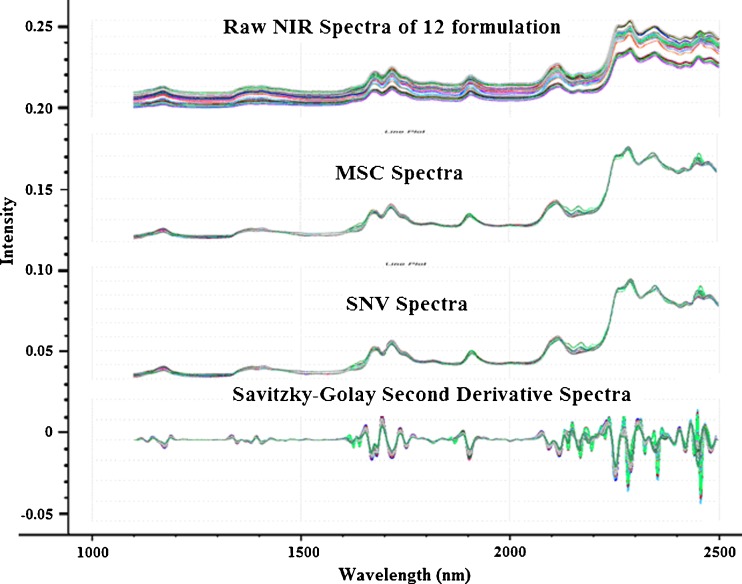
It was observed that spectra for both MSC and SNV looked similar in shape (Fig. 5). Compared to the original spectra, both MSC and SNV were able to remove a large part of the variance between the spectra without distorting the spectral features. This observation has been reported by other authors that MSC- and SNV-transformed spectra are closely related and that the difference in prediction ability between the two pretreatment methods is very small (21,22). Both MSC and SNV are normalization methods that effectively minimize or eliminate variations due to path length and baseline offsets, thus improving the linearity of the relationship between the constituents and the spectral values. MSC gives an estimation of the relation of the scatter of each sample with respect to the scatter of a mean spectrum which is calculated from all the spectra in a defined data set by a least squares regression. Using this mean spectrum, the same least squares regression is performed on every spectrum to minimize the variations due to amplified or additive effects (20). SNV, on the other hand, is a row-oriented correction method which corrects for each individual spectrum at each wavelength. Each spectrum is mean centered and divided by its standard deviation, so that the new spectra are centered in zero and their standard deviations are one, with a common scale for all spectra (23).
Fig. 5.
Raw NIR absorbance spectra, MSC-treated, SNV-treated, and Savitzky–Golay second derivative-treated spectra of the 12 formulations of PB design. MSC and SNV pretreatment resulted in the removal of a large part of the variance among spectra without distorting the spectral features. Second derivative transformation on the other hand, introduced peaks and troughs leading to enhanced spectral resolution
For the Savitzky–Golay second derivative-treated spectra, it was observed that spectral peak and troughs were more prominent than the original, untreated spectra and were also different from SNV- and MSC-treated spectra. Savitzky–Golay second derivative transformation with third-order polynomial applied smoothing and differentiation to the spectra to reduce random noise and enhance spectral resolution. This resulted in peaks which were sharp and not overlapping.
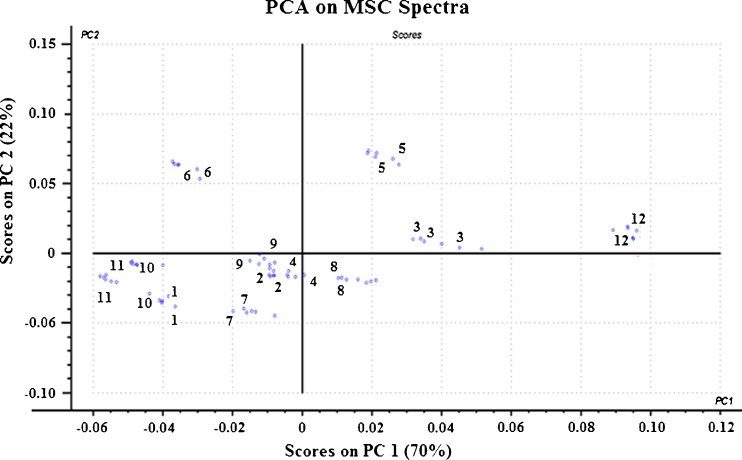
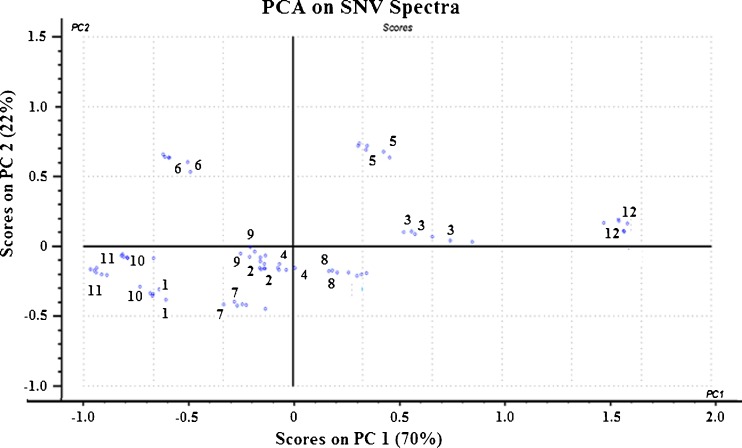
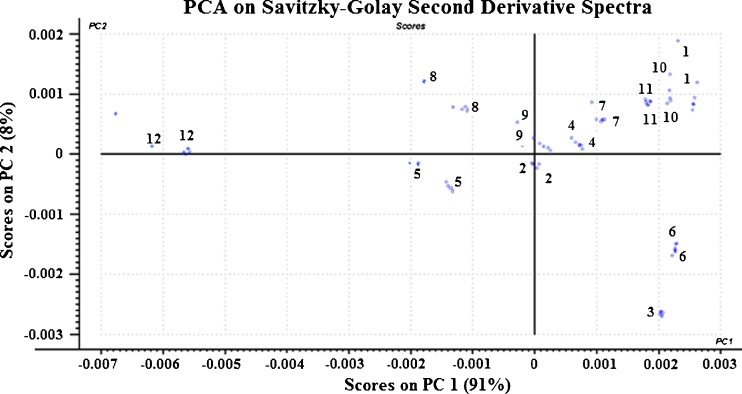
Principal component analysis (PCA) was then carried out on each of the pretreated spectra. Figures 6, 7, and 8 show the score plots of the second principal component (PC 2) against the first principal component (PC 1) for the pretreated spectra. It was observed that for both MSC-corrected and SNV-corrected spectra, PC 1 and PC 2 accounted for 92 % of the total variance in the data, with PC 3 accounting for the remaining 8 %.
Fig. 6.
Principal component analysis score plot of PC1 against PC2 for MSC-treated NIR spectra showed a clear pattern of clusters along PC 1 axis. From left to right, the order of the sequence coincided with an increasing order of drug loading in the nanoparticle as determined by RP-HPLC. This shows that PC 1 correlates with the amount of drug while PC 2 explains the variance in the PLGA content
Fig. 7.
Principal component analysis score plot of PC1 against PC2 for SNV-treated NIR spectra showed a clear pattern of clusters along PC 1 axis. From left to right, the order off the sequence coincided with an increasing order of drug loading in the nanoparticle as determined by RP-HPLC. This shows that PC 1 correlates with the amount of drug while PC 2 explains the variance in the PLGA content
Fig. 8.
Principal component analysis score plot for PC1 and PC2 for Savitzky–Golay second derivative-transformed NIR spectra. Second derivative transformation resulted in the splitting of overlapping peaks and the introduction of peaks and troughs. As a result, there were no clear pattern of clusters along the PC 1 axis
The MSC- and SNV-treated score plots showed clear patterns of clusters along the PC 1 axes. From left to right, the sequence of the score plot was formulation 11, 10, 1, 6, 7, 9, 2, 4, 8, 5, 3, and 12. This sequence coincided with increasing order of letrozole content and decreasing order of PLGA in the formulation as determined by the destructive RP-HPLC method (Table II). Thus, it could be inferred from these score plots that PC1, which explained 70 % of the total variance, primarily correlated with the amount of letrozole within the nanoparticles while PC 2, which explained 22 % of the total variance, correlated with the amount of PLGA in the nanoparticles.
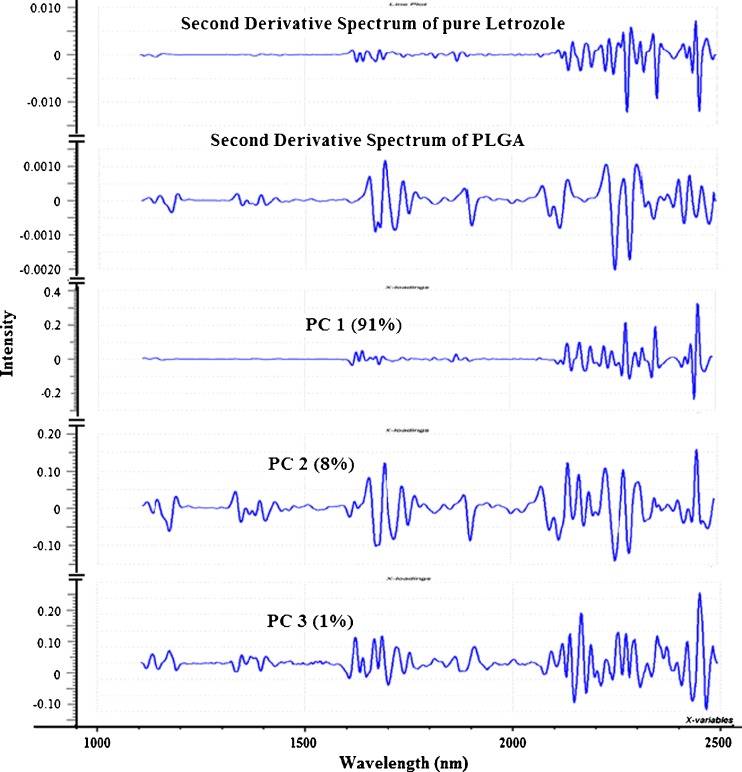
For spectra that were treated with third-order polynomial Savitzky–Golay second derivative with 7 filter points, a look at the score plot (Fig. 8) showed no clear pattern even though PC 1 and PC 2 accounted for 99 % of the data variance. Moreover, the scores along both PC 1 and PC 2 axes were very small compared with the scores from the SNV- and MSC-treated spectra. It is reported that derivatization generally results in splitting of overlapping peaks and results in decrease in sensitivity due to the introduction of new spectral peaks (21). However, examination of the loading plots for the Savitzky–Golay second derivative-transformed spectra (Fig. 9) showed that for PC1, there were no prominent peaks between 1,100 and 1,600 nm while PC2 and PC 3 showed both positive and negative peaks between 1,100 and 1,600 nm. By comparing these three loadings with the second derivative spectra of pure letrozole and PLGA, the following assignments could be made: PC1 loading vector showed peaks at 1,624, 1,640, 1,868, 2,138, 2,170, 2,280, and 2,456 nm which could be attributed to the letrozole component of the nanoparticulate system while PC 2 showed peaks at 1,172, 1,332, 1,654, 1,694, 2,138, 2,228, 2,272, and 2,450 nm which could be attributed to the PLGA component of the system. This showed that PC1 correlated with the amount of letrozole in the nanoparticles while PC 2 correlated with the PLGA content.
Fig. 9.
Principal component loading vectors of the three principal components and second derivative spectra of the pure components. The spectrum of PC 1, which accounted for 91 % of the total variance was similar to the spectrum of pure letrozole while PC 2, which accounted for 8 % of the total variance was similar to the spectrum of PLGA. PC 3, which accounted for 1 % of the total variance had a spectrum which was not similar to spectra of both letrozole and PLGA and may be due to variation in other physical properties such as particle size, intensity differences, or differences in packing densities
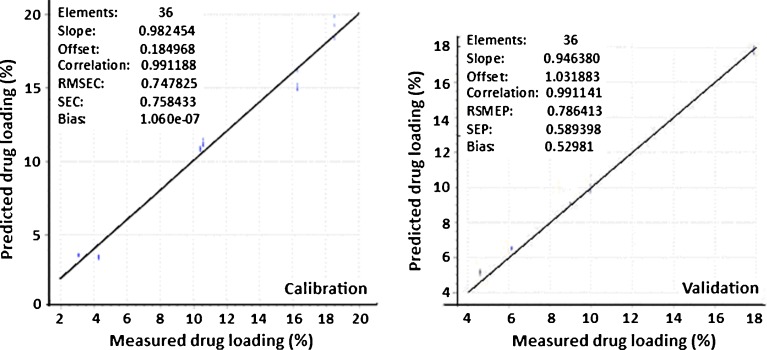
To quantitatively predict the drug content in the nanoparticulate system, the influence of two standard regression methods, PCR and PLS regression, on the pretreated samples were also examined. These two regression methods were selected because they are the most commonly used regression methods and have been found to be very accurate in terms of model prediction (23). Tables III and IV show the results of the PCR and PLS regressions for the different pretreatment methods. In both PCR and PLS regression, spectra that were pretreated using Savitzky–Golay second derivative gave the best predictive ability based on the correlation coefficients, RMSEC, RMSEP, SEC, and SEP values for both calibration and prediction models. Thus, spectral pretreatment with Savitzky–Golay second derivative transformation was the best method in effectively minimizing the variations in the raw spectra of letrozole-loaded nanoparticles. PLS models for the Savitzky–Golay second derivative-transformed spectra showed better prediction ability than the corresponding PCR model as depicted by higher correlation coefficients (0.991 for both calibration and prediction models for PLS compared with 0.988 and 0.990 for calibration and prediction for PCR), lower root mean square errors of calibration and prediction (RMSEC and RMSEP) and lower standard errors of calibration and prediction (SEC and SEP; Tables III and IV). Moreover, there was a smaller difference between RMSEC and RMSEP for the PLS models pretreated with Savitzky–Golay second derivative transformation (RMSEC = 0.747 %; RMSEP = 0.786 %) compared with the RMSEC and RMSEP for the PCR models pretreated with the same method (RMSEC = 0.849 %; RMSEP = 0.740 %). It is reported that multivariate models that result in big differences between RMSEC and RMSEP usually yield prediction models that are not very robust and may fail when tested with an independent validation set (18). Figure 10 shows the relationship between the actual and predicted drug loadings for the PLS calibration and validation models that were pretreated by the Savitzky–Golay second derivative transformation. Very low RMSEC and RMSEP (0.747 and 0.786 %), SEC and SEP (0.758 and 0.589 %) and high calibration and prediction correlation coefficients between measured and predicted drug loadings indicate that NIR spectroscopy has good predictive potential for drug loading in nanoparticles.
Table III.
Principal Component Regression of MSC, SNV, and Savitzky–Golay Second Derivative-Transformed NIR Spectra for Calibration and Prediction of Letrozole and PLGA
| MSC | SNV | Savitzky–Golay | ||||
|---|---|---|---|---|---|---|
| Calibration | Prediction | Calibration | Prediction | Calibration | Prediction | |
| Samples | 36 | 36 | 36 | 36 | 36 | 36 |
| Slope | 0.957412 | 0.82900 | 0.957483 | 0.828827 | 0.977374 | 0.964158 |
| Offset | 0.448953 | 1.93057 | 0.448200 | 1.932293 | 0.238517 | 0.777366 |
| Correlation | 0.978474 | 0.96485 | 0.978511 | 0.964810 | 0.988622 | 0.990186 |
| RMSE | 1.165071 | 1.24002 | 1.164094 | 1.240839 | 0.849203 | 0.740259 |
| SEC/SEP | 1.181598 | 1.21242 | 1.180607 | 1.213250 | 0.861249 | 0.602415 |
| Bias | 1.325e-07 | 0.329 | 9.272e-08 | 0.329539 | −1.457e-07 | 0.441769 |
Second derivative transformation showed lower RMSE, SEC, SEP, and a higher correlation coefficient than MSC and SNV-treated spectra
Table IV.
PLS Regression of MSC, SNV, and Savitzky–Golay Second Derivative-Transformed NIR Spectra for Calibration and Prediction of Letrozole and PLGA
| MSC | SNV | Savitzky–Golay | ||||
|---|---|---|---|---|---|---|
| Calibration | Prediction | Calibration | Prediction | Calibration | Prediction | |
| Samples | 36 | 36 | 36 | 36 | 36 | 36 |
| Slope | 0.963228 | 0.85399 | 0.963367 | 0.853988 | 0.982424 | 0.946380 |
| Offset | 0.387639 | 1.793364 | 0.386178 | 1.793643 | 0.184968 | 1.031883 |
| Correlation | 0.981442 | 0.949768 | 0.981512 | 0.949710 | 0.991188 | 0.991141 |
| RMSE | 1.082594 | 1.404363 | 1.080552 | 1.405067 | 0.747825 | 0.786413 |
| SEC/SEP | 1.097950 | 1.357095 | 1.095880 | 1.357768 | 0.758433 | 0.589398 |
| Bias | 2.649e-08 | 0.426249 | 5.298e-08 | 0.426484 | 1.060e-07 | 0.529817 |
Second derivative transformation showed lower RMSE, SEC, SEP, and a higher correlation coefficient than MSC and SNV-treated spectra
Fig. 10.
Calibration and validation plots of measured versus predicted drug loading for spectra pretreated by Savitzky–Golay second derivative transformation. Very low RMSEC and RMSEP; SEC and SEP and high calibration and prediction correlation coefficients between measured and predicted drug loadings indicate that NIR spectroscopy has good predictive potential for drug loading of nanoparticles
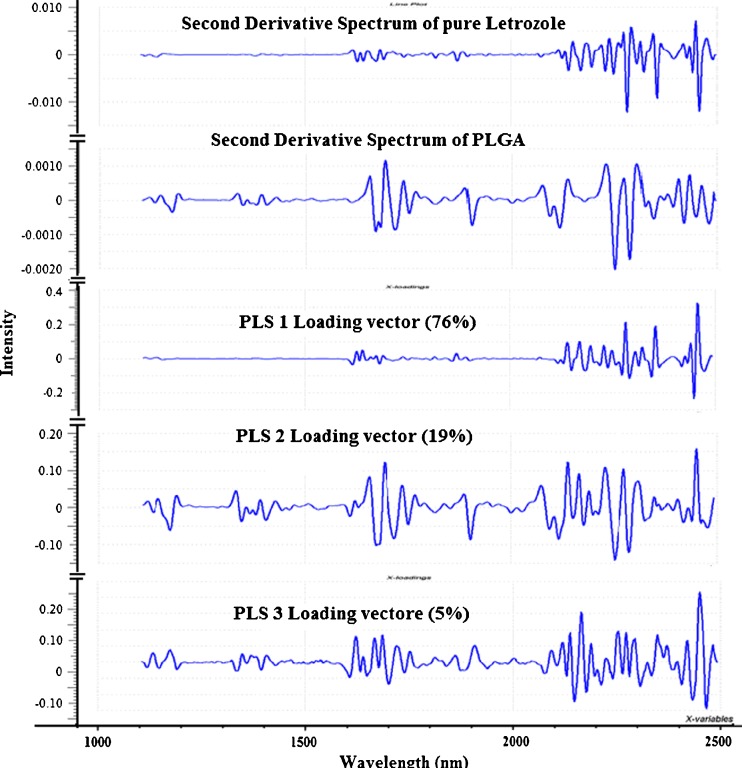
The difference between PLS regression and PCR is that in PCR, the three principal components were derived from principal component analysis and were used to perform regression on the drug loading whereas in PLS regression, the PLS components or latents variables were derived by comparing both spectral and target property information to find the direction of greatest variability (5). In other words, whereas in PCR, we knew from PCA that the first principal component (PC 1) which represented the largest variation in the spectra correlated with the amount of letrozole in the nanoparticulate system, in PLS regression, the first PLS component represented the most relevant variations showing the best correlation with the drug loading in the system. The first two PLS factors, PLS 1 and PLS 2, for the Savitzky–Golay second derivative-transformed spectra explained 76 and 19 %, respectively, of the total variance in the spectra while PLS 3 accounted for 5 % of the variance.
Spectral and chemical information contained in the PLS model were estimated by correlating the PLS loading vectors with the second derivative spectra of the individual components of the nanoparticulate system (Fig. 11). PLS 1 loading vector showed effective smoothing with no peaks between 1,100–1,600 nm but showed positive and negative peaks at 1,624, 1,640, 1,868, 2,138, 2,170, 2,280, and 2,456 nm which could be attributed to the letrozole component of the system while PLS 2 showed peaks at 1,172, 1,332, 1,654, 1,694, 2,138, 2,228, 2,272, and 2,450 nm corresponding to the PLGA component of the system. PLS 3 may be due to physical variations such as differences in particle size distribution.
Fig. 11.
Loading vectors of the PLS factors and second derivative spectra of letrozole and PLGA. The spectrum of PLS 1, which accounted for 76 % of the total variance was similar to the spectrum of pure letrozole while PLS 2, which accounted for 19 % of the total variance was similar to the spectrum of PLGA. PC 3, which accounted for 5 % of the total variance had a spectrum which was not similar to spectra of both letrozole and PLGA and may be due to variation in other physical properties such as particle size, intensity differences, or differences in packing densities
Near-Infrared Chemical Imaging
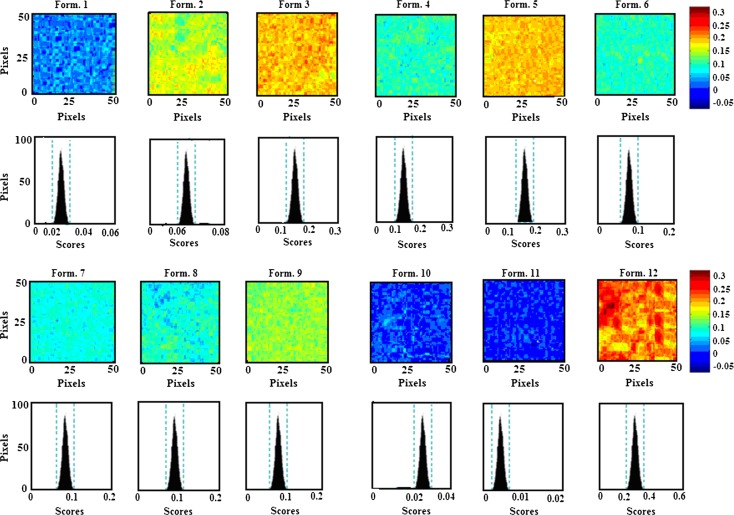
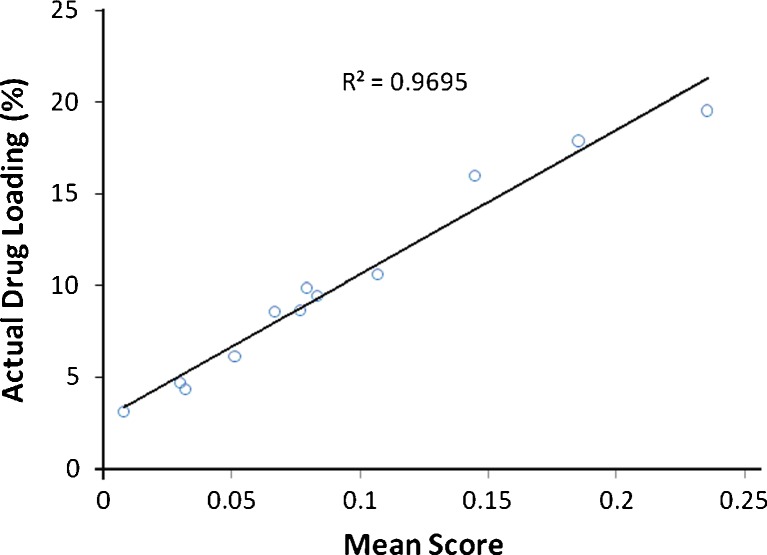
Whereas NIR spectroscopy alone is limited in its ability to evaluate drug product homogeneity, chemical imaging combines the chemical selectivity of NIR spectroscopy with the power of image visualization to characterize quantitatively the spatial distribution of the components comprising pharmaceutical samples (24). NIR-CI therefore provides the opportunity to investigate localized micro-domains of ingredients within a given sample. In this regard, NIR-CI was employed to characterize quantitatively the spatial distribution of letrozole and PLGA within the 12 formulations. The raw hyperspectral datacubes obtained were preprocessed prior to multivariate regression to reduce or eliminate non-chemical biases such as scattering effects due to surface heterogeneity, interference from external light sources, and random noise, from the spectral information (6,24). Preprocessing methods used were MSC, SNV, and third-order polynomial Savitzky–Golay second derivative transformation. As with NIR spectroscopy, the preprocessing method that gave the best way of visualizing groups in the data unambiguously was Savitzky–Golay second derivative transformation with third-order polynomial using seven filter points. A PLS regression was then performed on the data set. To visualize the spatial distribution of the components within the formulations, a library was built from the pure component spectra with class 1 representing letrozole and class 2 representing PLGA. PLS images of the 12 formulations were then concatenated according to the first class in the library and color mapping with intensity scaling was used to display the compositional contrast between pixels in the images (Fig. 12).The spectral absorbance for each pixel was then decomposed into score values with the highest score and highest intensity representing the highest drug loading. The corresponding histograms showed symmetrical distribution of the components in the nanoparticulate system. Table V shows the mean scores and skewness of the histograms generated by the PLS images. The formulations can be arranged based on a visual examination of the 12 PLS images and also according to their mean scores, in order of decreasing drug contents as formulation 12 > 3 > 5 > 4 > 6 ≥ 8 ≥ 9 ≥ 2 > 7 > 10 > 1 > 11. To assess the validity of the model to effectively assess the drug loading in the nanoparticulate system, a quantile–quantile plot was constructed for the actual drug loading and the mean score of the PLS images (Fig. 13). A good correlation with a coefficient of 0.9695 was obtained, showing that NIR-CI can be used to nondestructively predict the drug loading within PLGA nanoparticles.
Fig. 12.
PLS images and associated histograms of the 12 formulations. The same scale (on right) is used for all images, with the highest intensity of 0.3 representing letrozole and the lowest intensity of −0.05 representing PLGA. The images show formulation 12 with the highest drug loading while formulation 11 had the lowest drug loading. The color codes based on the scale for the formulations are in agreement with the order of drug loading determined by RP-HPLC
Table V.
PLS Histogram Distribution from PLS Score Images of the 12 Formulations
| Formulation | Mean score (±SD) | Skew | Number of pixels |
|---|---|---|---|
| 1 | 0.0296 ± 0.030 | 0.06322 | 2,490 |
| 2 | 0.0765 ± 0.0377 | −0.0580 | 2,488 |
| 3 | 0.1451 ± 0.03263 | −0.0020 | 2,492 |
| 4 | 0.1069 ± 0.03283 | −0.5810 | 2,492 |
| 5 | 0.1149 ± 0.0200 | −0.0991 | 2,492 |
| 6 | 0.0833 ± 0.0200 | 0.0062 | 2,490 |
| 7 | 0.05113 ± 0.0238 | −0.00201 | 2,490 |
| 8 | 0.07903 ± 0.03199 | −0.0664 | 2,488 |
| 9 | 0.07676 ± 0.03192 | −0.02008 | 2,495 |
| 10 | 0.03186 ± 0.02487 | 0.1577 | 2,482 |
| 11 | 0.0076 ± 0.03166 | −0.111 | 2,489 |
| 12 | 0.2151 ± 0.0386 | −0.0101 | 2,490 |
Formulation 12 had the highest mean score while formulation 11 had the lowest mean score. The order of the mean score from PLS is in agreement with the order of drug loading determined by RP-HPLC
Fig. 13.
Plot of actual drug loading versus PLS mean scores of the image intensities. A high coefficient of determination shows linearity between the actual drug loading determined by RP-HPLC and the images by NIR-CI
CONCLUSION
A Plackett–Burman design of experiment was applied to evaluate the main effects of formulation variables on the entrapment efficiency of letrozole-loaded nanoparticles prepared by the emulsification–solvent evaporation method. Statistical analyses and Pareto ranking analysis showed that the factors that had significant main effects on the drug loading of the prepared nanoparticles were the amount of drug, the phase volume ratio and type of organic solvent. A destructive RP-HPLC method was applied to determine the drug loading in the nanoparticles and this was compared with non-destructive methods namely NIR spectroscopy and NIR chemical imaging. The results obtained from the non-destructive methods were in agreement with the RP-HPLC reference analysis method. Our study shows that as rapid, nondestructive, and non-invasive techniques, NIR and NIR-CI could provide the possibility for real-time process control and quality assurance, leading to significant improvement over conventional analytical methods.
REFERENCES
- 1.Cohen MH, Johnson JR, Li N, Chen G, Pazdur R. Approval summary: letrozole in the treatment of postmenopausal women with advanced breast cancer. Clin Cancer Res. 2002;8(3):665–669. [PubMed] [Google Scholar]
- 2.Chen D, Reierstad S, Lu M, Lin Z, Ishikawa H, Bulun SE. Regulation of breast cancer-associated aromatase promoters. Cancer Lett. 2009;273:15–27. doi: 10.1016/j.canlet.2008.05.038. [DOI] [PubMed] [Google Scholar]
- 3.Bai JL, Wu H, Lui J, Guo G, Chen J. Paclitaxel-loaded poly(d, l-lactide-co-glycolide) nanoparticles for radiotherapy in hypoxic human tumor cells in vitro. Cancer Biol Ther. 2008;7:911–916. doi: 10.4161/cbt.7.6.5912. [DOI] [PubMed] [Google Scholar]
- 4.Nair LS, Laurencin CT. Biodegradable polymers as biomaterials. Prog Polym Sci. 2007;32:762–798. doi: 10.1016/j.progpolymsci.2007.05.017. [DOI] [Google Scholar]
- 5.Reich G. Near-infrared spectroscopy and imaging: basic principles and pharmaceutical applications. Adv Drug Deliv Rev. 2005;57:1109–1143. doi: 10.1016/j.addr.2005.01.020. [DOI] [PubMed] [Google Scholar]
- 6.Gowen AA, O’Donnell CP, Cullen PJ, Bell SEJ. Recent applications of chemical imaging to pharmaceutical process monitoring and quality control. Eur J Pharm Biopharm. 2008;69:10–22. doi: 10.1016/j.ejpb.2007.10.013. [DOI] [PubMed] [Google Scholar]
- 7.Guidance for Industry: PAT—a framework for innovative pharmaceutical development, manufacturing and quality assurance. http://www.fda.gov/downloads/Drugs/GuidanceComplianceRegulatoryInformation/Guidances/UCM070305.pdf. Last accessed, October 5, 2011.
- 8.Herkert T, Prinz H, Kovar KA. One hundred percent online identity check of pharmaceutical products by near-infrared spectroscopy on the packaging line. Eur J Pharm Biopharm. 2005;51:9–16. doi: 10.1016/S0939-6411(00)00126-0. [DOI] [PubMed] [Google Scholar]
- 9.Zidan AS, Rahman Z, Habib MJ, Khan MA. Spectral and spatial characterization of protein loaded PLGA nanoparticles. J Pharm Sci. 2009;99(3):1180–1192. doi: 10.1002/jps.21928. [DOI] [PMC free article] [PubMed] [Google Scholar]
- 10.Chalus P, Roggo Y, Walter S, Ulmschneider M. Near-infrared determination of active substance content in intact low-dosage tablets. Talanta. 2005;66:1294–1302. doi: 10.1016/j.talanta.2005.01.051. [DOI] [PubMed] [Google Scholar]
- 11.Camacho W, Valles-Lluch A, Ribes-Greus A, Karlsson S. Determination of moisture content in nylon 6,6 by near infrared spectroscopy and chemometrics. J Appl Polym Sci. 2003;87(13):2165–2170. doi: 10.1002/app.11595. [DOI] [Google Scholar]
- 12.Plackett RL, Burman JP. The design of optimum multifactorial experiments. Biometrika. 1946;33:305–325. doi: 10.1093/biomet/33.4.305. [DOI] [Google Scholar]
- 13.Sastry SV, Khan MA. Aqueous based polymeric dispersion: Placket–Burman design for screening of formulation variables of atenolol gastrointestinal therapeutic system. Pharm Acta Helv. 1998;73(2):105–112. doi: 10.1016/S0031-6865(97)00052-6. [DOI] [PubMed] [Google Scholar]
- 14.Mainardes RM, Evangelista RC. PLGA nanoparticles containing praziquantel: effect of formulation variables on size distribution. Int J Pharm. 2005;290:137–144. doi: 10.1016/j.ijpharm.2004.11.027. [DOI] [PubMed] [Google Scholar]
- 15.Rahman Z, Zidan AS, Habib MJ, Khan MA. Understanding the quality of protein loaded PLGA nanoparticles variability by the Plackett–Burman design. Int J Pharm. 2010;389(1–2):186–194. doi: 10.1016/j.ijpharm.2009.12.040. [DOI] [PMC free article] [PubMed] [Google Scholar]
- 16.Quintanar-Guerrero D, Fessi H, Allemann E, Doelker E. Influence of stabilizing agents and preparatives variables on the formation of poly (d, l-lactic acid) nanoparticles by an emulsification-diffusion technique. Int J Pharm. 1996;143:133–141. doi: 10.1016/S0378-5173(96)04697-2. [DOI] [Google Scholar]
- 17.International Conference on Harmonization (ICH) Guidelines for Industry, ICH Q2(R1), Validation of Analytical Procedures, Methodology, 2005.
- 18.Lammertyn J, Nicolay B, Ooms K, DeSemedt V, De Baerdemaeker J. Non- destructive measurement of acidity, soluble solids and firmness of Jonagold apples using NIR-spectroscopy. Trans ASAE. 1998;41(4):1089–1094. [Google Scholar]
- 19.Roggo Y, Chalus P, Maurer L, Lema-Martinez C, Edmond A, Jent N. A review of near infrared spectroscopy and chemometrics in pharmaceutical technology. J Pharm Biomed Anal. 2007;44:683–700. doi: 10.1016/j.jpba.2007.03.023. [DOI] [PubMed] [Google Scholar]
- 20.Pizarro C, Esteban-Diez I, Nistal AJ, Gonzalez-Saiz JM. Influence of data pre-processing on the quantitative determination of the ash content and lipids in roasted coffee by near infrared spectroscopy. Anal Chim Acta. 2004;509:217–227. doi: 10.1016/j.aca.2003.11.008. [DOI] [Google Scholar]
- 21.Azzouz T, Puigdoménech A, Aragay M, Tauler R. Comparison between different data pre-treatment methods in the analysis of forage samples using near-infrared diffuse reflectance spectroscopy and partial least-squares multivariate calibration method. Anal Chim Acta. 2003;484:121–134. doi: 10.1016/S0003-2670(03)00308-8. [DOI] [Google Scholar]
- 22.Dhanoa MS, Lister SJ, Sanderson R, Barnes RJ. The link between multiplicative scatter correction (MSC) and standard normal variate (SNV) transformations of NIR spectra. J Near Infrared Spectrosc. 1994;2:43–47. doi: 10.1255/jnirs.30. [DOI] [Google Scholar]
- 23.Barnes RJ, Dhanoa MS, Lister SJ. Standard normal variate transformation and de-trending of near-infrared diffuse reflectance spectra. Appl Spectrosc. 1989;43(5):772–777. doi: 10.1366/0003702894202201. [DOI] [Google Scholar]
- 24.Ravn C, Skibsted E, Bro R. Near-infrared chemical imaging (NIR-CI) on pharmaceutical solid dosage forms-comparing common calibration approaches. J Pharm Biomed Anal. 2008;48:554–556. doi: 10.1016/j.jpba.2008.07.019. [DOI] [PubMed] [Google Scholar]


