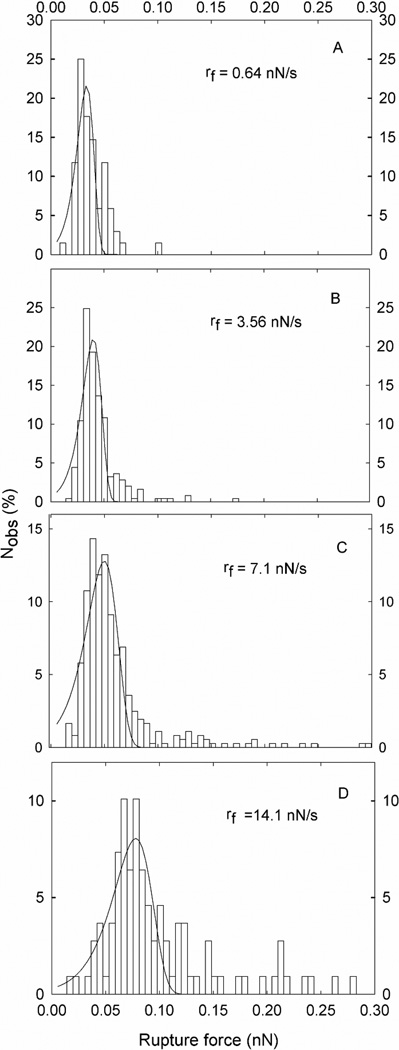
Figure 4.
Tn-PSM self-interactions. Histograms based on the observed unbinding forces within each subgroup of observations grouped based on defined intervals of loading rate. For each histogram, the average loading rate valid for the observations is indicated. Fitting Eq. 4 to the experimental data allows determination of the parameters xβ, koff, and f*. The fitted curves are overlaid on the distributions presented.

