Abstract
This paper describes methods that provide pre-requisite information for computing circumferential stress in modulus elastograms recovered from vascular tissue—information that could help cardiologists detect life-threatening plaques and predict their propensity to rupture. The modulus recovery process is an ill-posed problem; therefore additional information is needed to provide useful elastograms. In this work, prior geometrical information was used to impose hard or soft constraints on the reconstruction process. We conducted simulation and phantom studies to evaluate and compare modulus elastograms computed with soft and hard constraints versus those computed without any prior information. The results revealed that (1) the contrast-to-noise ratio of modulus elastograms achieved using the soft prior and hard prior reconstruction methods exceeded those computed without any prior information; (2) the soft prior and hard prior reconstruction methods could tolerate up to 8 % measurement noise; and (3) the performance of soft and hard prior modulus elastogram degraded when incomplete spatial priors were employed. This work demonstrates that including spatial priors in the reconstruction process should improve the performance of model-based elastography, and the soft prior approach should enhance the robustness of the reconstruction process to errors in the geometrical information.
1. Introduction
An imaging modality that could visualize circumferential stress would help cardiologists detect life-threatening plaques more promptly. Coronary atherosclerosis kills over 500,000 Americans each year (Fuster et al., 1990; Moreno et al., 1994; Virmani et al., 2002). These deaths occur when a life-threatening plaque ruptures (Falk, 2006; Kubo et al., 2007) in the later stages of the disease. Life-threatening plaques typically have a thin fibrous cap (< 200 μm), a large lipid pool, and chronic inflammation (Naghavi et al., 2001); and they are difficult to detect because (1) atherosclerosis is asymptomatic, and (2) coronary angiography, the current “gold standard” used to assess the severity of coronary disease in symptomatic patients, can only visualize the lumen (Fujii et al., 2005). Furthermore, the media/adventitia expands outwardly as the plaque grows, and a significant amount of plaque (>40% of the cross-sectional lumen area) is typically present before it is detected by angiography (Glagov et al., 1987). Since the fibrous cap of an atherosclerotic plaque may rupture when circumferential stress exceeds 300 kPa (Lendon et al., 1991; Loree et al., 1992), an imaging modality that could visualize circumferential stress might be used to detect plaques and predict their propensity to rupture.
Model-based elastography could provide the computational framework for visualizing circumferential stress and thus detecting plaques. Intravascular ultrasound (IVUS) provides real-time, two-dimensional cross-sectional images of the arterial wall (Gorge et al., 1998; Ge et al., 1999; Hoffmann et al., 1999; Larsen et al., 2002) that accurately depict plaque morphology (Vink and Pasterkamp, 2002). However, IVUS cannot quantify the mechanical properties of vascular tissues (de Korte et al., 2000; de Korte et al., 2002; Maurice et al., 2008). Intravascular ultrasound elastography (IVUSe) is an emerging IVUS method that visualizes the radial strain within vascular tissues (de Korte et al. (1997)) that relates to mechanical properties. Radial strain elastogram images could help cardiologists identify life-threatening plaques (Liang et al., 2009; Schaar et al., 2001), but such technology is unlikely to predict the propensity of a plaque to rupture. To achieve this goal, researchers have to develop IVUSe on a more rigorous theoretical framework— one built on continuum mechanics— to make reasonable estimates of the circumferential stress within the fibrous cap.
To visualize circumferential stress, there must be reliable estimates of the mechanical properties within vascular tissues. Circumferential stress depends on three factors, all of which must be estimated accurately: the intra-coronary pressure, the shear stress (induced by blood flow), and the mechanical properties (shear modulus) of the fibrous cap and surrounding vessel. In the catherization laboratory, a pressure catheter is routinely used to measure the intra-coronary pressure (Khouzam, 2008). Similarly, laser Doppler techniques or computational fluid dynamics have been used to measure flow shear stress (Friedman et al., 1992). Model-based inversion schemes have been used to obtain relative estimates of Young's modulus (Wan et al., 2001; Khalil et al., 2006; Baldewsing et al., 2006; Le Floc'h et al., 2009). This paper focuses on visualizing the mechanical properties within vascular tissues that can be realized by solving the ill-posed inverse elasticity problem (Hardamar, 1952), which is challenging. For instance, Barbone and Bamber (2002) showed theoretically that solving the inverse elasticity problem using one displacement field would not produce unique modulus elastograms — and could yield either erroneous modulus elastograms or produce significant image artifacts. To minimize this difficulty, Barbone and Bamber (2002) recommended that modulus elastograms should be reconstructed with multiple independent displacement fields. Although this strategy would be feasible for breast elastography, it is certainly not a viable approach for intravascular elastography. An alternate approach is to include a priori information in the modulus recovery process (Doyley et al., 2006), which may yield an approximate estimate of the mechanical properties of the underlying tissue or prior anatomical information (spatial priors).
Using spatial priors to improve the performance of inverse reconstruction methods is not a novel concept. Khalil et al. (2006) used spatial priors, obtained from optical coherence tomography images, to reduce the number of parameters in their reconstruction method. In this paper, such a method is referred to as imposing hard constraints on the reconstruction problem. Baldewsing et al. (2006) used spatial priors to impose hard constraints on their reconstruction method; however, they used deformable curves to extract structural information from strain elastograms. Le Floc'h et al. (2009) employed spatial priors in their reconstruction technique by segmenting radial strain elastograms. Since the segmentation of congruent features always includes classification errors this method could introduce artifacts. To overcome such a potential issue, this paper describes methods that we have developed to use spatial priors to impose soft constraints on the reconstruction process. This paper also reports the results of studies conducted using simulated and physical vessel phantoms to evaluate the relative merits of constraining the image-reconstruction process with hard and soft spatial priors. In the simulation studies, spatial priors were derived from known modulus distributions, but in the phantom studies, they were derived from manually segmented IVUS sonograms. The contrast-transfer-efficiency (CTE), contrast-to-noise ratio (CNR), and the root mean squared error (RMS) metrics were used to evaluate the performance of all modulus elastograms. The results reported in the paper demonstrate that modulus elastograms computed by imposing soft constraints are generally better than those produced using hard constraints.
2. Methods
2.1 No prior reconstruction method
We modeled vascular tissue as an isotropic, nearly incompressible (ν = 0.495), linear elastic material. The governing equation that describes the resulting deformation is given by:
| (1) |
where u represents the tissue displacement vector field, μ and λ are the Lamé constants, and p represents the internal hydrostatic pressure. Lamé constants (i.e., λ and μ) are related to traditional engineering constants, such as Young's modulus (E) and Poisson's ratio (v), as follows (Timoshenko and Goodier, 1970; Fung, 1981):
| (2) |
Shear modulus (μ) was reconstructed from ultrasonically measured radial displacements using the finite element (FE) method and a quasi-Newton iterative method. This approach to modulus estimation has previously been described (Oberai et al., 2004; Oberai et al., 2003; Richards et al., 2009); therefore, only a brief summary of the technique is provided in this section. The reconstruction process consists of minimizing the following cost function:
| (3) |
where urmes is the measured radial component of displacement; ur is the radial component of displacement, computed from the shear modulus distribution μ using a finite-element representation of equation (1); μ0 is a constant modulus for each region that was computed as part of the reconstruction process; and πR is a regularization function. The image-reconstruction problem is typically constrained (minimally) by applying a constant regularization function to all pixels in the reconstruction field of view. This constraint is not ideal, because the magnitude of the regularization is noticeably higher when the plaque is stiffer than the vessel wall (positive contrast plaque) compared to when the plaque is softer than then the vessel wall (negative contrast). This behavior could pose a problem when reconstructing the mechanical properties of lipid-rich plaques that are typically softer than the surrounding vessel. Consequently, a logarithmic regularization function was used to remove the dependence of the regularization on modulus contrast. The logarithmic regularization function, c(μ, μ0), that was employed in no prior and soft prior (to be discussed) reconstruction methods is given by:
| (4) |
Since regularization methods may be problem-specific (Meaney et al., 2001), and the appropriate regularization approach for model-based IVUS elastography is yet to be established, we implemented the logarithm-contrast regularization function given in equation (4) through the three most widely used regularization methods (Tikhonov, H1-seminorm, and the total-variation-diminishing (TVD) method), which are given as follows:
- Tikhonov regularization:
(5) - H1-seminorm regularization:
(6) - and the TVD type regularization:
(7)
The regularization parameter, α, in equations (5), (6), and (7), controls the weight given to the a priori information. The variable β in equation (7) is a small scalar that was introduced and used to ensure the continuity of the regularization at ▽c = 0, which was set to unity in all reconstructions. Minimizing equation (3) with respect to shear modulus variations is a nonlinear process, which we realized through an iterative solution using a quasi-Newton BFGS (Broyden-Fletcher-Goldfarb-Shanno) algorithm and the adjoint method as described in (Oberai et al., 2009). The resulting shear modulus solution at the (q+1)th iteration has the general solution:
| (8) |
where Bq is an approximation of the Hessian matrix that we computed using the BFGS algorithm as described in Zhu et al. (1997) at the qth iteration; φq represents the step size and gq is the functional gradient of πU evaluated at μq.
2.2 Soft prior reconstruction method
The soft prior reconstruction method used the same objective function (equation 3) as the no prior reconstruction method, but the regularization term was different, as given by (Tikhonov):
| (9) |
where M is the number of segmented regions. The finite-element model used to calculate the predicted displacement values was unchanged. The no prior reconstruction technique (equation (5)) is a special case of the soft prior reconstruction method (equation (9)), where M=1.
2.3 Hard prior reconstruction method
The hard prior reconstruction method used a similar objective function to that employed in the no prior reconstruction; however, since this was a well-conditioned problem, the regularization term was removed from the objective function. To impose hard priors, we identified all the nodes within each segmented region, and then reconstructed only a single μ within each region. To illustrate, let's assume that the reconstruction field of view was divided into M regions based on the structural information, and that the shear modulus within each region was computed by applying a matrix transformation to B (the approximate Hessian), such that:
| (10) |
where K is an M × N sparse matrix, M represents the number of regions, and N represents the number of nodal points. The prior matrix K then has the form:
| (11) |
A new gradient vector was produced by summing all gradient components from each row that corresponded to the mth region, and the shear modulus for each region was solved as follows:
| (12) |
where the dimension of the update vector, , was M. The shear modulus at each nodal coordinate was updated as follows:
| (13) |
The hard prior (HP) reconstruction approach lumps the shear modulus of all the nodes within a region together, which is advantageous because it transforms the ill-posed reconstruction problem to a well-conditioned one.
2.4 Implementation
All reconstruction methods were implemented in Fortran 90, which was compiled on a 16-core Intel Xeon Server that was operating at 2.93 GHz under the Centos 5.6 (64-bit) operating system. Reconstruction time was dependent on the noise level, inversion method, and mesh density. However, in the studies reported in this paper, the reconstruction process typically converged within 200–300 iterations (i.e., within 5 min).
2.5 Simulation method
2.5.1 Forward modeling
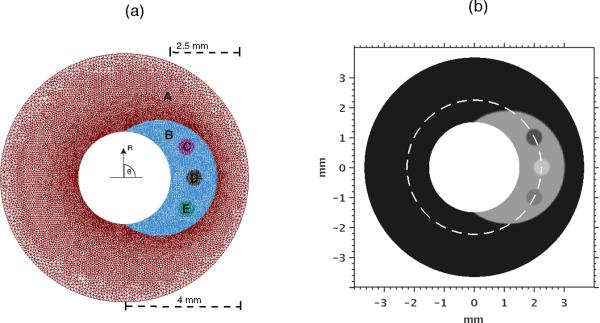
To simulate infinite boundary conditions, we constructed a finite-element representation of a vessel that had an outer diameter of 50 mm using a commercially available finite-element (FE) package (Abaqus, Dassault Systemes, France). The Young's moduli of the normal vessel wall and soft plaque region were set to 45 kPa and 15 kPa, respectively (Holzapfel et al., 2005; Lee et al., 1992). Figure 1 shows the mesh that was used in the FE simulations. To simulate a heterogeneous plaque, we included three inhomogeneities, denoted by the labels (C), (D) and (E) in Figure 1. The Young's moduli of the inhomogeneities were 30 kPa (C), 10 kPa (D), and 20 kPa (E), respectively. A homogeneous Poisson's ratio of 0.495 was assigned to all materials. The three-dimensional elasticity problem was reduced to two dimensions using the plane-strain approximation. The circumferential component of the displacement was assumed to be zero in the outer radius of the phantom. The radial component of the displacement was assumed to be zero on four points on the outer radius (50 mm). Motion was induced in the simulated vessel by applying a distributed pressure to the inner lumen. The magnitude of the pressure (1 kPa) was chosen to produce an applied strain of 2%. In clinical practice, the measured strain within the vessel may be large; however, in IVUS, elasticity data is acquired near end-diastole, where the magnitude of strain is typically between 0.1% and 4% (de Korte et al., 2002).
Figure 1.
(Left) Finite-element mesh used to solve forward elasticity problem. Shown are the normal vessel wall (A), the plaque (B), and inhomogeneities (C), (D) and (E). Only the inner 3mm diameter are shown; however, the diameter of the modeled vessel extends to 50 mm. (Right) shear modulus distrubution used in the simulated vessel phantom, showing the mechanical properties of vessel wall, plaque, and inhomogeneities. The dotted line represents the regions over which the moduli shown in Fig 10 were computed.
Displacement boundary conditions were imposed on the outer radius of the simulated phantom. In the simulation study, the simulated catheter was positioned at the vessel center; however, this is typically not the case in practice.
2.5.2 Synthesis of RF echo frames
Radio frequency (RF) echo frames were synthesized by combining the finite-element method with the Field II (Jensen, 1991) acoustic model using a four-step process. First, the point spread function (PSF) of an IVUS system was simulated using Field II. In this study, the simulated IVUS system consisted of a 40 MHz single-element focused transducer that had a 30% fractional bandwidth. Second, the acoustic response of the pre-compressed vessel was simulated by randomly distributing point scatters within a 4 mm diameter circular region. Third, the acoustic response of the post-compressed vessel was computed by redistributing the point scatters of the pre-compressed tissue, using displacements computed by solving the forward finite-element model. Fourth, the PSF of the simulated IVUS system was convolved with the acoustic tissue response of the pre- and post-compressed deformed tissue to generate pre- and post-compressed RF echo frames. To simulate two-dimensional IVUS images, the scatters were rotated between 0° and 360° in steps of 1.41° for each rotation, at each rotation a RF echo line was generated by convolving the PSF with the scatters.
2.5.3 Strain and displacement estimator
A Gaussian random-number generator was used to model varying levels of noise that was added to the pre- and post-deformed RF echo frames, to simulate RF echo frames with sonographic SNR of 7.5 dB, 10 dB, and 15 dB. The radial displacement field was measured by applying the cross-correlation-based displacement estimator (Doyley et al., 2001) to the noisy RF echo frames. The displacements on the outer radius of the vessel were smoothed angularly with a one-dimensional running average filter, approximately 36.6O (26 nodes), to reduce the noise on the outer boundary. The RMS errors incurred in the measured radial displacements were 8 %, 6 %, and 4 % when the sonographic SNR was set to 7.5 dB, 10 dB, and 15 dB, respectively.
2.5.4 Shear modulus reconstructions
Image reconstruction was performed using a uniform finite-element mesh consisting of bi-linear quadrilateral elements. Figure 2 shows an example of a reconstruction mesh that was used in this study, which was spaced equally in both the radial and angular directions, with respect to the catheter.
Figure 2.
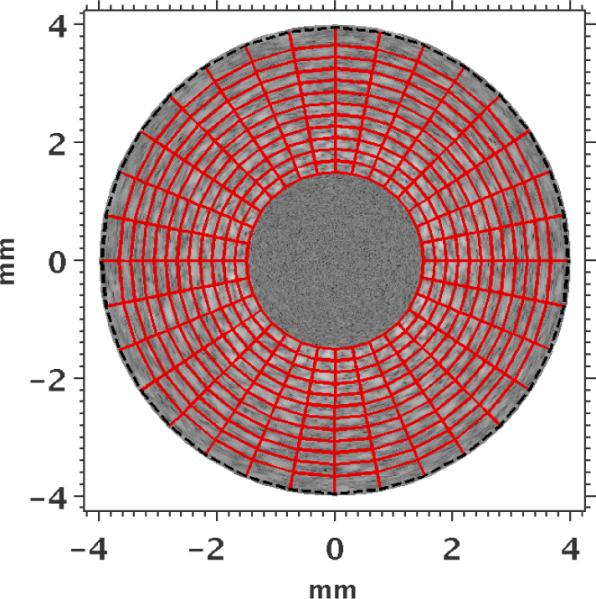
Finite-element mesh (red) employed during image reconstruction overlaid on the IVUS sonogram. The Dirichlet boundary conditions on the outer radius were smoothed in the reconstruction, and a constant pressure (1 kPa) was applied to the internal boundary of the inner radius elements. The inner and outer radii of the mesh were 1.5 mm and 4 mm, respectively.
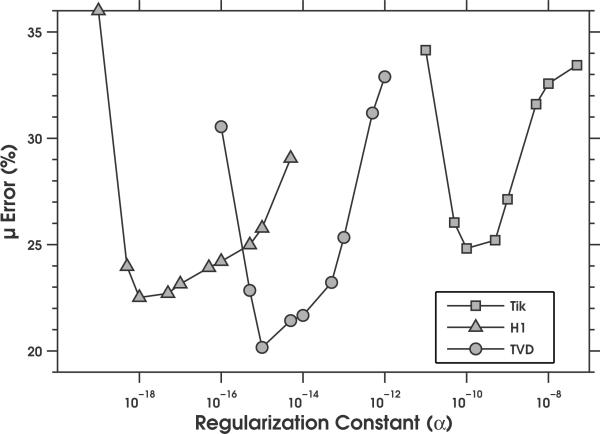
For each noise level, we determined the optimum value of the regularization parameter (α) for each regularization method empirically. This was achieved by computing the absolute mean difference between the estimated and actual shear moduli, when image reconstruction was performed with varying value of the regularization parameters, as illustrated in Figure 3. The optimum value of α that was obtained for each regularization method at each noise level is given in Table 1.
Figure 3.
Plot of the root mean squared error as a function of regularization constant (α) when the no-prior image reconstruction method was applied to noisy radial displacement estimates (15 dB). Image reconstructions were performed using the Tikhonov, H1-seminorm, and TVD regularization methods.
Table1.
Magnitude of regularization parameters employed using regularization methods at three different noise levels
| Regularization Method | 7.5 dB | 10 dB | 15 dB |
|---|---|---|---|
| Tikhonov | 1e-9 | 5e-10 | 1e-10 |
| H1-Seminorm | 5e-16 | 1e-17 | 4e-18 |
| TVD | 5e-14 | 2e-15 | 2e-15 |
Modulus elastograms were computed with three reconstruction methods: with no priors, with soft priors, and with hard priors. Hard and soft priors were constructed with: (1) incomplete structural information (concerning only the vessel and plaque region); and (2) complete structural information (concerning the vessel, plaque, and three inhomogeneities). Structural information was determined by assigning each node in the reconstruction mesh to a region based on the modulus distribution used in the forward simulation. All reconstructions were performed using an initial guess of 1 kPa. At the end of the reconstructive process, we used equation (2) to convert the reconstructed values Young's modulus.
2.6 Phantom study
2.6.1 Phantom fabrication
A vessel phantom (20.65 mm outer diameter by 15 mm long) that contained a soft, crescent-shaped inclusion was constructed from polyvinyl alcohol (PVA) using a two-step process. First, the vessel wall was fabricated by pouring 10% by weight PVA solution into a cylindrical mold (20.65 mm diameter by 15.0 cm long) that contained a slightly off-center rod (6.32 mm diameter) as described in (Fromageau et al., 2003; Maurice et al., 2005). The mold was sealed and subjected to three freeze-thaw cycles, from +20 °C to −20 °C, over a 72-hour (24 hours per cycle) period. The central rod was then removed and replaced with a 3.16 mm diameter rod. The vacant cavity between the vessel wall and rod was filled with 10% by weight PVA, and subjected to two freeze-thaw cycles. After the thermal cycling, the phantom was removed from the mold and stored at room temperature in water. The resulting vessel phantom had an inner diameter of 3.16 mm and an outer diameter of 20.65 mm.
A Landmark Servohydraulic Test System (MTS, Eden Prairie, MN) and a 5-lb load cell were used to measure the mechanical properties of representative samples of the vessel wall and plaque region. All measurements were performed at room temperature (approximately 20°C) on cylindrical-shaped PVA samples (~19.0 mm diameter by ~20.0 mm height).
2.6.2 Elastography data acquisition
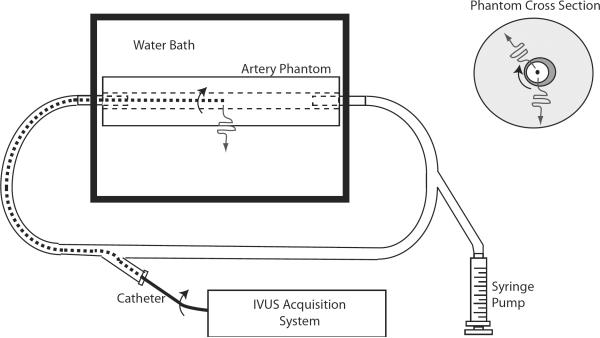
Figure 4 shows a schematic diagram of the equipment used for elastographic imaging. The vessel phantom was placed in a water bath and connected to a proximal and distal sheath. The proximal sheath was connected to a syringe pump. Echo imaging was performed using a commercially available ILab™ (Boston Scientific/Scimed, Natick, MA) intravascular ultrasound scanner that was equipped with a 40 MHz Atlantis Pro imaging catheter (Boston Scientific, Natick MA). Radio-frequency (RF) echo frames were streamed from the IVUS scanner at full frame rate (30 fps, with each frame containing 256 echo lines, and each echo line having 1024 samples) to a high-performance computer workstation using a PCI bus data acquisition card (Compuscope 14200-1GB, Gage Applied, Lockport, IL). All RF echo signals were digitized to 14 bits at 200 MHz.
Figure 4.
Schematic diagram of the equipment used for phantom imaging. A cross section of the phantom is shown (upper right) with a dark region indicating the soft inclusion. The arced arrows indicate the rotation of the transducer and the wavy line indicates the sound propagation direction relative to the catheter. The experimental setup (lower left) includes the IVUS imaging system and the 40 MHz rotating-element catheters.
The vessel was pressurized slowly using the syringe pump, and twenty RF echo frames were acquired during pressurization.
2.6.3 Strain and displacement estimation
Radial displacements were measured by applying a 2D cross-correlation-based displacement estimator to pairs of RF echo frames that represented approximately 2% strain. To minimize non-uniform rotational distortion (Kimura et al., 1996), we computed the average radial displacements from ten pairs of RF echo frames.
2.6.4 Shear modulus estimation
A finite-element representation of the vessel phantom was constructed from the IVUS sonograms using a two-step procedure. First, the inner radius of the vessel lumen was manually segmented, and then the sonogram was divided into 256 increments angularly (1 per A-line). Second, for each angular increment, we divided the path from the inner lumen to the outer radius into 54 equally space radial segments (55 nodes). Third, we constructed a 4-node, quadrilateral finite-element mesh by connecting neighboring nodes radially and angularly. The measured radial displacements were interpolated to the nodal coordinate using a bilinear interpolation algorithm in MATLAB.
Modulus elastograms were computed by applying all reconstruction methods (i.e., no prior, soft prior and hard prior) to the noisy radial displacement estimates. For the soft and hard prior reconstruction methods, we constructed two spatial priors. One group of spatial prior (i.e. SP2 & HP2) contained two geometric information: the plaque and the normal vessel wall; where as the other group of spatial prior (SP5 and HP5) contained five geometric information: the background, plaque, and three inhomogeneities. As in the simulation study, equation (2) was used to convert the reconstructed values Young's modulus.
All reconstructions were performed using an initial guess of 1 kPa. For the NP and SP reconstructions, the optimum value of the regularization parameter (α) was determined empirically, as described in the simulation study, which was 8e−10 for the Tikhonov, 4e−16 for the H1-seminorm, and 1e−14 for the TVD regularization methods.
2.7 Performance
The three approaches to image reconstruction (no prior, soft prior, and hard prior) were assessed qualitatively by visualizing the modulus elastograms and quantitatively computing the root mean square error (RMS), contrast transfer efficiency (CTE), and contrast-to-noise ratio (CNR). The root-mean squared error (RMS) was computed as follows:
| (13) |
where is the actual modulus (mean); and is the recovered modulus (mean). This performance metric was used to evaluate the accuracy of the modulus elastograms computed during the simulation study.
Contrast transfer efficiency was defined on a logarithmic scale as follows (Ponnekanti et al., 1996):
| (14) |
where Co and Ct represent the estimated and true elasticity contrasts, respectively. Therefore, η = 0 represents 100 % elasticity contrast-transfer-efficiency, and η < 0 represents a contrast transfer efficiency that is less than 100 %.
The contrast-to-noise ratio was calculated as follows (Chaturvedi et al., 1998):
| (15) |
Where is the mean modulus of the vessel wall; is the mean modulus of the plaque; and σvess and σplq are the standard deviations in the vessel and plaque, respectively.
3. Results
We performed simulation and phantom studies to assess the performance of modulus elastograms computed with structural information relative to those computed without, respectively. The results of these investigations are presented below in the form of images, profiles, and tables. To allow meaningful comparison of the recovered and actual modulus values, we normalized all modulus elastograms to the Young's modulus of the vessel wall (45 kPa). This was necessary because all reconstructions were performed using displacement boundary conditions, and thus modulus elastograms reported in this article represent relative rather than absolute estimates of Young's modulus (Doyley et al., 2000).
3.1 Simulations
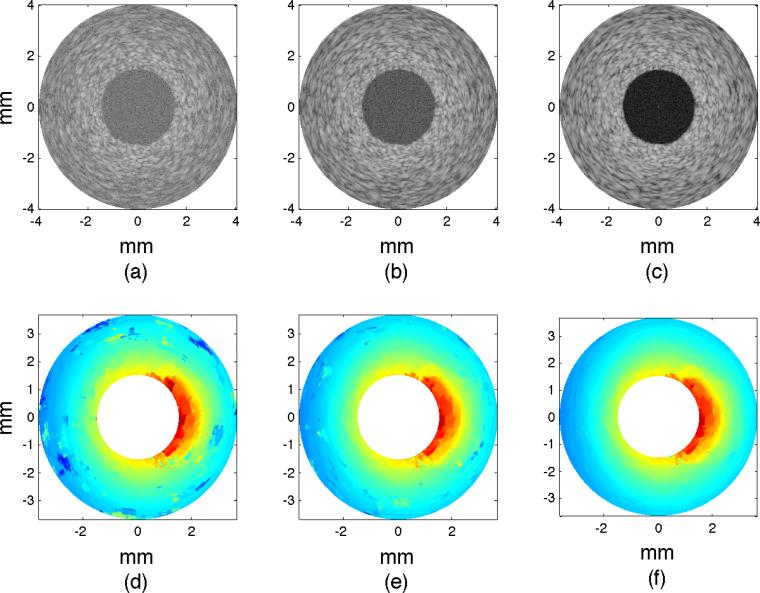
Figure 5(a–c) shows examples of sonograms computed from RF echo frames with sonographic signal-to-noise ratios (SNRs) of 7.5 dB, 10 dB, and 15 dB.
Figure 5.
Sonograms and elastograms obtained from the simulated vessel phantom. (a–c) Sonograms reconstructed from RF echo with increasing SNRs of 7.5 dB, 10 dB, and 15 dB. (d–f) Radial displacement elastograms computed by applying a cross-correlation-based displacement estimator to noisy RF echo frames.
Figure 5(d–f) shows examples of radial displacement elastograms computed from the noisy RF echo frames. The displacement estimator produced more errors when it was applied to RF echo frames with poor SNRs (< 10 dB) relative to when it was applied to echo frames with good SNRs (> 10 dB), a result which was expected because tracking error increases with decreasing SNRs (Varghese and Ophir, 1997; Walker and Trahey, 1995). The plaque was discernible in all displacement elastograms, but the three inhomogeneities were indiscernible.
3.1.1 Effect of regularization method
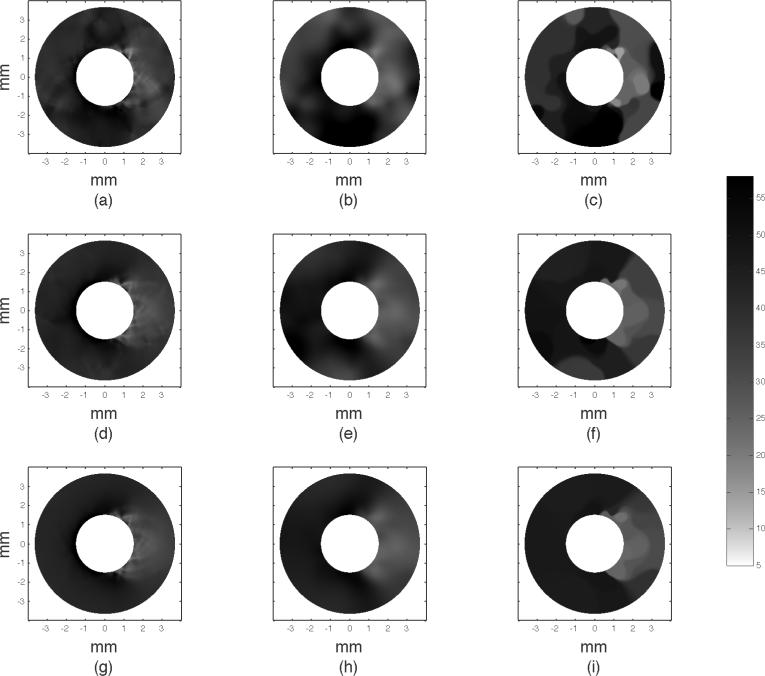
Figure 6 shows an example of modulus elastograms recovered with the no-prior (NP) reconstruction method, which illustrates the effectiveness of three prevalent regularization methods (Tikhonov, H1-seminorm, and TVD) with increasing measurement noise. All reconstructions were performed with the optimum value of the regularization parameter that was chosen empirically as described in § 2.5.4 (see Fig. 3). Measurement noise corrupted the elastograms, but elastograms computed with the H1-seminorm regularization method contained fewer artifacts than those computed with either the Tikhonov or the TVD regularization method.
Figure 6.
Modulus elastograms computed with no structural information, showing the resulting elastograms when the reconstruction produced was applied to displacements with increasing measurement noise (top to bottom) with the Tikhonov (first column), the H1-seminorm (second column), and TVD (third column) regularization methods.
Figure 7a shows a bar graph of the CNRe obtained with each regularization method and noise level. Apparently, CNRe was dependent on the sonographic SNRs, and the highest and lowest CNRe were achieved using TVD and Tikhonov regularization methods, respectively. Figure 7b shows a bar graph of the contrast-transfer-efficiency (CTE) achieved with each regularization method and noise level. In general, the NP reconstruction method produced elastograms with incomplete modulus contrast recovery. The TVD regularization method produced elastograms with the best contrast recovery (CTE ranging from 3 to 5 dB), and the Tikhonov regularization method produced elastograms with worst contrast recovery (CTE ranging from 3.8 to 7.5 dB). To appreciate how different regularization methods impacted performance, we have to examine the feature of the contrast regularization function that each regularization method penalized. For example, the Tikhonov regularization penalizes variance in the contrast; therefore, it penalizes variations due to tissue heterogeneity and reconstruction noise indiscriminately. Similarly, the TVD regularization method penalizes large gradients in the contrast (Vogel, 2002); therefore, variations due to tissue inhomogenuities are penalized less severely. The H1 semi-norm regularization method produced images with higher CTEe than those produced using the Tikhonov regularization method, which was expected, since the H1-seminorm regularization method also penalized the gradient in the contrast.
Figure 7.
(a) Contrast-noise and (b) CTE computed from modulus elastograms when the reconstruction process was applied to displacements with increasing measurement noise with the Tikhonov, the H1-seminorm, and TVD (third column) regularization methods.
The regularization method employed also influenced the quality of the ensuing elastograms produced using the SP reconstruction method (results not shown). Therefore, for the remainder of this paper, we have reported only the results obtained with the H1-seminorm regularization method, since this method typically produced less blotchy elastograms than the TVD regularization.
3.1.2 Effect of structural information: limited or complete
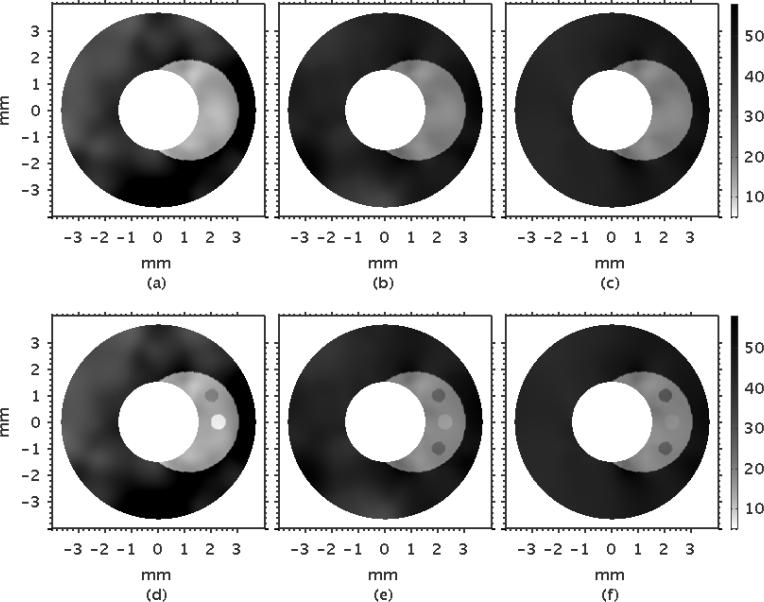
Figure 8 shows examples of modulus elastograms recovered with the soft prior reconstruction method (SP) that illustrates the effect on performance when image reconstruction was performed with limited (a–c) and complete (d–f) structural information. Increasing SNRs improved the modulus elastograms. The plaque was discernible in all modulus elastograms, and the elastograms were visually better than those computed using the NP reconstruction method (Figure 6). The inhomogeneities were visible only in modulus elastograms computed with complete structural information (Figure 8 (d–f)), which emphasizes the benefits of including structural information in the modulus recovery process.
Figure 8.
Modulus elastograms recovered when the soft prior reconstruction method was applied to radial displacement estimates with increasing RMS errors of 8% (7.5 dB), 6% (10 dB), 4% (15 dB) (left to right) when incomplete (a–c) and complete (d–f) structural information was included in the image-reconstruction process.
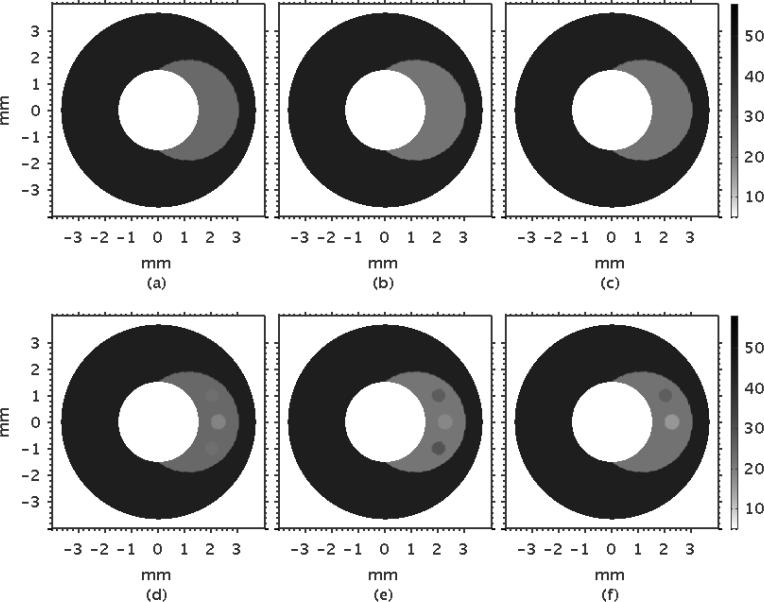
Figure 9 shows the corresponding modulus elastograms recovered with the hard prior (HP) reconstruction method. No regularization method was employed in this case, because the image reconstruction problem was well conditioned. As with the SP reconstruction method, the visual appearance of the elastograms was marginally affected by the displacement measurement noise, and the plaque was discernible with good contrast-to-noise ratio. Additionally, the inhomogeneities were discernible only in modulus elastograms reconstructed with complete structural information.
Figure 9.
Modulus elastograms recovered when the hard prior reconstruction method was applied to radial displacement estimates with RMS errors of 8% (7.5 dB), 6% (10 dB), 4% (15 dB) (left to right) when incomplete (a–c) and complete (d–f) structural information was included in the reconstruction process.
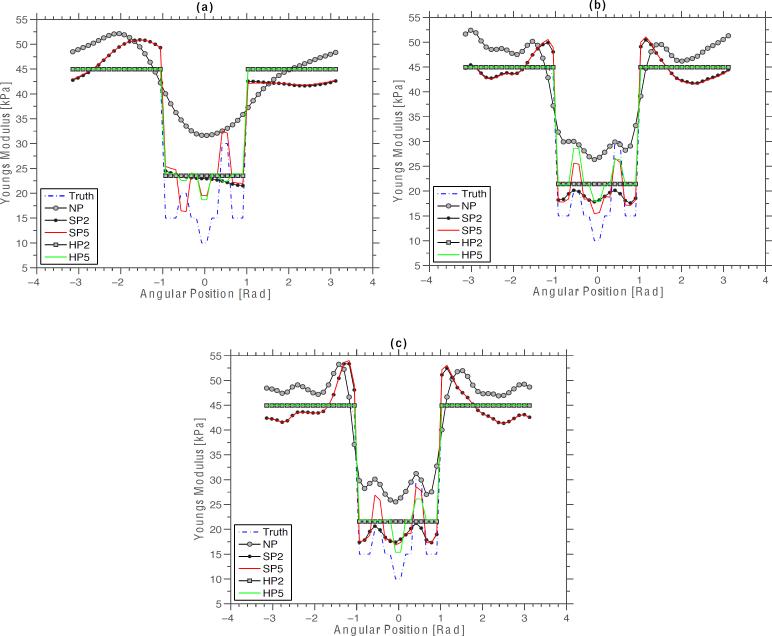
Figure 10 shows a montage of modulus profiles obtained from the modulus elastograms shown in Figures 8 and 9, over the region of interest shown in Figure 1, which revealed four interesting observations. Firstly, the NP reconstruction method overestimated the modulus of the surrounding vessel wall and the plaque, and could not recover the modulus of inhomogeneities. Secondly, the SP reconstruction method also overestimated the modulus of the vessel wall, but less error was incurred when recovering the modulus of the plaque. Thirdly, the HP reconstruction method provided a good estimate of the modulus of plaque, albeit not as accurate as that obtained using the SP method. Fourth, the performance of both the SP and HP reconstruction methods improved when the reconstruction was performed with complete structural information, relative to when reconstruction was performed with incomplete structural information.
Figure 10.
Modulus profiles obtained from elastograms recovered with the no prior, soft prior and hard prior reconstruction methods over a region of interest defined in figure 1. Showing the profiles obtained from elastograms that were computed from radial displacements with RMS errors of (a) 8% (7.5 dB), (b) 6% (10 dB), and (c) 4% (15 dB). The symbols SP2, SP5, HP2, and HP5 represent the elastograms computed with the SP and HP reconstruction methods, with spatial priors consisting of two and five regions. Similarly, the symbols Truth and NP were used to represent the actual modulus profiles, and the modulus profile obtained with the no-prior inversion scheme.
Figure 11 shows a bar graph of the mean Young's modulus recovered from each tissue type (vessel wall, plaques and heterogeneities) with each reconstruction method. The uncertainty in estimated moduli was dependent on the reconstruction method employed. The NP modulus elastograms had the largest measurement uncertainty, and the HP modulus elastograms had the least measurement uncertainty; this result was expected because the modulus within each region was restricted from varying spatially (i.e., all points within each region were assigned the same modulus). None of the reconstruction methods could completely recover the moduli of the plaque or the heterogeneities. Nevertheless, it was apparent that the SP reconstruction method produced the most accurate estimates of both the plaque and the inhomogeneities. Including precise spatial priors improved the accuracy of elastograms that were recovered with both the SP and HP reconstruction methods. Table 2 shows the normalized root-mean-squared (RMS) error incurred by each reconstruction method. The NP modulus elastograms exhibited the largest RMS errors; i.e., RMS errors ranging from 6.1 % to 8.5 %. The SP modulus elastograms exhibited RMS errors ranging from 2.9 % to 8.0 %. It is apparent that the errors incurred in the SP elastograms depended on both the quality of the radial displacement estimates and on whether reconstruction was performed with precise or incomplete spatial priors. The HP modulus elastograms exhibited the least errors, i.e., RMS errors ranging from 1.3 % to 2.5 % and as with the SP modulus elastograms, RMS error was dependent on whether modulus elastograms were computed with precise or incomplete spatial priors.
Figure 11.
The mean modulus recovered from the vessel wall (Eves), the plaque (Eplq), and the heterogeneities (, , ) in elastograms computed using the NP, SP, and HP reconstruction methods. Showing the shear modulus recovered from each tissue types when each reconstruction method was applied to radial displacements with RMS errors of 8% (7.5 dB), 6% (10 dB), 4% (15 dB). The symbols SP2, SP5, HP2, and HP5 represent the elastograms computed with the SP and HP reconstruction with spatial consisting of two and five regions.
Table 2.
The normalized RMS errors of modulus elastograms reconstructed using three methods: no prior, soft prior, and hard prior.
| Method | 7.0 dB | 10 dB | 15 dB |
|---|---|---|---|
| NP | 26.2 % | 24.2 % | 22.6% |
| SP2 | 11.9 % | 9.6 % | 9.4 % |
| SP5 | 12.2% | 9.4 % | 9.1 % |
| HP2 | 9.8 % | 7.7 % | 7.5 % |
| HP5 | 10.0% | 7.4 % | 7.2 % |
The symbols SP2, SP5, HP2, and HP5 represent the cases when SP and HP reconstructions were performed with spatial priors consisting of two and five regions. The normalized RMS values were computed using equation 13.
3.2 Phantom
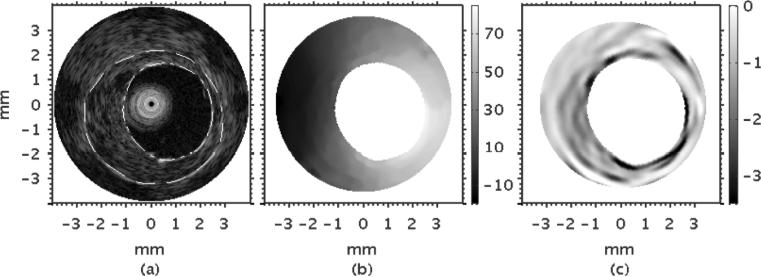
Figure 12(a) shows a representative example of an IVUS sonogram that was obtained from the heterogeneous vessel phantom. The plaque was discernible in the sonogram due to differences in echogenicity between the plaque and the normal vessel wall. Figure 12(b) shows the composite radial displacement elastograms obtained by averaging ten statistically independent radial displacement elastograms. Figure 12(c) shows the corresponding radial strain elastogram obtained when a least squares strain estimator (with a 1 mm long kernel) was applied to the composite radial displacement elastogram computed using the cross-correlation based displacement estimator, illustrating that there was good visual agreement between the spatial extent of the plaque in the sonogram and that in the radial strain elastogram.
Figure 12.
(a) IVUS sonogram, (b) radial displacement elastogram, and (c) strain elastogram obtained from the vessel phantom. The dotted lines represent the manually segmented plaque region.
Figure 13 shows the corresponding modulus elastograms recovered when the three reconstruction methods - the NP, SP, and HP - were applied to the composite radial displacement estimates. Despite the relatively large elastic contrast between the plaque and normal vessel (≈ 38.2 ± 0.8 kPa for the vessel and 9.5 ± 0.1 kPa for the plaque), the plaque was not discernible in elastograms recovered with the no prior reconstruction method. However, the plaque was discernible in elastograms computed using both the hard and soft prior reconstruction methods. The modulus distribution recovered from the plaque region varied spatially in elastograms computed with the SP reconstruction method, but was constant in elastograms recovered using the HP reconstruction method.
Figure 13.
Modulus elastograms recovered from the vessel phantom using three reconstruction methods: (a) no prior, (b) soft prior, and (c) hard prior.
Table 3 reports performance metrics (CTE and CNR) extracted from the modulus elastograms shown in Figure 13, as well as the Young's shear modulus recovered from the plaque and vessel wall. It is apparent that plaque was not discernable in the NP modulus elastograms (CNR =0.35), which is consistent with our visual observations (Figure 13), and not surprising, given the poor contrast transfer efficiency (8.8 dB). The Young's modulus standard deviation was zero for the HP reconstruction method, which was not surprising because Young's modulus was not allowed to vary spatially. This property implies that HP elastograms had infinite contrast-to-noise ratio.
Table 3.
The hard and soft reconstructed Young's modulus means and standard deviations computed from the pixels within a given region in one modulus elastogram, reconstructed contrasts, and contrast-to-noise ratios (CNR) for two experiments, the first using only one region and the next using two segmented regions.
| CTE (dB) | CNR | |||
|---|---|---|---|---|
| NP | 38.2 ± 11.1 | 34.3 ± 11.2 | 8.66 | 0.35 |
| Hard Prior | 38.2 | 14.4 | 0.81 | ∞ |
| Soft Prior | 38.2 ± 17.3 | 10.1 ± 4.6 | 0.92 | 2.2 |
The independently measured hard and soft Young's moduli were 38.2 ± 0.8 and 9.5 ± 0.1 kPa. respectively. The actual modulus contrast was approximately 0.75. All modulus values shown were normalized, such that the mean of the harder modulus was equal to the measured value.
4. Discussion
This study provides information on how to improve the performance of model-based elastography. Life-threatening plaques are difficult to detect because X-ray angiography is limited. However, an imaging modality that provides images of circumferential stress would allow cardiologists to (a) detect life-threatening plaques, and (b) predict their propensity to rupture (Lendon et al., 1991; Loree et al., 1992). To visualize circumferential stress, the shear or Young's modulus of the underlying tissues must be known, which, in principle, can be estimated by solving the inverse elasticity problem (Kallel and Bertrand, 1996; Sumi et al., 1995; Skovoroda and Aglyamov, 1995). Developing useful inversion schemes is challenging, because the inverse elasticity problem is ill-posed (Barbone and Bamber, 2002). Therefore, to transform the ill-posed problem to a well-posed one, researchers have used spatial priors to impose hard constraints on the reconstruction process. However, imposing incomplete spatial priors on the reconstruction process could degrade performance (Boverman et al., 2005). To improve the robustness of the reconstruction process to errors in spatial priors, we have developed methods to impose soft rather than hard constraints on the reconstruction process. This study reports the results of studies that we have conducted to assess the relative merits of three reconstruction methods: no prior (NP), soft-prior (SP), and hard-prior (HP).
4.1. Simulation studies
Figure 6 demonstrates that the conventional approach to image reconstruction (NP) employed in breast elastography (Van Houten et al., 2003; Xydeas et al., 2005; Oberai et al., 2009) is not viable in vascular applications—which implies that the ill-posed nature of the inverse elasticity problem is a bigger issue in vascular elastography, perhaps because the incompressibility of soft tissues presents additional problems. More specifically, in vascular elastography the displacement is determined almost entirely by incompressibility and the displacement of the inner vessel wall, and is nearly independent of other mechanical parameters; this lack of sensitivity makes the inverse problem more challenging.
Figure 9 demonstrates that the image-reconstruction process can tolerate displacement errors as large as 8 % when hard priors are employed. This observation is consistent with previously reported results (Khalil et al., 2006; Baldewsing et al., 2005a; Le Floc'h et al., 2010). More specifically, an RMS error of 10 % was achieved at the lowest signal-to-noise ratio and 7.2 % at the highest signal-to-noise ratio, which is comparable that reported in Le Floc'h et al. (2009). However, modulus elastograms reported in (Baldewsing et al., 2005a) were more accurate than those reported in this study because in addition to structural information Baldewsing et al. (2005a) also included additional information that they obtained from IVUS sonograms and radial strain elastograms— namely, the location of the plaque, and the presence of soft regions. We plan to investigate the effect of including additional a priori information — such as an deriving a better initial guess of Young's modulus from radial strain elastograms, and including the circumferential displacements in the reconstruction process — on the performance of hard and soft prior modulus elastograms.
The SP reconstruction method was also resilient to displacement noise, as demonstrated in Figure 8, and it produced better estimates of the properties of individual model components than the HP reconstruction method (Figure 11); but, globally, lower RMS errors were incurred using the HP than the SP reconstruction method (Table 2). The CTE and CNR of SP elastograms was only marginally better than those produced with the HP method when incomplete spatial priors were used, which implied that the reconstruction process was over constrained, and thus was also affected by incomplete spatial priors. We are currently performing studies to further optimize the soft prior reconstruction method — to assess the tradeoff between the accuracy and the precision of modulus elastograms recovered with the SP method as the magnitude of the regularization function is decreased. Additionally, we are also exploring more traditional approaches for imposing soft constraints, such as a weighting matrix (Fang et al., 2010; Yalavarthy et al., 2007).
4.2 phantom studies
Table 3 demonstrates that (a) modulus elastograms recovered with the NP reconstruction method produced poor contrast transfer efficiency (CTE) and contrast-to-noise ratio (CNR), and that (b) including spatial priors in the reconstruction process improved both CTE and CNR, which is consistent with the simulation results. It would appear that the hard prior reconstruction method offers the best contrast recovery; however, since the geometries of the test samples and the vessel phantom were different, errors were incurred when estimating the contrast of the phantom; and thus the HP reconstruction technique is not necessarily the best contrast recovery method. According to Le Floc'h et al. (2010) the HP reconstruction method can detect soft plaque with high specificity (90 %) and sensitivity (82 %), but it typically overestimate the modulus of soft plaques, which suggests that the soft prior reconstruction produced the most accurate modulus elastograms. The modulus elastograms of vessel phantoms reported in Baldewsing et al. (2005b) were more accurate than those reported in this study (RMS error on the order of 0.5 %), because in-addition to geometric constraints they also imposed other constraints on the reconstruction method. An important to ask is: “is an linear elastic, isotropic, nearly incompressible, plane-strain model an appropriate model for vascular elastography?” It is well known that in addition to measurement noise, discrepancy between the finite element model and reality will introduce additional errors in the reconstruction process. According to Baldeswing et al. (2004) a linear elastic, isotropic, nearly incompressible plane strain finite element model will produced radial displacements and strains that are comparable to those measured in vessel mimicking phantoms; therefore, since this model is appropriate for phantom studies it is reasonable to assume that the errors incurred in this study was due solely to measurement noise rather than modeling errors.
4.2 Clinical implications
The long-term goal of this work is to develop an imaging framework to visualize the circumferential stress distribution within vascular tissues — a task that requires absolute estimates of shear modulus. Shear modulus can be quantified in the clinical setting using one of two approaches. One approach is to calibrate relative estimates of shear modulus with the SP reconstruction method, using tissue types that are identifiable in IVUS sonograms such as calcification, provided that the biological variability of the shear modulus of any selected tissue is small. The main challenges are that (a) there is no guarantee that there will always be identifiable tissues in IVUS sonograms, and that (b) available data on the shear modulus of different tissue types is sparse. An alternate approach is to develop a reconstruction procedure based on known force-boundary conditions that provide absolute estimates of shear modulus, as demonstrated in (Doyley et al., 2000). The pressure within the vessel (or on the lumen) can be measured with a pressure catheter, so this should be feasible. However, the main difficulty with this approach is that pressure is typically measured in a different cross section of the vessel from the area in which imaging is performed. Therefore, any pressure gradients in the vessel could introduce significant errors in the recovered modulus elastograms, because (a) the magnitude of the pressure at the measurement site may be significantly different from that exerted on the inner lumen, and (b) the pressure exerted on the inner lumen is not necessarily uniformly distributed. Therefore, in order to determine the usefulness of circumferential stress imaging, studies must be conducted to determine how errors in magnitude and/or distribution of pressure exerted on the inner lumen boundary influence the accuracy of shear modulus elastograms.
4.3 Study limitations
A major limitation of this study is the vessel model employed in the simulation studies. More specifically, the model doesn't accurately represent the heterogeneity and modulus distribution that is likely to exist in humans. For instance, the simulated vessel did not contain a fibrous cap, which is usually the case in practice. Furthermore, since the shear modulus of calcified plaques is much larger than that of either the lipid-pool or the fibrous cap, typical vessels will have large variations in modulus contrast that could degrade the performance of the SP reconstruction method. Consequently, we plan to conduct simulation studies with a more sophisticated plaque model to determine the impact, if any, of modulus dynamic range on the performance of SP modulus elastograms.
Besides the model, it is well known that catheter eccentricity introduces artifacts in strain and displacement elastograms (de Korte et al., 1999); however, the impact of catheter eccentricity was not investigated in this study. We envisioned that catheter eccentricity could also present problems in model-based elastography, especially when image reconstruction was performed using radial-displacement estimates. Although Le Floc'h et al. (2009) demonstrated that the position of the catheter in the lumen did not degrade the performance of modulus elastograms noticeably, it is not clear if this was due to the fact that the shear strain was also included in the reconstruction process. Consequently, we also plan to investigate the impact of catheter eccentricity on the SP reconstruction method when reconstruction is performed using only a single component of displacement (radial) as well as both components of displacements.
5. Conclusions
This work demonstrated that a reconstruction technique which uses spatial priors should produced more accurate modulus elastograms, with good contrast-to-noise ratios, than those produced with no prior information. Simulated experiments suggest that (1) the NP reconstruction method can produce useful modulus elastograms because the ill-posed nature of the inverse elasticity problem is a bigger issue in vascular elastography, and (2) including geometrical information either in the form of either hard or soft priors will produced useful modulus elastograms that can tolerate up to 8% displacement noise, and (3) the HP reconstruction method produced most accurate estimate of the global mechanical properties, but the SP reconstruction method produce more accurate estimate of the individual model components. The results of the preliminary phantom experiment suggest that both the hard and soft prior reconstruction method can produced useful modulus elastograms. The results of the hard and soft prior reconstruction methods are sufficiently encouraging to warrant further development and clinical evaluation of this reconstruction method.
Acknowledgements
This work was funded by a National Heart and Lungs Research Grant: R01 HL088523. A special thanks to Dr. Amy Lerner and the Biomedical Engineering Department at the University of Rochester for the use of their lab facilities.
REFERENCES
- Baldewsing R, Mastik F, Schaar J, Serruys P, van der Steen A. Robustness of reconstructing the young's modulus distribution of vulnerable atherosclerotic plaques using a parametric plaque model. Ultrasound Med Biol. 2005a;31:1631–45. doi: 10.1016/j.ultrasmedbio.2005.08.006. [DOI] [PubMed] [Google Scholar]
- Baldewsing R, Schaar J, Mastik F, Oomens C, van der Steen A. Assessment of vulnerable plaque composition by matching the deformation of a parametric plaque model to measured plaque deformation. Ieee T Med Imaging. 2005b;24:514–28. doi: 10.1109/tmi.2005.844170. [DOI] [PubMed] [Google Scholar]
- Baldewsing RA, De Korte CL, Schaar JA, Mastik F, Van Der Steen AFW. A finite element model for performing intravascular ultrasound elastography of human atherosclerotic coronary arteries. Ultrasound in Medicine and Biology. 2004;30:803–13. doi: 10.1016/j.ultrasmedbio.2004.04.005. [DOI] [PubMed] [Google Scholar]
- Baldewsing RA, Mastik F, Schaar JA, Serruys PW, van der Steen AF. Young's modulus reconstruction of vulnerable atherosclerotic plaque components using deformable curves. Ultrasound Med Biol. 2006;32:201–10. doi: 10.1016/j.ultrasmedbio.2005.11.016. [DOI] [PubMed] [Google Scholar]
- Barbone PE, Bamber JC. Quantitative elasticity imaging: what can and cannot be inferred from strain images. Phys Med Biol. 2002;47:2147–64. doi: 10.1088/0031-9155/47/12/310. [DOI] [PubMed] [Google Scholar]
- Boverman G, Miller EL, Li A, Zhang Q, Chaves T, Brooks DH, Boas DA. Quantitative spectroscopic diffuse optical tomography of the breast guided by imperfect a priori structural information. Phys Med Biol. 2005;50:3941–56. doi: 10.1088/0031-9155/50/17/002. [DOI] [PubMed] [Google Scholar]
- Chaturvedi P, Insana MF, Hall TJ. Testing the limitations of 2-D companding for strain imaging using phantoms. Ieee Transactions on Ultrasonics Ferroelectrics and Frequency Control. 1998;45:1022–31. doi: 10.1109/58.710585. [DOI] [PubMed] [Google Scholar]
- de Korte CL, Cespedes EI, van der Steen AFW. Influence of catheter position on estimated strain in intravascular elastography. Ieee Transactions on Ultrasonics Ferroelectrics and Frequency Control. 1999;46:616–25. doi: 10.1109/58.764848. [DOI] [PubMed] [Google Scholar]
- de Korte CL, Pasterkamp G, van der Steen AF, Woutman HA, Bom N. Characterization of plaque components with intravascular ultrasound elastography in human femoral and coronary arteries in vitro. Circulation. 2000;102:617–23. doi: 10.1161/01.cir.102.6.617. [DOI] [PubMed] [Google Scholar]
- de Korte CL, Sierevogel MJ, Mastik F, Strijder C, Schaar JA, Velema E, Pasterkamp G, Serruys PW, van der Steen AF. Identification of atherosclerotic plaque components with intravascular ultrasound elastography in vivo: a Yucatan pig study. Circulation. 2002;105:1627–30. doi: 10.1161/01.cir.0000014988.66572.2e. [DOI] [PubMed] [Google Scholar]
- deKorte CL, Cespedes EI, vanderSteen AFW, Lancee CT. Intravascular elasticity imaging using ultrasound: feasibility studies in phantoms. Ultrasound in Med.& Biol. 1997;23:735–46. doi: 10.1016/s0301-5629(97)00004-5. [DOI] [PubMed] [Google Scholar]
- Doyley M, Bamber J, Fuechsel F, Bush N. A freehand elastographic imaging approach for clinical breast imaging: System development and performance evaluation. Ultrasound in Medicine and Biology. 2001;27:1347–57. doi: 10.1016/s0301-5629(01)00429-x. [DOI] [PubMed] [Google Scholar]
- Doyley MM, Meaney PM, Bamber JC. Evaluation of an iterative reconstruction method for quantitative elastography. Phys Med Biol. 2000;45:1521–40. doi: 10.1088/0031-9155/45/6/309. [DOI] [PubMed] [Google Scholar]
- Doyley MM, Srinivasan S, Dimidenko E, Soni N, Ophir J. Enhancing the performance of model-based elastography by incorporating additional a priori information in the modulus image reconstruction process. Phys Med Biol. 2006;51:95–112. doi: 10.1088/0031-9155/51/1/007. [DOI] [PubMed] [Google Scholar]
- Falk E. Pathogenesis of Atherosclerosis. Journal of the American College of Cardiology. 2006;47:C7–12. doi: 10.1016/j.jacc.2005.09.068. [DOI] [PubMed] [Google Scholar]
- Fang Q, Moore RH, Kopans DB, Boas DA. Compositional-prior-guided image reconstruction algorithm for multi-modality imaging. Biomed Opt Express. 2010;1:223–35. doi: 10.1364/boe.1.000223. [DOI] [PMC free article] [PubMed] [Google Scholar]
- Friedman MH, Bargeron CB, Duncan DD, Hutchins GM, Mark FF. Effects of Arterial Compliance and Non-Newtonian Rheology on Correlations between Intimal Thickness and Wall Shear. Journal of Biomechanical Engineering-Transactions of the Asme. 1992;114:317–20. doi: 10.1115/1.2891389. [DOI] [PubMed] [Google Scholar]
- Fromageau J, Brusseau E, Vray D, Gimenez G, Delachartre P. Characterization of PVA cryogel for intravascular ultrasound elasticity imaging. IEEE Trans Ultrason Ferroelectr Freq Control. 2003;50:1318–24. doi: 10.1109/tuffc.2003.1244748. [DOI] [PubMed] [Google Scholar]
- Fujii K, Carlier SG, Mintz GS, Wijns W, Colombo A, Costa RA, Costa JD, Takebayashi H, Yasuda T, Kimura M, Sano K, Mousse I, Dangas G, Mehran R, Stone GW, Moses JW, Leon MB. Association of arterial remodeling and plaque characterization by intravascular ultrasound virtual Histology (TM) analysis. Journal of the American College of Cardiology. 2005;45:59A–60A. doi: 10.1016/j.amjcard.2005.07.054. [DOI] [PubMed] [Google Scholar]
- Fuster V, Stein B, Ambrose J, Badimon L, Badimon JJ, Chesebro JH. Atherosclerotic plaque rupture and thrombosis. evolving concepts. Circulation. 1990;82:II.47–II.59. [PubMed] [Google Scholar]
- Ge J, Chirillo F, Schwedtmann J, Gorge G, Haude M, Baumgart D, Shah V, von Birgelen C, Sack S, Boudoulas H, Erbel R. Screening of ruptured plaques in patients with coronary artery disease by intravascular ultrasound. Heart. 1999;81:621–7. doi: 10.1136/hrt.81.6.621. [DOI] [PMC free article] [PubMed] [Google Scholar]
- Glagov S, Weisenberg E, Zarins CK, Stankunavicius R, Kolettis GJ. Compensatory enlargement of human atherosclerotic coronary arteries. N Engl J Med. 1987;316:1371–5. doi: 10.1056/NEJM198705283162204. [DOI] [PubMed] [Google Scholar]
- Gorge G, Ge J, Baumgart D, von Birgelen C, Erbel R. In vivo tomographic assessment of the heart and blood vessels with intravascular ultrasound. Basic Res Cardiol. 1998;93:219–40. doi: 10.1007/s003950050090. [DOI] [PubMed] [Google Scholar]
- Hardamar J. Lectures on Cauchy's Problems. Dover; New York: 1952. [Google Scholar]
- Hoffmann R, Mintz GS, Mehran R, Kent KM, Pichard AD, Satler LF, Leon MB. Tissue proliferation within and surrounding Palmaz-Schatz stents is dependent on the aggressiveness of stent implantation technique. Am J Cardiol. 1999;83:1170–4. doi: 10.1016/s0002-9149(99)00053-3. [DOI] [PubMed] [Google Scholar]
- Holzapfel GA, Sommer G, Gasser CT, Regitnig P. Determination of layer-specific mechanical properties of human coronary arteries with nonatherosclerotic intimal thickening and related constitutive modeling. Am J Physiol Heart Circ Physiol. 2005;289:H2048–58. doi: 10.1152/ajpheart.00934.2004. [DOI] [PubMed] [Google Scholar]
- Jensen JA. A Model for the Propagation and Scattering of Ultrasound in Tissue. Journal of the Acoustical Society of America. 1991;89:182–90. doi: 10.1121/1.400497. [DOI] [PubMed] [Google Scholar]
- Kallel F, Bertrand M. Tissue elasticity reconstruction using linear perturbation method. IEEE Transactions On Medical Imaging. 1996;15:299–313. doi: 10.1109/42.500139. [DOI] [PubMed] [Google Scholar]
- Khalil AS, Bouma BE, Kaazempur Mofrad MR. A combined FEM/genetic algorithm for vascular soft tissue elasticity estimation. Cardiovasc Eng. 2006;6:93–102. doi: 10.1007/s10558-006-9013-5. [DOI] [PubMed] [Google Scholar]
- Khouzam RN. Pressure wire for physiological assessment of coronary arteries. Can J Cardiol. 2008;24:66. doi: 10.1016/s0828-282x(08)70553-1. [DOI] [PMC free article] [PubMed] [Google Scholar]
- Kimura BJ, Bhargava V, Palinski W, Russo RJ, DeMaria AN. Distortion of intravascular ultrasound images because of nonuniform angular velocity of mechanical-type transducers. American Heart Journal. 1996;132:328–36. doi: 10.1016/s0002-8703(96)90429-9. [DOI] [PubMed] [Google Scholar]
- Kubo T, Imanishi T, Takarada S, Kuroi A, Ueno S, Yamano T, Tanimoto T, Matsuo Y, Masho T, Kitabata H, Tsuda K, Tomobuchi Y, Akasaka T. Assessment of culprit lesion morphology in acute myocardial infarction - Ability of optical coherence tomography compared with intravascular ultrasound and coronary angioscopy. Journal of the American College of Cardiology. 2007;50:933–9. doi: 10.1016/j.jacc.2007.04.082. [DOI] [PubMed] [Google Scholar]
- Larsen J, Brekke M, Sandvik L, Arnesen H, Hanssen KF, Dahl-Jorgensen K. Silent coronary atheromatosis in type 1 diabetic patients and its relation to long-term glycemic control. Diabetes. 2002;51:2637–41. doi: 10.2337/diabetes.51.8.2637. [DOI] [PubMed] [Google Scholar]
- Le Floc'h S, Cloutier G, Finet G, Tracqui P, Pettigrew RI, Ohayon J. On the potential of a new IVUS elasticity modulus imaging approach for detecting vulnerable atherosclerotic coronary plaques: in vitro vessel phantom study. Phys Med Biol. 2010;55:5701–21. doi: 10.1088/0031-9155/55/19/006. [DOI] [PMC free article] [PubMed] [Google Scholar]
- Le Floc'h S, Ohayon J, Tracqui P, Finet G, Gharib AM, Maurice RL, Cloutier G, Pettigrew RI. Vulnerable Atherosclerotic Plaque Elasticity Reconstruction Based on a Segmentation-Driven Optimization Procedure Using Strain Measurements: Theoretical Framework. Ieee Transactions on Medical Imaging. 2009;28:1126–37. doi: 10.1109/TMI.2009.2012852. [DOI] [PMC free article] [PubMed] [Google Scholar]
- Lee RT, Richardson SG, Loree HM, Grodzinsky AJ, Gharib SA, Schoen FJ, Pandian N. Prediction of mechanical properties of human atherosclerotic tissue by high-frequency intravascular ultrasound imaging. An in vitro study. Arterioscler Thromb. 1992;12:1–5. doi: 10.1161/01.atv.12.1.1. [DOI] [PubMed] [Google Scholar]
- Lendon CL, Davies MJ, Born GV, Richardson PD. Atherosclerotic plaque caps are locally weakened when macrophages density is increased. Atherosclerosis. 1991;87:87–90. doi: 10.1016/0021-9150(91)90235-u. [DOI] [PubMed] [Google Scholar]
- Liang Y, Zhu H, Friedman MH. The correspondence between coronary arterial wall strain and histology in a porcine model of atherosclerosis. Phys Med Biol. 2009;54:5625–41. doi: 10.1088/0031-9155/54/18/018. [DOI] [PubMed] [Google Scholar]
- Loree HM, Kamm RD, Stringfellow RG, Lee RT. Effects of fibrous cap thickness on peak circumferential stress in model atherosclerotic vessels. Circ Res. 1992;71:850–8. doi: 10.1161/01.res.71.4.850. [DOI] [PubMed] [Google Scholar]
- Maurice RL, Daronat M, Ohayon J, Stoyanova E, Foster FS, Cloutier G. Non-invasive high-frequency vascular ultrasound elastography. Phys Med Biol. 2005;50:1611–28. doi: 10.1088/0031-9155/50/7/020. [DOI] [PubMed] [Google Scholar]
- Maurice RL, Fromageau J, Cardinal MH, Doyley M, de Muinck E, Robb J, Cloutier G. Characterization of atherosclerotic plaques and mural thrombi with intravascular ultrasound elastography: a potential method evaluated in an aortic rabbit model and a human coronary artery. IEEE Trans Inf Technol Biomed. 2008;12:290–8. doi: 10.1109/titb.2008.917905. [DOI] [PubMed] [Google Scholar]
- Meaney PM, Demidenko E, Yagnamurthy NK, Li D, Fanning MW, Paulsen KD. A two-stage microwave image reconstruction procedure for improved internal feature extraction. Med Phys. 2001;28:2358–69. doi: 10.1118/1.1413520. [DOI] [PubMed] [Google Scholar]
- Moreno PR, Falk E, Palacios IF, Newell JB, Fuster V, Fallon JT. Macrophage infiltration in acute coronary syndromes: implcations for plaque rupture. Circulation. 1994;90:775–8. doi: 10.1161/01.cir.90.2.775. [DOI] [PubMed] [Google Scholar]
- Naghavi M, Madjid M, Khan MR, Mohammadi RM, Willerson JT, Casscells SW. New developments in the detection of vulnerable plaque. Curr Atheroscler Rep. 2001;3:125–35. doi: 10.1007/s11883-001-0048-1. [DOI] [PubMed] [Google Scholar]
- Oberai AA, Gokhale NH, Doyley MM, Bamber JC. Evaluation of the adjoint equation based algorithm for elasticity imaging. Physics in Medicine and Biology. 2004;49:2955–74. doi: 10.1088/0031-9155/49/13/013. [DOI] [PubMed] [Google Scholar]
- Oberai AA, Gokhale NH, Feijoo GR. Solution of inverse problems in elasticity imaging using the adjoint method. Inverse Problems. 2003;19:297–313. [Google Scholar]
- Oberai AA, Gokhale NH, Goenezen S, Barbone PE, Hall TJ, Sommer AM, Jiang JF. Linear and nonlinear elasticity imaging of soft tissue in vivo: demonstration of feasibility. Phys Med Biol. 2009;54:1191–207. doi: 10.1088/0031-9155/54/5/006. [DOI] [PMC free article] [PubMed] [Google Scholar]
- Ponnekanti H, Ophir J, Huang YJ, Cespedes I. Fundamental mechanical limitations on the visualization of elasticity contrast in elastography. Ultrasound in Med.& Biol. 1996;22:173–8. doi: 10.1016/0301-5629(94)00136-2. [DOI] [PubMed] [Google Scholar]
- Richards MS, Barbone PE, Oberai AA. Quantitative three-dimensional elasticity imaging from quasi-static deformation: a phantom study. Phys Med Biol. 2009;54:757–79. doi: 10.1088/0031-9155/54/3/019. [DOI] [PMC free article] [PubMed] [Google Scholar]
- Schaar JA, De Korte CL, Mastik F, Strijder C, Pasterkamp G, Van der Steen AF. Vulnerable plaque detection with intravascular elastography: A sensitivity and specificity study. Circulation. 2001;104:459. doi: 10.1161/01.CIR.0000097067.96619.1F. [DOI] [PubMed] [Google Scholar]
- Skovoroda AR, Aglyamov SR. On reconstruction of elastic properties of soft biological tissues exposed to low-frequencies. Biofizika. 1995;40:1329–34. [PubMed] [Google Scholar]
- Sumi C, Suzuki A, Nakayama K. Estimation of shear modulus distribution in soft-tissue from strain distribution. IEEE Transactions On Biomedical Engineering. 1995;42:193–202. doi: 10.1109/10.341832. [DOI] [PubMed] [Google Scholar]
- Van Houten EEW, Doyley MM, Kennedy FE, Weaver JB, Paulsen KD. Initial in vivo experience with steady-state subzone-based MR elastography of the human breast. Journal of Magnetic Resonance Imaging. 2003;17:72–85. doi: 10.1002/jmri.10232. [DOI] [PubMed] [Google Scholar]
- Varghese T, Ophir J. A theoretical framework for performance characterization of elastography: the strain filter. Ieee Transactions On Ultrasonics Ferroelectrics And Frequency Control. 1997;44:164–72. doi: 10.1109/58.585212. [DOI] [PubMed] [Google Scholar]
- Vink A, Pasterkamp G. Atherosclerotic plaque burden, plaque vulnerability and arterial remodeling: the role of inflammation. Minerva Cardioangiol. 2002;50:75–83. [PubMed] [Google Scholar]
- Virmani R, Burke AP, Kolodgie FD, Farb A. Vulnerable plaque: the pathology of unstable coronary lesions. J Interv Cardiol. 2002;15:439–46. doi: 10.1111/j.1540-8183.2002.tb01087.x. [DOI] [PubMed] [Google Scholar]
- Vogel CR. Computational methods for inverse problems. Society for Industrial and Applied Mathematics; Philadelphia: 2002. [Google Scholar]
- Walker WF, Trahey GE. A fundamental limit on delay estimation using partially correlated speckle signals. Ieee Transactions On Ultrasonics Ferroelectrics And Frequency Control. 1995;42:301–8. [Google Scholar]
- Wan M, Li Y, Li J, Cui Y, Zhou X. Strain imaging and elasticity reconstruction of arteries based on intravascular ultrasound video images. IEEE Trans Biomed Eng. 2001;48:116–20. doi: 10.1109/10.900271. [DOI] [PubMed] [Google Scholar]
- Xydeas T, Siegmann K, Sinkus R, Krainick-Strobel U, Miller S, Claussen CD. Magnetic resonance elastography of the breast - Correlation of signal intensity data with viscoelastic properties. Investigative Radiology. 2005;40:412–20. doi: 10.1097/01.rli.0000166940.72971.4a. [DOI] [PubMed] [Google Scholar]
- Yalavarthy PK, Pogue BW, Dehghani H, Carpenter CM, Jiang S, Paulsen KD. Structural information within regularization matrices improves near infrared diffuse optical tomography. Opt Express. 2007:8043–58. doi: 10.1364/oe.15.008043. [DOI] [PubMed] [Google Scholar]
- Zhu C, Byrd R, Lu P, Nocedal J. Algorithm 778: L-BFGS-B: Fortran subroutines for large-scale bound-constrained optimization. ACM Transactions on …. 1997 [Google Scholar]


