

Abstract
In eukaryotic cells, DNA is organized into arrays of repeated nucleosomes where the shorter nucleosome repeat length (NRL) types are associated with transcriptionally active chromatin. Here, we tested a hypothesis that systematic variations in the NRL influence nucleosome array folding into higher-order structures. For NRLs with fixed rotational settings, we observed a negative correlation between NRL and chromatin folding. Rotational variations within a range of longer NRLs (188 bp and above) typical of repressed chromatin in differentiated cells did not reveal any changes in chromatin folding. In sharp contrast, for the shorter NRL range of 165–177 bp, we observed a strong periodic dependence of chromatin folding upon the changes in linker DNA lengths, with the 172 bp repeat found in highly transcribed yeast chromatin imposing an unfolded state of the chromatin fibre that could be reversed by linker histone. Our results suggest that the NRL may direct chromatin higher-order structure into either a nucleosome position-dependent folding for short NRLs typical of transcribed genes or an architectural factor-dependent folding typical of longer NRLs prevailing in eukaryotic heterochromatin.
Keywords: chromatin fibre, higher-order structure, linker DNA, linker histone, nucleosome
Introduction
In eukaryotic cells, the DNA is organized into chromatin structures. At the basic level of compaction, this involves wrapping ∼147 bp of DNA around an octamer of core histones to form the nucleosome core particle (Richmond and Davey, 2003). Nucleosome cores are connected by 10–70 bp of linker DNA forming nucleosome arrays (beads-on-a-string) that are further compacted with the aid of linker histone into higher-order chromosomal structures (Tremethick, 2007; Fussner et al, 2011; Li and Reinberg, 2011; Schlick et al, 2012).
One of the key determinants of chromatin structure is the nucleosome repeat length (NRL). The NRL includes the constant length of DNA wrapped around the histone octamer (∼147 bp) and the variable length of linker DNA connecting adjacent nucleosome cores. Linker DNA varies in length between different tissues and in different organisms, producing a range of NRLs from the shortest 155 bp NRL found in fission yeast (Lantermann et al, 2010) to the longest measured NRL occurring in echinoderm sperm (∼240 bp) (Athey et al, 1990). Linker histone levels in chromatin are correlated with the NRL (Pearson et al, 1984; Woodcock et al, 2006). There is also an inverse correlation between linker DNA length and gene activity, where actively transcribed genomes (e.g., yeast, embryonic stem cells, and tumour cells) tend to have shorter NRLs (∼160–189 bp) and mature, transcriptionally inactive genomes (e.g. echinoderm sperm and chicken erythrocytes) have longer NRLs (∼190–240 bp) (Thomas and Furber, 1976; Weintraub, 1978; Athey et al, 1990; Perisic et al, 2010). Biochemical analysis showed that the average NRL in yeast is quantized following the rule of 10n+5 bp per linker (Lohr, 1981); this feature was also notable in the longer-NRL rat liver and chicken erythrocyte chromatin (Strauss and Prunell, 1983; Lohr, 1986). More recently, genome-wide studies of NRLs in yeast and human cells confirmed the quantized 10n+5 bp spacing between yeast nucleosomes (Wang et al, 2008) and showed that, in human chromatin, active genes have a notably shorter repeat (178 bp) than repressed or heterochromatic non-coding sequences (206 bp) (Valouev et al, 2011).
While changes in the NRL were initially expected to alter the chromatin fibre diameter proportionally to NRL (Athey et al, 1990), more recent electron microscopic studies of linker histone-dependent chromatin compaction by Rhodes and her colleagues revealed two types of chromatin fibre distinguished by a stepwise increase in chromatin diameter from ∼33 nm for chromatin with 177–207 bp linkers to ∼42 nm for 217–227 bp linkers (Robinson et al, 2006). A third type of structure was observed for very short NRLs typical of yeast and neuronal cells (167 bp). Electron microscopic studies showed that, in contrast to the longer arrays, those with a short 167 bp NRL could fold into compact fibres without linker histone (Routh et al, 2008) in agreement with earlier biochemical observations of linker histone-independent compact folding of 167–177 bp NRL arrays (Dorigo et al, 2003; Shogren-Knaak et al, 2006). The folded 167 bp NRL arrays also had a distinct fibre diameter about 21–23 nm with a clear zigzag morphology (Routh et al, 2008) consistent with nucleosome stacking in the tetranucleosome X-ray crystal structure (Schalch et al, 2005).
Due to the helical nature of DNA, smaller alterations to the NRL in the range of several base pairs were predicted to have a strong effect on chromatin fibre folding (Widom, 1992; Woodcock et al, 1993; Leuba et al, 1994; Stehr et al, 2010). Here, we examine whether and how chromatin higher-order folding depends on the internucleosomal rotational setting. This parameter refers to linker DNA length variability under 10.5bp (one turn of the DNA double helix) that is expected to change internucleosomal rotation angle by 36° per 1 bp of DNA length. It is distinct from the more conventional definition of rotational setting as the local orientation of the DNA helix on the histone surface (Jiang and Pugh, 2009), instead referring to the rotational settings relative to adjacent nucleosomes, which may be altered by DNA orientation at the surface and local variations in the linker length.
We show that for rotationally similar nucleosomes with different NRLs, there is a general negative correlation of chromatin compaction with DNA linker length. For long-linker arrays, rotational alterations do not affect chromatin folding. In a striking contrast, for shorter NRLs (165–177 bp), we observed a periodic dependence of chromatin fibre folding upon local rotational variations. Our data thus demonstrate that internucleosomal rotational settings are crucial in determining nucleosome packing of arrays with short linker DNA, while long-linker DNAs accommodate rotational variability without a substantial effect on chromatin folding. Our results suggest that internucleosomal rotational settings play a crucial role in the higher-order structure of chromatin with short NRLs such as those found in the yeast genome (Lohr, 1981; Wang et al, 2008) and in transcriptionally active chromatin of human cells (Valouev et al, 2011).
Results
Nucleosome array folding reflects the intrinsic properties of the underlying NRL
Reconstituted nucleosome arrays with various NRLs were assembled using the clone 601 sequence and histone octamers isolated from chicken erythrocyte nuclei. Since precise histone stoichiometry is crucial for proper folding, it was monitored through several independent techniques. First, to ensure that our arrays were not underloaded, the reconstituted arrays were digested with restriction nucleases into mononucleosomes and assayed by agarose DNP electrophoresis in TAE buffer optimized for resolving mononucleosomes and free DNA. On these gels, the presence of free DNA monomer bands was indicative of underloaded material (arrow on Supplementary Figure S1A). Next, the reconstitutes were analysed using agarose DNP gels in HEPES buffer optimized for oligonucleosome separation. On these gels, smearing of carrier DNA indicated that high-affinity (clone 601) templates had been saturated and excess histones had been bound to the low-affinity carrier DNA (Lane 2, Supplementary Figure S1B). These same gels also allowed us to visualize instances where nucleosome arrays were overloaded with histone octamers through the appearance of additional bands above the main array band (brackets on Supplementary Figure S1B). Based on the preliminary experiments, we reconstituted arrays at a larger scale with a typical yield of 100 μg DNA. Agarose DNP gels in parallel with analytical ultracentrifugation provide an efficient way to monitor histone loading in multiple arrays and prepare homogeneous samples for solution and imaging studies (Figure 1). In these experiments, higher mobility of the main electrophoretic band (black arrow, Figure 1A) and sedimentation coefficients S20,w below 28 S (Figure 1B, top panel) indicated underloading and were discarded. Overloaded samples, which showed additional dimer bands above the main array band (white arrows in Figure 1A), also had additional peaks during ultracentrifugation (white arrows in Figure 1B, middle panel) and were discarded. The optimally loaded arrays (grey arrows, Figure 1A and B) were examined by transmission electron microscopy to confirm full saturation of the nucleosome arrays with the majority of the arrays containing 12 nucleosomes by EM (Figure 1C and D).
Figure 1.

Oligonucleosome reconstitution and characterization. (A) DNP type IV agarose gel in HE buffer, showing reconstituted nucleosome arrays, 169×12 arrays with different histone loadings. Lanes 1–4: 1—DNA molecular weight markers, 2—underloaded (black arrow), 3—overloaded (white arrows), and 4—properly loaded (grey arrow) nucleosome arrays. (B) Distributions of sedimentation coefficients, c(S), for 169×12 arrays with different histone loadings: underloaded (top panel), overloaded (middle panel), and properly loaded (bottom panel) at 0.6 mM MgCl2. (C) Electron micrograph (uranyl acetate staining, dark-field imaging) of 207×12 core arrays (top panels) and 167×12 core arrays (bottom panels) fixed at 5 mM NaCl. (D) Histograms showing distribution of nucleosome arrays containing a certain number of nucleosomes per array calculated from several EM fields of 207×12 arrays (top panel) and 167×12 arrays (bottom panel).
The homogeneity and extent of nucleosome array folding for arrays with different NRLs were assayed by sedimentation velocity analysis using the continuous c(S) distribution model (Schuck, 2000) as well as by the boundary analysis of van Holde and Weischet, 1975. For highly homogeneous samples of 167×12 and 207×12 arrays, we observed that the main boundary positions in van Holde–Weischet plots are fully consistent with the main peaks in the c(S) distribution (cf. Figure 2A and B to Supplementary Figure S2A) showing a dramatic difference in sedimentation (36 versus 52 S) at 1 mM MgCl2. We also observed that c(S) analysis was very efficient in resolving sedimentation distribution in heterogeneous systems (cf. Figure 2C to Supplementary Figure S2B). Therefore, we applied the c(S) method for sedimentation analysis of all heterogeneous samples including those partially self-associated due to overloading or excessive ionic strength as well as intentionally heterogeneous samples throughout this work.
Figure 2.

Nucleosome array folding depends upon the intrinsic properties of the underlying NRL. (A–C) Distribution of sedimentation coefficients, c(S), for 167×12 (A), 207×12 (B), and the 167/207×12 coreconstitute (C) at 1 mM MgCl2. (D–F) Electron micrographs of 167×12 (D), 207×12 (E), and the 167/207×12 coreconstitute (F) at 1 mM MgCl2 showing different degrees of compaction.
To independently verify that the observed differences in folding, such as those between arrays with NRLs of 167 and 207 (Figure 2A and B), were not due to variations in histone loading, chromatin arrays were reconstituted with an equimolar mixture of each of 167×12 and 207×12 DNA templates and core histones in the same dialysis bag. These coreconstitutes were then assayed for folding in sedimentation velocity experiments on the analytical ultracentrifuge. The coreconstitutes formed two distinct peaks, indicating two types of particles with different folding extents (Figure 2C), with each one of these double peaks corresponding to the single peak of the uniform array in Figure 2A and B. EM imaging of the 167×12/207×12 coreconstitute further confirms the presence of two distinct states of chromatin folding for 167×12 and 207×12 arrays (Figure 2D and E), as both compact and open arrays are seen in the coreconstituted sample (Figure 2F).
NRL with fixed rotational setting is negatively correlated with chromatin folding
We constructed and characterized a series of nucleosome core arrays in which the NRL was altered so that due to the 10.5 bp periodicity of DNA, the arrays were expected to maintain the same rotational settings. As such, reconstituted 12-mer chromatin arrays were assembled with NRLs of 167, 177, 188, or 209 bp. While the sedimentation peaks observed at 5 mM NaCl had very similar distributions of sedimentation coefficients around 30 S as expected for unfolded nucleosome arrays (Figure 3A), upon the induction of chromatin folding by 60–150 mM NaCl or 0.6–2 mM MgCl2, we observed a notable increase in sedimentation velocity for all samples (Figure 3B and C and Supplementary Table S3). Remarkably, the salt-dependent increase in S values was much stronger for shorter NRLs—about 20 S for 167×12 compared to a moderate increase of about 5 S for 209×12 at 1 mM MgCl2. This result is consistent with the strong salt-dependent folding previously reported for 167 versus 197 (Routh et al, 2008) and 167 versus 207 (Grigoryev et al, 2009) arrays at the same ionic strength. Now we observed a clear negative correlation between the NRL and the degree of nucleosome array compaction for a range of monovalent and divalent cation concentration known to support compact folding of the nucleosome arrays.
Figure 3.

Dependence of chromatin compaction upon NRL for nucleosome arrays with constant internucleosomal rotations. Distribution of sedimentation coefficients, c(S), for 12-mer oligonucleosome core arrays with NRL of 167, 177, 188, and 209 bp at 5 mM NaCl (A), 150 mM NaCl (B), and 1 mM MgCl2 (C).
Rotational variations do not alter folding for chromatin arrays with long NRL
While native chromatin species have NRLs differing ±2 to ±4 from the average repeat lengths (Strauss and Prunell, 1982; Widom, 1992), most experiments with reconstituted nucleosomal arrays employed nucleosomal DNA templates with uniform NRLs. To explore the importance of local variations in the internucleosomal rotations mimicking native chromatin for chromatin folding, we constructed and characterized 12-mer arrays (205–207–209)×4 and (205–209)×6, in which the NRL varied in a defined manner by either ±2 bp or ±4 bp, respectively. These arrays were expected to show structural variations reflecting local changes in the internucleosomal rotation angle (Woodcock et al, 1993). However, for neither of these reconstitutes did we observe any significant difference in chromatin folding between the uniform (207×12) and variable (±2 or±4 bp) arrays at any of the ionic conditions tested (Table I, Supplementary Figure S3A).
Table 1. Linker length variations do not affect chromatin folding for uniform and variable 12-mer arrays with long NRLs.
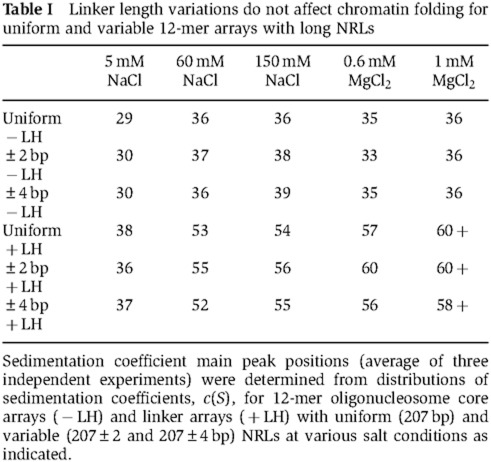
Sedimentation coefficient main peak positions (average of three independent experiments) were determined from distributions of sedimentation coefficients, c(S), for 12-mer oligonucleosome core arrays (−LH) and linker arrays (+LH) with uniform (207 bp) and variable (207±2 and 207±4 bp) NRLs at various salt conditions as indicated.
Next, the folding of uniform and variable arrays was assayed in the presence of linker histone H5, which is known to be important for the complete folding of nucleosome arrays with 207 bp NRL (Carruthers et al, 1998). As expected, the addition of linker histone increased the sedimentation coefficients to ∼55–60 S in the presence of MgCl2; however, the uniform and variable arrays again had similar sedimentation coefficients both in the presence and absence of linker histone H5 (Table I, Supplementary Figure S3B).
To confirm the absence of size dependence of nucleosome folding in our reconstituted arrays, the uniform and ±4-bp arrays were doubled in length to form 24-mer arrays, which were again assayed for folding. There were no significant differences in folding between the uniform and variable 24-mer arrays in either the core arrays or in those containing linker histone H5 (Supplementary Table S2). These results clearly demonstrate that the uniform and variable arrays with net 207 bp NRL are completely folded into the chromatin fibre in the presence of linker histone and that the degree of their folding is independent of internucleosomal rotational settings.
Internucleosomal rotational variations affect folding in chromatin arrays with short NRL
Next, we asked whether uniform arrays with altered rotational settings would follow a similar pattern of increased NRL leading to decreased S values. To test this, we employed 12-mer core arrays with repeats of 165, 169, 172, 200, 205, and 207 bp, that is, NRL values intermediate between those explored above (167, 177, 188, and 209). Within each array, the rotational setting is constant, but is different relative to the other arrays because the NRL changes are not in increments of DNA helical periodicity (10.5 bp). If the rotational settings did not affect chromatin folding, then we expected the compaction of the nucleosome arrays with intermediate NRLs to fall between the values obtained for arrays with the nearest longer and the nearest shorter NRLs. Indeed, as seen in Figure 4A and B and Supplementary Table S3, we found that core arrays with NRL of 200 bp have similar folding to arrays with NRL of 188 bp (∼38–40 S), and the 205-bp arrays were similar to 207 bp (∼35–36 S).
Figure 4.

NRL variations affect chromatin folding but not self-association. (A) Graphic plotting of main sedimentation coefficient peaks in c(S) distribution (average of three independent experiments) for 12-mer oligonucleosome core arrays with varying NRL (165,167,169, 172, 177, 188, 200, 205, 207, and 209 bp) at 5 mM NaCl, 60 mM NaCl, or 150 mM NaCl. Student’s t-test P-values for significant differences between the data sets are shown over the brackets. (B) Graphic plotting of main sedimentation coefficient peaks in c(S) distribution (average of three independent experiments) for 12-mer oligonucleosome core arrays with varying NRL (165, 167, 169, 172, 177, 188, 200, 205, 207, and 209 bp) at 0.6 mM MgCl2, 1 mM MgCl2, or 2 mM MgCl2. (C) Histograms of the concentration of MgCl2 (average of three independent experiments) that results in 50% precipitation of material for arrays with varying NRL.
Surprisingly, in a sharp contrast to the apparently similar folding of the longer-NRL arrays, the shorter arrays displayed strong NRL-dependent structural deviations. Figure 4A and B shows that 172×12 array was dramatically unfolded, with sedimentation coefficient values of 41 S in 150 mM NaCl and 38 S in 1 mM MgCl2, compared to the 167×12 and 177×12 arrays, which have sedimentation coefficients at about 48–54 S under those conditions. The 165×12 and 169×12 arrays showed intermediate folding with S values distributed around 43–47 S in either 150 mM NaCl or 1 mM MgCl2. The NRL-dependent periodic changes of chromatin compaction were also observed for a wider range of Mg2+ concentrations—between 0.6 and 2 mM (Figure 4B). These data show that the unfolded short-NRL arrays (165 and 169) and, especially, the intermediate NRL arrays (188 and 200 bp) undergo additional compaction at 2 mM MgCl2. Sedimentation of neither the most folded or unfolded arrays with short NRLs (167, 172, and 177) nor the unfolded arrays with long NRLs was significantly affected by increased Mg2+, showing that the divalent cation may partially curb the difference between NRLs 165, 167, and 169, but cannot fold the most open arrays (unlike linker histone in experiments shown in Figure 5 below). These results, together with sedimentation analysis of the longer-NRL nucleosome arrays facilitated by linker histone (Table I), show that the internucleosomal rotational settings have a strong periodical effect on chromatin folding for nucleosome core arrays with short NRLs (167–177 bp) but not for the long (>200 bp) NRLs. Our findings are consistent with recent modelling studies predicting a stronger counterion requirement for packing the longer and more negatively charged linkers (Perisic et al, 2010), and the linker DNA geometry being most important for folding of the nucleosome arrays with short NRL (see Discussion).
Figure 5.

A 5-bp difference in linker DNA length destabilizes chromatin folding for short NRLs. (A–D) Distribution of sedimentation coefficients, c(S), at 1 mM MgCl2 for separately analysed 167×12 and 172×12 core arrays (A), 167/172×12 coreconstitute (B), 167×12 reconstituted with and without linker histone (C), and 172×12 reconstituted with and without linker histone (D). (E–G) Electron micrographs of 172×12 core arrays at 5 mM NaCl (E) and 172×12 (F) and 167×12 (G) at 1 mM MgCl2 showing different degrees of compaction. EM magnification 42K. (H) Histogram showing particle size distribution of 167×12 arrays (white columns) and 172×12 arrays (black columns) condensed in 1 mM MgCl2. The inset shows average particle size measured at the Y-axis and X-axis for the 167×12 arrays and 172×12 arrays. Error bars in the inset represent s.d.’s. (I, J) Electron micrographs of 167×12 and 172×12 core arrays at 1 mM MgCl2 showing different degrees of compaction. The samples were contrasted by platinum shadowing. EM magnification 110K.
Nucleosome array self-association does not depend upon the NRL
In addition to chromatin folding (secondary chromatin structure), chromatin fibres are compacted by self-association (tertiary chromatin structure) (Woodcock and Dimitrov, 2001; Luger and Hansen, 2005). To examine whether NRL variations affect chromatin tertiary structure, we monitored the extent of self-association for the various constructs differing in NRL by magnesium-dependent self-association assays (Schwarz et al, 1996). We observed that wide changes in NRL, including those that significantly affected chromatin folding, did not notably alter self-association rates, with most chromatin arrays having 50% precipitation between 3.0–3.5 mM MgCl2 (Figure 4C). It thus appears that nucleosome self-association is not affected by the broad range of NRLs, suggesting that neither general NRL nor its local rotational variations can notably affect formation of tertiary chromatin structures.
While chromatin precipitation by low-speed centrifugation is typically employed to determine chromatin self-association (Schwarz et al, 1996), we noticed that under certain conditions analytical ultracentrifugation can be successfully used to assay the initial steps of self-association in solution resulting in array dimerization (tertiary structures). The dimers appear as a ‘second peak’, running at 90 S (or above). This peak is most commonly observed on arrays with NRLs ∼207 bp in the presence of linker histone H5 and 1 mM MgCl2. Using this approach, we also did not observe any significant differences in Mg-dependent formation of the 90 S peak between the 207×12 uniform array and the variable ±2- or ±4-bp arrays (Supplementary Figure S3B, bottom), confirming the results of the precipitation assay.
Intrinsic properties of the short-NRL DNA templates determine nucleosome array folding
After observing periodic modulations in chromatin folding for the short-NRL arrays, we also wished to independently verify that these differences were not due to variations in histone loading. Therefore, we assembled nucleosome reconstitutes with a mix of 167×12 and 172×12 DNA templates. These coreconstitutes were then assayed for folding by sedimentation velocity experiments on the analytical ultracentrifuge and by transmission EM. The coreconstitutes formed two distinct peaks at 1 mM MgCl2, indicating two samples with different folding extent (Figure 5B), with each one of these double peaks corresponding to the single peak of the 167×12 or 172×12 uniform array (cf. panels A and B in Figure 5). EM imaging (42K magnification) of the 172×12 in the unfolded state (Figure 5E) as well as 172×12 and 167×12 arrays folded at 1 mM MgCl2 (Figure 5F–H) confirms the notably larger diameters of 172×12 arrays at 1 mM MgCl2. This difference is also observed in the EM images of platinum-shadowed samples obtained at 110K magnification (Figure 5, cf. panels I and J).
We next asked whether the addition of linker histone, which is required to stabilize compact folding (>50 S) of nucleosome arrays with longer NRLs (Carruthers et al, 1998; Routh et al, 2008), would also promote the folded state of the short-NRL arrays. In this set of experiments, we added linker histone H5 to 167×12 and 172×12 arrays and observed that H5 induced only minor increases in the already folded 167×12 (52–55 S, Figure 5C), consistent with previous findings by Routh et al (2008). Strikingly, adding linker histone caused a dramatic increase in 172×12 sedimentation from 38 to 55 S in 1 mM MgCl2 (Figure 5D). It thus appears that certain short NRLs can be completely folded by linker histone, suggesting that short NRLs following the 10n+5 rule impose an architectural factor-dependent folding on the overlaying chromatin fibre. In contrast, the short NRLs containing an integer number of linker DNA turns (such as 167×12 and 177×12) promote compact folding independently of the architectural proteins.
Discussion
Arrays of positioned nucleosomes with regular NRLs are widely used in the studies of chromatin higher-order structure. However, nucleosomes are mobile on native DNA (Flaus-Owen-Hughes, 2003) as most native DNA sequences do not bind or position histone octamers as tightly and precisely as they bind to the clone 601 sequence and other strong positioning templates (Lowary and Widom, 1998) utilized in most recent experiments. As such, the NRL is not uniform within native chromatin, but rather contains variations around well-defined average peaks with 10 bp intervals ±2 bp (Widom, 1992). Several models have directly suggested a dependence of chromatin higher-order structure on the internucleosomal rotational variations (Widom, 1992; Woodcock et al, 1993; Leuba et al, 1994; Stehr et al, 2010). This raises the question of whether the regular arrays fold into higher-order structures similar to native chromatin. Our experiments with uniform (207×12) and variable (207±2 and ±4 bp) nucleosome arrays clearly showed that these arrays exhibited similar compaction whether they were in unfolded, partially folded, or completely folded states (Table I and Supplementary Figure S3). Thus, our results imply that nucleosome linkers are flexible enough to be independent from the rotational settings for the NRLs of around 200 bp so that previous biochemical experiments with regular repeats, as well as computative modelling conducted by us and other groups, adequately reproduce native chromatin states for long NRLs typical of differentiated tissues.
How does the compact chromatin fibre accommodate internucleosomal rotational variability? One explanation was provided by X-ray crystal studies showing that nucleosome core DNA contains four superhelical locations where the DNA major grooves may be stretched or compressed to incorporate 5 or 6 bp (Richmond and Davey, 2003; Makde et al, 2010) so that linker DNA length variations of 4 bp might be absorbed by nucleosome core. If this was indeed happening in solution, then we would expect that linker DNA length difference of 2–4 bp has no effect on chromatin folding. However, our experiments showing periodic dependence of the short-NRL array conformation upon linker DNA lengths (Figures 4 and 5) argue against absorbing the NRL variations by the core DNA as the ability to stretch and absorb linker variations should be the same for the short and long NRLs. On the other hand, our recent computative modelling and EM experiments showed that compact chromatin fibres packed with linker histones incorporate conformationally heterogeneous DNA linkers (Grigoryev et al, 2009). This conformational heterogeneity can readily explain the independence of chromatin folding on rotational settings for long nucleosomes.
The most striking result of our work is that the shortest NRLs confer a strong dependence of nucleosome folding upon small rotational variations. To further explore the mechanism of the different folding capabilities of the 167 and 172 NRLs, we constructed dinucleosome molecular models based on the nucleosome core structure taking 145 bp of clone 601 nucleosome (Makde et al, 2010) pdb ref# 3MVD, to which we added either 22 or 27-bp linker DNA (from pdb ref#1ZBB). The models of the 167 and 172 dinucleosomes (Figure 6) show that the internucleosomal rotational setting change resulting from the 5 bp NRL difference leads to a striking contrast in the linker DNA spatial positions. While the DNA linkers in the 167 bp dinucleosomes are well separated in space (Figure 6A and B), the 172 bp dinucleosome brings its linkers to an immediate proximity if the linker DNA contains no structural deviations such as DNA bending and twisting (Figure 6D and E).
Figure 6.

Molecular modelling shows the proposed effect on chromatin folding of the 5-bp difference in the NRL between the 167 bp and 172 bp repeats. (A, B) Molecular model of the dinucleosome with NRL 167 (X–Y and Z–Y planes are shown) was constructed using UCSF Chimera (http://plato.cgl.ucsf.edu/chimera/) based on 147 bp from the clone 601 nucleosome core structure PDB 3MVD for the nucleosome after removing RCC protein from the file. For adding linker DNA, we used a DNA fragment containing base pairs DG345I/DC3J through DC336I/DG12J from PDB 1ZBB and aligned multiple copies in three-dimensional space to get the 20-bp linker length and 167 bp NRL. (C) A flexible wire model for DNA geometry in a compact tetranucleosome with NRL 167. The dashed lines show the 30-nm fibre axis. The arrows show the points of contact that limit the longitudinal compaction of the fibre. (D–E) Molecular model of the dinucleosomes with NRL 207 based on 147 bp from the clone 601 and constructed as in panels A–B but adding 25-bp linker DNA to get 172 bp NRL. (F) A flexible wire model for DNA geometry in a compact tetranucleosome with NRL 172. The dashed line and the arrow indicate the fibre axis and the points of contact as in panel C.
Recent crystal study of the clone 601 nucleosome showed that its core constrains 145 bp of DNA (Makde et al, 2010) implying that in solution the core DNA may additionally incorporate 2 bp from the linker. In that case, the internucleosomal rotational angle would differ by 72° from the one shown on Figure 6. However, we found that a spatial model recapitulating the DNA path in the 167-bp NRL array and based on the clone 601 nucleosome core containing 145 bp DNA (Makde et al, 2010) allows this repeat to be easily folded in a conformation-promoting stacking of the nucleosome discs (Figure 6C). The predicted size and shape of the most compact 12-mer array with 167 bp NRL (Supplementary Figure S4A) are consistent with high-resolution EM images of the 167 NRL repeats (Routh et al, 2008) and Figure 5I as well as with the tetranucleosome crystal structure (Schalch et al, 2005). The agreement between our models and the experiments argues that the actual DNA conformation in the 167×12 nucleosome arrays is similar to that of its crystal form.
In striking contrast, for similar models but with a 172 bp repeat (Figure 6F and Supplementary Figure S4B), we noticed that the topology of the DNA chain does not allow the nucleosome discs to be brought into the close contacts needed for stacking. Specifically, the nucleosome linkers in the folded 172×4 structure comes to a very close proximity between themselves and limit the array’s folding (arrow on Figure 6F) consistent with our high-resolution EM data clearly showing an incomplete, uneven packing of the 172 bp repeats (Figure 5J). This result agrees with recent modelling studies predicting a stiff and open conformation for a 173-bp NRL repeat (Perisic et al, 2010) and by Scipioni et al (2010) suggesting that excluded volume at the linker crossing and torsional energy are both limiting factors for close packing of nucleosomes. It also predicts strong peaks of torsional energy at 162 and 172 bp with a valley at 167 bp (Scipioni et al, 2010). The fact that linker histone promotes the folding of the 172-bp array more strongly than that of the 167-bp array (Figure 5C,D) while increased MgCl2 levels cannot fold the 172 repeat (Figure 4B) confirms that linker DNA geometry rather than electrostatic charge is the main obstacle to complete folding of the 172-bp arrays.
Earlier biochemical experiments (Lohr, 1981) and recent sequencing of positioned yeast nucleosomes (Wang et al, 2008) both showed that linker DNA is preferentially quantized with a linker length of 10n+5 bp, making the 162- and 172-bp NRLs predominant in yeast. According to our structural experiments, this indicates that the yeast genome evolved to maintain its chromatin in an open configuration similar to the one observed for the 172-bp NRL. This is consistent with the generally open structure of the yeast genome with very low levels of linker histone and about two nucleosomes per unit length found by in vivo mapping of chromatin interactions through crosslinking analysis (Dekker, 2008).
Our results clearly demonstrate that for a broad range of nucleosome arrays with different NRLs, only a subset of short nucleosome arrays with optimal NRLs such as 167 and 177 bp can completely fold at physiological ionic conditions (Figure 3B,C), consistent with previous observations for 167 (Routh et al, 2008; Grigoryev et al, 2009) and 177 bp (Dorigo et al, 2004; Shogren-Knaak et al, 2006) repeats. At first glance, this result seems surprising as the increase in DNA linker length usually accompanies chromatin condensation (Thomas and Furber, 1976; Weintraub, 1978; Athey et al, 1990; Perisic et al, 2010). However, there also exists a trend where differentiated cells with specialized gene expression patterns tend to have, in addition to longer NRLs, increased linker histone levels (Weintraub, 1978; Pearson et al, 1984; Woodcock et al, 2006). It is now clear that the addition of linker histone is capable of compensating for decreased folding of the long-NRL arrays (Routh et al, 2008; Grigoryev et al, 2009) as well as the shorter-NRL arrays with unfavourable nucleosomal rotations (Figure 5). We expect that identification of the NRLs inhibiting chromatin folding and constructing the set of native-like nucleosome array templates described here will provide valuable tools for experimental and modelling studies of chromatin higher-order structure and interactions with chromatin architectural factors.
Most recently, high-throughput genomic maps of nucleosome positions in the human genome revealed that transcriptionally active genes have a notably shorter repeat (178 bp) than repressed or heterochromatic non-coding sequences (206 bp) (Valouev et al, 2011). Our findings, together with the newly estimated NRLs of transcribed genes, provide an explanation for the paradoxical observations of relatively condensed conformation of transcriptionally active chromatin (Hu et al, 2009) despite lower levels of linker histone (Kamakaka and Thomas, 1990) as well as its shorter retention time on the nucleosomes (Misteli et al, 2000). Our data imply that the shorter 10n NRL close to the 178 bp in active genes would maintain a relatively compact conformation independent of architectural factors. Moreover, we predict that the higher-order structure of 10n repeats that includes strong internucleosomal stacking (Figure 6C) would be especially receptive to regulation by histone H4-K16 acetylation that is known to inhibit internucleosomal stacking (Shogren-Knaak et al, 2006; Allahverdi et al, 2011).
Finally, the observation that the 172×12 array with unfavourable rotational settings requires linker histone (Figure 5) rather than MgCl2 (Figure 4B) for complete folding shows that architectural protein factors may be necessary for the folding of specific short NRLs following the 10n+5 rule. For example, the predictably unfavourable neuronal NRL of 162 bp (Pearson et al, 1984) seems to contain an anomalously high concentration of linker histone for this given repeat (see Figure 1 in (Woodcock et al, 2006)). Yeast chromatin may be folded at certain heterochromatic loci by special architectural proteins such as Sir3 (McBryant et al, 2008). It thus appears that specific NRLs may direct chromatin structure into either a charge-dependent folding typical of short 10n NRLs or, alternatively, into an architectural factor-dependent plastic folding typical of short 10n+5 repeats in yeast or longer NRLs in higher eukaryotes. There is little doubt that future genome-wide studies will continue to provide more examples of specific nucleosomal positioning whose structural significance could be revealed by systematic studies in biochemically defined reconstitution systems.
Materials and methods
Nucleosome positioning templates and arrays
DNA templates were designed using clone 601 DNA (Lowary and Widom, 1998), which positions nucleosomes with single-nucleotide precision, and adding specific lengths of linker DNA (Supplementary Table S1). Templates were first designed as monomers with the length of linker DNA altered through primer modification PCR. Regardless of linker DNA length, all monomeric templates were designed with XbaI restriction sites at the 5′-end and SpeI and SphI sites at the 3′-end. Monomeric templates were ligated into the pUC19 vector, transformed into Escherichia coli DH5α (Invitrogen, #18265-017), and grown in the presence of carbenicillin. Expansion into a 12-mer template was achieved through a stepwise approach in which monomer plasmids were digested using either SpeI and SphI to yield vectors containing monomers, or XbaI and SphI to yield monomeric inserts. Upon ligation of monomeric insert to the vector already containing one copy of the nucleosome positioning template, the SpeI sites of the vectors and the XbaI sites of the inserts were both abolished. This process was repeated until constructs existed as 12-mers.
Once the positioning templates were constructed in pUC19 plasmids, they were transformed into E.coli and grown in ∼2 l of media supplemented with carbenicillin. Plasmids were isolated using large-scale alkaline lysis procedures (Birnboim and Doly, 1979). All our plasmids were subsequently digested from the vector backbone using the restriction endonucleases XbaI and HindIII. The vector backbone was digested into smaller fragments (1120, 862, 692, and 19 bp) using DraI to serve as a carrier DNA (see reconstitution procedure). The only exceptions were 200×12, which used XbaI and KpnI, and 177×12, which used EcoRV to excise the template.
Histone octamer isolation and purification
Core histone octamers were isolated from chicken erythrocyte nuclei by the selective removal of histones through ultracentrifugation under increasing ionic strength as described (Grigoryev et al, 2009), and then loaded on a 5–30% sucrose gradient in 2 M NaCl–10 mM HEPES–0.1 mM EDTA buffer. Sucrose gradients were spun on the ultracentrifuge in a Beckman SW41Ti swinging bucket rotor, 4 °C, 38 000 r.p.m., for 48 h. After centrifugation, the gradient was divided into 1-ml fractions that were analysed by SDS–PAGE. Fractions containing equimolar amounts of core histone proteins were dialyzed against buffer (10 mM HEPES, 2 M NaCl, and 0.1 mM EDTA) for ∼36 h to remove sucrose and stored at −10 °C.
Linker histone isolation
The supernatant from the 0.65-M centrifugation was used for linker histone isolation through ion exchange chromatography. The procedure used a 1-ml High Trap Sp Hp ion exchange column (GE Healthcare) equilibrated with buffer A (20 mM HEPES, 50 mM NaCl, 0.02% sodium azide, 0.5 mM PMSF, pH=7.5) and eluted using a two-step gradient with buffer B (20 mM Hepes, 1.5 M NaCl, 0.02% sodium azide, pH=7.5), with 0–33% buffer B over 5 column volumes, and 33–100% buffer B over 35 column volumes. H5 fractions were dialyzed ∼12 h against buffer (10 mM HEPES, 50 mM NaCl, 0.1 mM EDTA, pH=7.5) and stored at 4 °C.
Oligonucleosome array reconstitution
Reconstituted 12-mer (and 24-mer) arrays were assembled using DNA templates (described above) and chicken erythrocyte histones. Reconstitutions were performed essentially as described in (Springhetti et al, 2003), but in the presence of carrier DNA (Huynh et al, 2005) to ensure proper loading. The carrier DNA was created through digestion of pUC19 vector backbone by DraI, and used at a template:carrier ratio of 2:1. Core histones and purified DNA were combined in a final mixture containing 2 M NaCl and 1 mM PMSF. Samples were dialyzed in 3500 MWCO membranes against buffer (2 M NaCl, 10 mM HEPES, 0.2 mM EDTA, 0.1% NP-40, 5 mM β-mercaptoethanol, pH=7.5) for 2 h. The salt was then lowered to 1.5 M NaCl and dialyzed for 2 h, followed by dialysis against 1 M NaCl for 3 h, and a 0.75 M NaCl dialysis for 3 h (all other buffer component concentrations were kept constant). The salt concentration was then decreased to 0.5 M NaCl and dialyzed ∼18 h. Reconstitutes were next dialyzed against a buffer containing 5 mM NaCl, 10 mM HEPES, 0.2 mM EDTA, 0.1% NP-40, 5 mM β-mercaptoethanol, pH=7.5, for 3 h. Then the buffer was changed to one lacking NP-40 (all other buffer components remained the same) and dialyzed for an additional 3 h to remove NP-40. The reconstituted core arrays were then quantified by spectrophotometry (A260 nm) measurements, run on 1% Type IV agarose (DNP) gels to ensure proper histone loading, and assayed through SDS–PAGE to ensure integrity of core histones.
In instances where linker histone is added to the chromatin arrays, additional reconstitutions were performed by mixing reconstituted core arrays with linker histone H5 at a molar ratio of one molecule H5 per nucleosome and dialyzing against 500 mM NaCl, 0.1 mM PMSF, and 0.025% NP-40 using 3500 MWCO membranes for 2 h at 4 °C, followed by ∼18-h dialysis against 5 mM NaCl, 10 mM HEPES, 0.1 mM EDTA, 0.025% NP-40, pH=7.5 buffer, followed by a 4-h dialysis against 5 mM NaCl, 10 mM HEPES, 0.1 mM EDTA, pH=7.5, to remove NP-40. The linker arrays were then removed from dialysis, 0.1 mM PMSF was added, A260 nm measurements were taken, and samples were stored at 4 °C.
Carrier DNA was removed from reconstituted arrays through purification on a 5–25% sucrose gradient in the following buffer: 10 mM Tris, 1 mM EDTA, 0.5 mM PMSF, and centrifuged at 35 000 r.p.m., 4 °C, for 8 h on the ultracentrifuge in the Beckman SW41Ti swinging bucket rotor. After centrifugation, samples were divided into 1-ml fractions and analysed on a 1% agarose gel, and fractions containing arrays lacking carrier DNA were dialyzed against 10 mM HEPES, 5 mM NaCl, 0.1 mM EDTA, pH=7.5, for ∼36 h to remove sucrose. Samples were analysed by SDS–PAGE to confirm histone integrity.
Analytical ultracentrifugation
The extent of nucleosome array folding was assayed through sedimentation velocity experiments on the analytical ultracentrifuge (Beckman Optima XL-A) (Carruthers et al, 2000). Chromatin arrays with A260 nm=0.5 OD were run in buffer containing 10 mM HEPES, 0.1 mM EDTA, pH 7.5 under varying ionic strength conditions (5 mM, 60 mM, 150 mM NaCl and 0.6 mM, 1 mM, 2 mM MgCl2). Scan data were collected using ProteomeLab XL-A, at a wavelength of 260 nm while samples were spun at 20 000 r.p.m., at 20 °C, for∼2.5 h. Data analysis from the analytical ultracentrifuge runs was carried out using the continuous c(S) distribution model of the SEDFIT software (Schuck, 2000). (http://www.analyticalultracentrifugation.com). Boundary analysis was also conducted by the method of van Holde and Weischet (van Holde and Weischet, 1975) using the program Ultrascan II (http://www.ultrascan2.uthscsa.edu/).
Electrophoretic techniques
Low electro-endo osmosis agarose gels of 1% (Lonza SeaKem LE agarose, #50002) in TAE buffer (BioRad #161-0743) were used to visualize histone-free DNA. Gels were run for 40 min at 80 V. Medium electro-endo osmosis Type IV agarose (Sigma-Aldrich #A3643) was used to analyse oligonucleosome reconstitutes by DNP (deoxynucleoprotein) electrophoresis. For these gels, Type IV agarose was dissolved in HE buffer (20 mM HEPES, 0.1 mM EDTA) at a concentration of 1%. These gels were run at 80 V for 70–80 min and stained with ethidium bromide. Type IV agarose (Sigma-Aldrich #A3643) gels were also used to analyse mononucleosomes and free DNA resulting from test restriction digestions of oligonucleosome reconstitutes. For these gels, Type IV agarose was dissolved in TAE buffer at 1% concentration. The gels were run at 80 V for 70–80 min. All agarose gels were stained with ethidium bromide (∼1 μg/ml) for 30 min before imaging.
Polyacrylamide gels were run throughout the experiments with nucleosome arrays to assay the stability and/or concentration of histones. These gels were typically 15% acrylamide with 1 mm thickness. For gels where band quantification was required, the NIH program Image J was used (http://rsbweb.nih.gov/ij/). Gel bands were marked using the rectangular selection tool and, for each lane, a background reading was taken from the area above the band and subtracted from the measured band intensity. In the case of magnesium precipitation assays, relative band intensities were averaged from a minimum of three gels.
Self-association assay
The extent of self-associated material was assayed through selective precipitation in magnesium similar to (Schwarz et al, 1996). Arrays with A260 nm=0.5 were incubated with increasing concentrations of MgCl2 (Sigma-Aldrich, #M1028-1 ml) for 20 min on ice. The reactions were then centrifuged at 12 000 r.p.m., 4 °C, for 10 min. Supernatants were removed and loaded on a 1% agarose gel, while pellets were resuspended in 25% glycerol, 50 mM EDTA, 0.5% SDS, and loaded on a 1% agarose gel. The percentage of DNA in the supernatant was determined by DNA band quantification using Image J software. The concentration of magnesium at which 50% of the reconstituted chromatin was precipitated was reported.
Electron microscopy
EM samples were made with ∼25 μl of reconstituted arrays with A260 nm between 0.5–2.5 OD. Arrays were incubated at various salt conditions (5 mM NaCl, 150 mM NaCl, or 1 mM MgCl2), and 0.1% glutaraldehyde at 4 °C for ∼5 h, followed by ∼12-h dialysis against buffer (10 mM HEPES, 5 mM NaCl, 0.1 mM EDTA, pH=7.5) at 4 °C using 10 000 MWCO membranes. Specimens were diluted 10–20 times with 50 mM NaCl and applied to carbon-coated and glow-discharged EM grids (T1000-Cu, Electron Microscopy Sciences). Grids were stained with 0.04% uranyl acetate. For EM images (indicated in the figures), the uranyl acetate-stained grids were dried under high vacuum in a turbo-pumped evaporator (BA080, Baltec Inc., Hudson, NH) and shadowed with platinum at an angle of 10° as we described (Springhetti et al, 2003). Dark-field images were obtained and digitally recorded as before (Grigoryev et al, 2009), and also using a JEM-1400 electron microscope (JEOL USA, Peabody, MA) at 120 kV with SC1000 ORIUS 11 megapixel CCD camera (Gatan Inc. Warrendale, PA).
Supplementary Material
Acknowledgments
We thank Sangita Chakraborty and undergraduate interns at Penn State College of Medicine, Hershey: Jason Richards, Neihl Williamson, Adrienne Baksi, Michael Freiberg, and Monica Kriete for experimental assistance. We are thankful to J Widom for clone 601 DNA and discussing the internucleosome rotational experiments, and to C Woodcock for advice on electron microscopy. We thank R Myers for technical assistance with electron microscopy at Penn State Hershey Imaging Facility. This work was supported by NSF grant MCB-1021681 to SA Grigoryev and AHA pre-doctoral graduate fellowship 0815402D to SJ Correll.
Author contributions: SA Grigoryev designed the experiments, SJ Correll, MH Schubert, and SA Grigoryev performed the experiments and analysed the data, SJ Correll and SA Grigoryev wrote the manuscript, and MH Schubert edited the manuscript.
Footnotes
The authors declare that they have no conflict of interest.
References
- Allahverdi A, Yang R, Korolev N, Fan Y, Davey CA, Liu CF, Nordenskiold L (2011) The effects of histone H4 tail acetylations on cation-induced chromatin folding and self-association. Nucleic Acids Res 39: 1680–1691 [DOI] [PMC free article] [PubMed] [Google Scholar]
- Athey BD, Smith MF, Rankert DA, Williams SP, Langmore JP (1990) The diameters of frozen-hydrated chromatin fibers increase with DNA linker length: evidence in support of variable diameter models for chromatin. J Cell Biol 111: 795–806 [DOI] [PMC free article] [PubMed] [Google Scholar]
- Birnboim HC, Doly J (1979) A rapid alkaline extraction procedure for screening recombinant plasmid DNA. Nucleic Acids Res 7: 1513–1523 [DOI] [PMC free article] [PubMed] [Google Scholar]
- Carruthers LM, Bednar J, Woodcock CL, Hansen JC (1998) Linker histones stabilize the intrinsic salt-dependent folding of nucleosomal arrays: mechanistic ramifications for higher-order chromatin folding. Biochemistry 37: 14776–14787 [DOI] [PubMed] [Google Scholar]
- Carruthers LM, Schirf VR, Demeler B, Hansen JC (2000) Sedimentation velocity analysis of macromolecular assemblies. Methods Enzymol 321: 66–80 [DOI] [PubMed] [Google Scholar]
- Dekker J (2008) Mapping in vivo chromatin interactions in yeast suggests an extended chromatin fiber with regional variation in compaction. J Biol Chem 283: 34532–34540 [DOI] [PMC free article] [PubMed] [Google Scholar]
- Dorigo B, Schalch T, Bystricky K, Richmond TJ (2003) Chromatin fiber folding: requirement for the histone H4 N-terminal tail. J Mol Biol 327: 85–96 [DOI] [PubMed] [Google Scholar]
- Dorigo B, Schalch T, Kulangara A, Duda S, Schroeder RR, Richmond TJ (2004) Nucleosome arrays reveal the two-start organization of the chromatin fiber. Science 306: 1571–1573 [DOI] [PubMed] [Google Scholar]
- Flaus A, Owen-Hughes T (2003) Dynamic properties of nucleosomes during thermal and ATP-driven mobilization. Mol Cell Biol 23: 7767–7779 [DOI] [PMC free article] [PubMed] [Google Scholar]
- Fussner E, Ching RW, Bazett-Jones DP (2011) Living without 30nm chromatin fibers. Trends Biochem Sci 36: 1–6 [DOI] [PubMed] [Google Scholar]
- Grigoryev SA, Arya G, Correll S, Woodcock CL, Schlick T (2009) Evidence for heteromorphic chromatin fibers from analysis of nucleosome interactions. Proc Natl Acad Sci USA 106: 13317–13322 [DOI] [PMC free article] [PubMed] [Google Scholar]
- Hu Y, Kireev I, Plutz M, Ashourian N, Belmont AS (2009) Large-scale chromatin structure of inducible genes: transcription on a condensed, linear template. J Cell Biol 185: 87–100 [DOI] [PMC free article] [PubMed] [Google Scholar]
- Huynh VA, Robinson PJ, Rhodes D (2005) A method for the in vitro reconstitution of a defined ‘30 nm’ chromatin fibre containing stoichiometric amounts of the linker histone. J Mol Biol 345: 957–968 [DOI] [PubMed] [Google Scholar]
- Jiang C, Pugh BF (2009) Nucleosome positioning and gene regulation: advances through genomics. Nat Rev Genet 10: 161–172 [DOI] [PMC free article] [PubMed] [Google Scholar]
- Kamakaka RT, Thomas JO (1990) Chromatin structure of transcriptionally competent and repressed genes. Embo J 9: 3997–4006 [DOI] [PMC free article] [PubMed] [Google Scholar]
- Lantermann AB, Straub T, Stralfors A, Yuan GC, Ekwall K, Korber P (2010) Schizosaccharomyces pombe genome-wide nucleosome mapping reveals positioning mechanisms distinct from those of Saccharomyces cerevisiae. Nat Struct Mol Biol 17: 251–257 [DOI] [PubMed] [Google Scholar]
- Leuba SH, Yang G, Robert C, Samori B, van Holde K, Zlatanova J, Bustamante C (1994) Three-dimensional structure of extended chromatin fibers as revealed by tapping-mode scanning force microscopy. Proc Natl Acad Sci USA 91: 11621–11625 [DOI] [PMC free article] [PubMed] [Google Scholar]
- Li G, Reinberg D (2011) Chromatin higher-order structures and gene regulation. Curr Opin Genet Dev 21: 175–186 [DOI] [PMC free article] [PubMed] [Google Scholar]
- Lohr D (1986) The salt dependence of chicken and yeast chromatin structure. Effects on internucleosomal organization and relation to active chromatin. J Biol Chem 261: 9904–9914 [PubMed] [Google Scholar]
- Lohr DE (1981) Detailed analysis of the nucleosomal organization of transcribed DNA in yeast chromatin. Biochemistry 20: 5966–5972 [DOI] [PubMed] [Google Scholar]
- Lowary PT, Widom J (1998) New DNA sequence rules for high affinity binding to histone octamer and sequence-directed nucleosome positioning. JMB 276: 19–42 [DOI] [PubMed] [Google Scholar]
- Luger K, Hansen JC (2005) Nucleosome and chromatin fiber dynamics. Curr Opin Struct Biol 15: 188–196 [DOI] [PubMed] [Google Scholar]
- Makde RD, England JR, Yennawar HP, Tan S (2010) Structure of RCC1 chromatin factor bound to the nucleosome core particle. Nature 467: 562–566 [DOI] [PMC free article] [PubMed] [Google Scholar]
- McBryant SJ, Krause C, Woodcock CL, Hansen JC (2008) The silent information regulator 3 protein, SIR3p, binds to chromatin fibers and assembles a hypercondensed chromatin architecture in the presence of salt. Mol Cell Biol 28: 3563–3572 [DOI] [PMC free article] [PubMed] [Google Scholar]
- Misteli T, Gunjan A, Hock R, Bustin M, Brown DT (2000) Dynamic binding of histone H1 to chromatin in living cells. Nature 408: 877–881 [DOI] [PubMed] [Google Scholar]
- Pearson EC, Bates DL, Prospero TD, Thomas JO (1984) Neuronal nuclei and glial nuclei from mammalian cerebral cortex. Nucleosome repeat lengths, DNA contents and H1 contents. Eur J Biochem 144: 353–360 [DOI] [PubMed] [Google Scholar]
- Perisic O, Collepardo-Guevara R, Schlick T (2010) Modeling studies of chromatin fiber structure as a function of DNA linker length. J Mol Biol 403: 777–802 [DOI] [PMC free article] [PubMed] [Google Scholar]
- Richmond TJ, Davey CA (2003) The structure of DNA in the nucleosome core. Nature 423: 145–150 [DOI] [PubMed] [Google Scholar]
- Robinson PJ, Fairall L, Huynh VA, Rhodes D (2006) EM measurements define the dimensions of the ‘30-nm’ chromatin fiber: evidence for a compact, interdigitated structure. Proc Natl Acad Sci USA 103: 6506–6511 [DOI] [PMC free article] [PubMed] [Google Scholar]
- Routh A, Sandin S, Rhodes D (2008) Nucleosome repeat length and linker histone stoichiometry determine chromatin fiber structure. Proc Natl Acad Sci USA 105: 8872–8877 [DOI] [PMC free article] [PubMed] [Google Scholar]
- Schalch T, Duda S, Sargent DF, Richmond TJ (2005) X-ray structure of a tetranucleosome and its implications for the chromatin fibre. Nature 436: 138–141 [DOI] [PubMed] [Google Scholar]
- Schlick T, Hayes J, Grigoryev S (2012) Towards convergence of experimental studies and theoretical modeling of the chromatin fiber. J Biol Chem 2012: 5183–5191 [DOI] [PMC free article] [PubMed] [Google Scholar]
- Schuck P (2000) Size-distribution analysis of macromolecules by sedimentation velocity ultracentrifugation and lamm equation modeling. Biophys J 78: 1606–1619 [DOI] [PMC free article] [PubMed] [Google Scholar]
- Schwarz PM, Felthauser A, Fletcher TM, Hansen JC (1996) Reversible oligonucleosome self-association: dependence on divalent cations and core histone tail domains. Biochemistry 35: 4009–4015 [DOI] [PubMed] [Google Scholar]
- Scipioni A, Turchetti G, Morosetti S, De Santis P (2010) Geometrical, conformational and topological restraints in regular nucleosome compaction in chromatin. Biophys Chem 148: 56–67 [DOI] [PubMed] [Google Scholar]
- Shogren-Knaak M, Ishii H, Sun JM, Pazin MJ, Davie JR, Peterson CL (2006) Histone H4-K16 acetylation controls chromatin structure and protein interactions. Science 311: 844–847 [DOI] [PubMed] [Google Scholar]
- Springhetti EM, Istomina NE, Whisstock JC, Nikitina TV, Woodcock CL, Grigoryev SA (2003) Role of the M-loop and reactive center loop domains in the folding and bridging of nucleosome arrays by MENT. J Biol Chem 278: 43384–43393 [DOI] [PubMed] [Google Scholar]
- Stehr R, Schopflin R, Ettig R, Kepper N, Rippe K, Wedemann G (2010) Exploring the conformational space of chromatin fibers and their stability by numerical dynamic phase diagrams. Biophys J 98: 1028–1037 [DOI] [PMC free article] [PubMed] [Google Scholar]
- Strauss F, Prunell A (1982) Nucleosome spacing in rat liver chromatin. A study with exonuclease III. Nucleic Acids Res 10: 2275–2293 [DOI] [PMC free article] [PubMed] [Google Scholar]
- Strauss F, Prunell A (1983) Organization of internucleosomal DNA in rat liver chromatin. Embo J 2: 51–56 [DOI] [PMC free article] [PubMed] [Google Scholar]
- Thomas JO, Furber V (1976) Yeast chromatin structure. FEBS Lett 66: 274–280 [DOI] [PubMed] [Google Scholar]
- Tremethick DJ (2007) Higher-order structures of chromatin: the elusive 30 nm fiber. Cell 128: 651–654 [DOI] [PubMed] [Google Scholar]
- Valouev A, Johnson SM, Boyd SD, Smith CL, Fire AZ, Sidow A (2011) Determinants of nucleosome organization in primary human cells. Nature 474: 516–520 [DOI] [PMC free article] [PubMed] [Google Scholar]
- van Holde KE, Weischet WO (1975) Boundary analysis of sedimentation-velocity experiments with monodisperse and paucidisperse solutes. Biopolymers 17: 1387–1403 [Google Scholar]
- Wang JP, Fondufe-Mittendorf Y, Xi L, Tsai GF, Segal E, Widom J (2008) Preferentially quantized linker DNA lengths in Saccharomyces cerevisiae. PLoS Comput Biol 4: e1000175. [DOI] [PMC free article] [PubMed] [Google Scholar]
- Weintraub H (1978) The nucleosome repeat length increases during erythropoiesis in the chick. Nucleic Acids Res 5: 1179–1188 [DOI] [PMC free article] [PubMed] [Google Scholar]
- Widom J (1992) A relationship between the helical twist of DNA and the ordered positioning of nucleosomes in all eukaryotic cells. Proc Natl Acad Sci USA 89: 1095–1099 [DOI] [PMC free article] [PubMed] [Google Scholar]
- Woodcock CL, Dimitrov S (2001) Higher order structure of chromatin and chromosomes. Curr Opin Gen Dev 11: 130–135 [DOI] [PubMed] [Google Scholar]
- Woodcock CL, Grigoryev SA, Horowitz RA, Whitaker N (1993) A chromatin folding model that incorporates linker variability generates fibers resembling the native structures. Proc Natl Acad Sci USA 90: 9021–9025 [DOI] [PMC free article] [PubMed] [Google Scholar]
- Woodcock CL, Skoultchi AI, Fan Y (2006) Role of linker histone in chromatin structure and function: H1 stoichiometry and nucleosome repeat length. Chromosome Res 14: 17–25 [DOI] [PubMed] [Google Scholar]
Associated Data
This section collects any data citations, data availability statements, or supplementary materials included in this article.