Abstract
Cisplatin is one of the most commonly used chemotherapeutic agents for glioma patients. In this study, array comparative genomic hybridization (aCGH) was used to identify genes associated with cisplatin resistance in a human glioma cell line. The cisplatin-resistant U251/CP2 cell line was derived by stepwise selection using cisplatin. The genetic aberrations of the U251 parental cell line and the U251/CP2 cells were analyzed using aCGH. RT-PCR was used to detect the expression of the altered genes revealed by aCGH. The sensitivity of glioma cells to cisplatin was determined by using the MTT assay. Apoptosis was detected using flow cytometry and western blot analysis. The IC50 value of cisplatin in U251/CP2 cells was five times higher than its IC50 in U251 cells. The U251 cells lost at least one copy each of the CFHR1 and CFHR3 genes, and both CFHR1 and CFHR3 were homozygously deleted in U251/CP2 cells. The U251/CP2 cells gained two to three copies of C8orf70 and IL-7 genes. IL-7 mRNA expression was studied in 12 glioma cell lines, and expression was positively correlated with the IC50 of cisplatin. Furthermore, IL-7 mRNA expression was also positively correlated with the IC50 of cisplatin in 91 clinical glioma specimens. Additionally, treatment with recombinant human IL-7 (rhIL-7) enhanced cisplatin resistance and increased the relative growth rate of the glioma cells. Moreover, the apoptosis induced by cisplatin could be inhibited by IL-7. In conclusion, our results suggest that IL-7 may play an important role in cisplatin resistance in glioma.
Keywords: aCGH, cisplatin, glioma, IL-7, resistance
Background
Malignant glioma is the most common primary brain tumor. The prevalence of all primary brain tumors is 130.8 per 100,000 people, with approximately 350,000 individuals estimated to be living with this diagnosis in the United States every year.1 The current treatment strategies for malignant glioma include surgical resection followed by radiotherapy alone or in combination with chemotherapy. Despite this multimodal therapy, the median survival time is generally less than one year, and most patients die within two years.2 Glioblastoma multiforme (GBM) is an aggressive form of glioma that responds poorly to chemotherapy and is generally incurable. Cisplatin (DDP) is one of the most commonly used chemotherapeutic agents for glioma patients. However, the clinical response to cisplatin is not satisfactory due to a common drug resistance in gliomas.
In the present study, a high-resolution array comparative genomic hybridization (aCGH) was used to interrogate glioma genomes in a cisplatin-induced resistant cell line, U251/CP2, and its parental cell line, U251, to delineate any regions of genetic aberration. This study will provide important clues to identify genes associated with cisplatin resistance in this type of cancer.
Results
Selection of the U251/CP2 resistant line
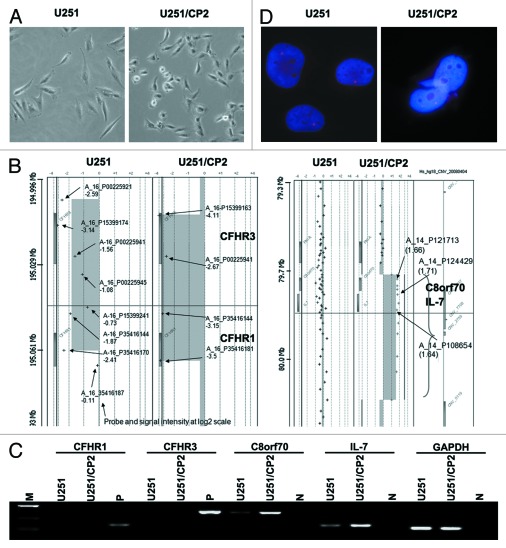
To evaluate cisplatin-sensitivity in glioma cells, 12 glioma lines were treated with various concentrations of cisplatin and assayed for viability using the MTT assay. The IC50s of the 12 cell lines were listed in Table 3. The U251 cell line was sensitive to cisplatin treatment (IC50 was 1.12 ± 0.12 μg/ml) and thus was chosen to create a cisplatin-resistant subline. The U251/CP2 cisplatin-resistant cell subline was established by repeated exposure of the parental U251 cell line to escalating doses of cisplatin. After 10 mo of treatment, the cisplatin-resistant subline was cloned from the treated cultures. The IC50 for cisplatin in U251/CP2 cells was 5.43 ± 0.49 μg/ml. Compared with their parental line, the subline was more than 5-fold resistant to cisplatin. Furthermore, the morphology of the U251 cells changed in response to cisplatin stimuli. The majority of the U251 cells were long spindles and polygons, while the majority of the U251/CP2 cells became round and short spindles (Fig. 1).
Figure 1. The screen of IL-7 about cisplatin resistance in glioma cells. (A) The morphological change of U251 cells in response to cisplatin stimuli. The majority of U251 cells were shaped like long spindles and polygons. The majority of U251/CP2 cells became round and short spindles. (B) Illustration of the chromosomal imbalances detected in the U251 and U251/CP2 cell lines by aCGH and RT-PCR confirmation. CFHR1 and CFHR3 were deleted in chromosome 1 in the U251 and U251/CP2 cell lines. C8orf70 and IL-7 were amplified in chromosome 8 in the U251 and U251/CP2 cells. The rectangles on the left and right side of ideogram indicate chromosomal losses and gains, respectively. (C) The result of aCGH was confirmed by RT-PCR. (D) The amplification of IL-7 U251/CP2 cells was identified using FISH. There was one copy of IL-7 in U251 cell, and the copy of IL-7 amplified in U251/CP2 cells.
Array comparative genomic hybridization analysis
A series of normal vs. normal hybridizations was performed to define the normal variations of the test to reference the intensity ratio (Cy3/Cy5) for each target clone. The hybridizations were normalized so that the overall ratio of green to red signals was centered at 1. With reference to previous aCGH studies, thresholds for copy number gain and loss were log2, ratio 0.2 and -0.2, respectively. The aCGH results for the U251 and U251/CP2 cells, and representative aCGH profiles are illustrated in Figure 1B. In the U251 cells, probe P15399174 detected the expression of Complement factor H-related 3 (CFHR3) with a log2 ratio of -3.14, indicating an approximate loss of 90% of the target signals. Probe P35416170 detected the expression of Complement factor H-related 1 (CFHR1) with a log2 value of -2.41, which suggests an 80% loss of signal intensity. This suggested that the U251 cells may have lost at least one copy each of CFHR1 and CFHR3 (Fig. 1B). In U251/CP2 cells, there were four probes covering the CFHR3-CFHR1 region. All of the probes showed log2 ratios between -2.67 and -4.11 indicating that the entire CFHR1 and CFHR3 genes were homozygously deleted (Fig. 1B). The probes covering Chromosome 8 open reading frame 70 (C8orf70) and IL-7 exhibited increased copy numbers with log2 ratios in the range of ~1.6 (compared with -0.1 to -0.9 in U251 cells), suggesting a gain of 2–3 copies of both genes in U251/CP2 cells (Fig. 1B). The aCGH results suggested that the loss of CFHR1 and CFHR3, and the gain of C8orf70 and IL-7, might be related to the cisplatin resistance in U251/CP2 cells.
aCGH results confirmed by RT-PCR and FISH
To confirm the results of aCGH, the expression of CFHR1, CFHR3, C8orf70 and IL-7 mRNA was determined by RT-PCR in U251 and U251/CP2 cells. As shown in Figure 1C, CFHR1 and CFHR3 transcripts were not detected in the parental and cisplatin-resistant cells, suggesting that these genes may not play a role in cisplatin resistance. The expression levels of C8orf70 and IL-7 were higher in the U251/CP2 cells than in the U251 cells, supporting the copy number gain in corresponding genes by aCGH.
Previous studies showed that autocrine production of interleukins could cause multidrug resistance in cancer cells.5-7 Therefore, we hypothesize that IL-7 might be involved in the development of cisplatin resistance, and thus, we performed FISH analysis for IL-7 to confirm the result of aCGH. The result of the FISH analysis showed that the copy number of IL-7 was indeed amplified in U251/CP2 cells (Fig. 1D), which supports the aCGH analysis.
IL-7 was positively correlated with the cisplatin IC50 in glioma cell lines
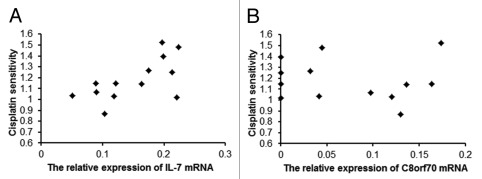
A Spearman correlation analysis was used to determine the relationship between C8orf70 and IL-7 mRNA expression and cisplatin resistance in glioma cell lines. The expression levels of C8orf70 and IL-7 were detected by real time PCR and the IC50 for cisplatin in glioma was analyzed using the MTT assay (Table 3). The results showed that the C8orf70 mRNA expression was not correlated with cisplatin resistance in the 12 glioma cell lines that were tested (r = -0.081, p > 0.05, Fig. 2B), but the IL-7 mRNA expression was positively associated with cisplatin resistance in glioma cells (r = 0.64, p < 0.05, Fig. 2A). This result suggested a link between IL7 overexpression and cisplatin resistance.
Figure 2. The relationship between C8orf70 and IL-7 mRNA expression and the IC50 of cisplatin in glioma cell lines. (A) IL-7 mRNA expression is positively correlated with cisplatin resistance in glioma cell lines (r = 0.66, p < 0.05); (B) C8orf70 mRNA expression is not related to cisplatin resistance in glioma cell lines (r = -0.081, p > 0.05).
IL-7-enhanced cisplatin resistance in glioma cells
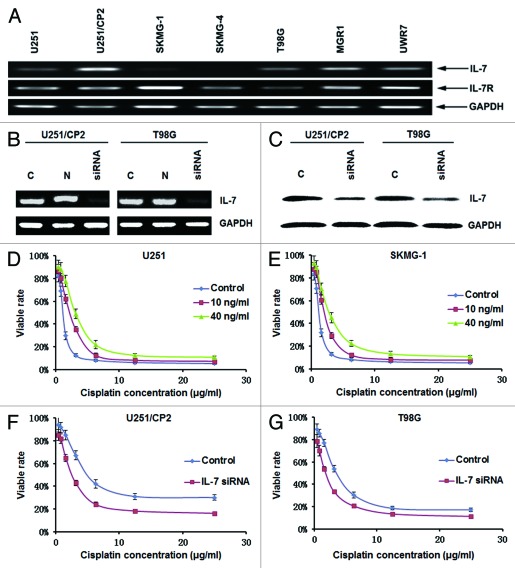
IL-7 binds to its receptor to mediate biological functions. To determine whether glioma cells have the ability to receive signaling through IL-7, the mRNA expression of the IL-7R was assayed in glioma cell lines. As shown in Figure 3A, IL-7R mRNA was expressed in all of the glioma cell lines that were examined, which indicated that the glioma cells had the ability to receive signaling through IL-7.
Figure 3. IL-7 enhanced cisplatin resistance in glioma cells. (A) The expression of IL-7 and IL-7R in glioma cell lines. (B) IL-7 mRNA expression was downregulated by siRNA. (C) IL-7 protein expression was downregulated by siRNA. (D) IL-7 increased the IC50 for cisplatin in U251 cells. (E) IL-7 increased the IC50 for cisplatin in SKMG-1 cells. (F) IL-7 interference decreased the IC50 for cisplatin in U251/CP2 cells. (G) IL-7 interference decreased the IC50 for cisplatin in T98G cells.
The effect of IL-7 on cisplatin resistance in glioma was further defined by the addition of exogenous rhIL-7 and by using IL-7 RNA interference. Subsequent to IL-7 RNA interference treatment, the mRNA and protein expression levels of IL-7 were downregulated (Fig. 3B and C). Ten nanograms per milliliter or 40 ng/ml of rhIL-7 were added into medium with different concentrations of cisplatin to evaluate the effect of rhIL-7 on cisplatin resistance in glioma cells. Both 10 ng/ml and 40 ng/ml of rhIL-7 increased the IC50 for cisplatin in the cell lines with lower IL-7 expression, U251 and SKMG-1 (Table 4, Fig. 3D and E), while the IC50 for cisplatin in cell lines with higher IL-7 expression, U251/CP2 and T98G, was reduced significantly following IL-7 RNA interference (Table 4, Fig. 3F and G).
IL-7 promoted the growth of glioma cells
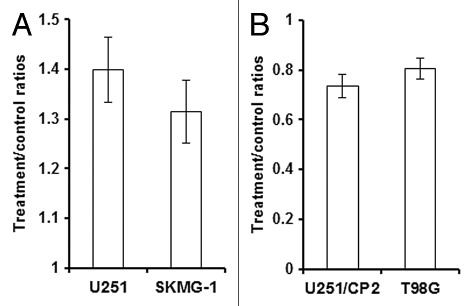
Previous studies showed that IL-7 could promote the growth of breast cancer and leukemia cells.8,9 Therefore, we further assessed the effect of IL-7 on cancer cell proliferation. After the addition of rhIL-7 at a concentration of 40 ng/ml for 72 h, the relative growth rate of U251 and SKMG-1 cells was increased to 1.40- and 1.32-fold, respectively, compared with the rate without rhIL-7. After IL-7 RNA interference, the relative growth rate of U251/CP2 and T98G cells decreased to 0.74 and 0.81 fold, respectively, compared with the rate without IL-7 interference (Fig. 4).
Figure 4. IL-7 promoted the growth of glioma cells.(A) rhIL-7 promoted the growth of U251 and SKMG-1 cells. (B) IL-7 siRNA inhibited the growth of U251/CP2 and T98G cells.
IL-7 inhibited the apoptosis induced by cisplatin in glioma cells
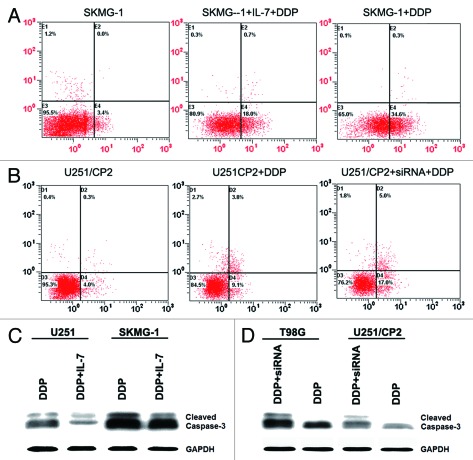
Previous studies showed that IL-7 could inhibit apoptosis,10 so we studied the effect of IL-7 on the apoptosis induced by cisplatin in glioma cells. By adding 40 ng/ml of rhIL-7, the apoptosis rate induced by cisplatin in SKMG-1 and U251 cells was reduced from 35.0 and 30.2% to 19.1 and 17.3%, respectively. Subsequent to IL-7 RNA interference, the cisplatin-induced apoptosis rate in U251/CP2 and T98G cells increased from 15.5 and 19.8% to 23.8 and 25.4%, respectively (Fig. 5A and B). Cleaved caspase-3, an apoptosis related protein, was also detected by western blotting. Cleaved caspase-3 was reduced in U251 and SKMG-1 cells that were stimulated by exogenous IL-7, and increased in U251/CP2 and T98G cells after IL-7 RNA interference (Fig. 5C and D). These results suggested that IL-7 could inhibit the apoptosis induced by cisplatin.
Figure 5. IL-7 inhibited apoptosis induced by cisplatin in glioma cells. (A) IL-7 inhibited apoptosis induced by cisplatin in SKMG-1 cells. (B) IL-7 interference enhanced apoptosis induced by cisplatin in U251/CP2 cells. (C) IL-7 decreased the cleaved caspase-3 induced by cisplatin in U251 and SKMG-1 cells. (D) IL-7 interference increased the cleaved caspase-3 induced by cisplatin in U251/CP2 and T98G cells.
IL-7 mRNA expression was positively correlated with cisplatin resistance in glioma specimens
To determine whether IL-7 mRNA expression was related to cisplatin resistance in clinical glioma samples, primary glioma specimens obtained from 91 patients were cultured, and their IC50s for cisplatin were determined using the MTT assay. The average IC50 for cisplatin is 2.48 ± 2.00 μg/ml. The mRNA expression of IL-7 in the corresponding 91 glioma specimens was detected by real time PCR. Pearson correlation analysis showed that the mRNA expression of IL-7 was positively correlated with cisplatin resistance in the human glioma specimens (r = 0.610, p < 0.05) (Fig. 6).
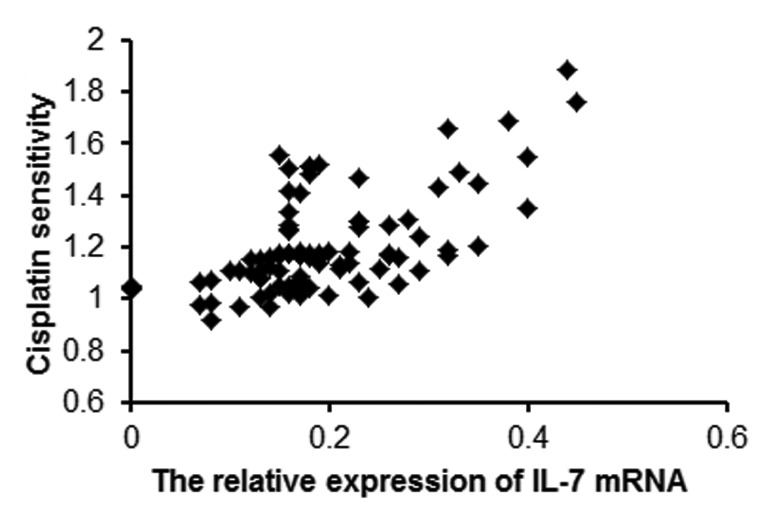
Figure 6. IL-7 mRNA expression is positively correlated with IC50 for cisplatin in human glioma specimens.
Discussion
Response to chemotherapy is often restricted by resistance induced by subsequent treatment. aCGH has been used to screen the genomic aberrations associated with drug resistance in other cancers. Prasad et al.11 analyzed the genomic aberrations and genes in cisplatin-resistant ovarian cancer cells using high definition cytogenetics and oligonucleotide aCGH. Osterberg et al.12 explored high-resolution genomic profiling of carboplatin resistance in early-stage epithelial ovarian carcinoma. Hattinger et al.13 detected the genomic imbalances associated with methotrexate resistance in human osteosarcoma cell lines by comparative genomic hybridization-based techniques. Struski et al.14 identified the chromosomal loci associated with non-P-glycoprotein-mediated multidrug resistance to the topoisomerase II inhibitor in a lung adenocarcinoma cell line by using comparative genomic hybridization. In this study, we used aCGH to determine the genomic basis of drug resistance in U251 glioma cells and a cisplatin-resistant subline (U251/CP2). The cytogenetic analysis presented in this study has characterized four unique genetic aberrations, a loss of CFHR1 and CFHR3, and a gain of C8orf70 and IL-7 in U251/CP2 cells. This result, to our knowledge, has not been reported in the literature.
Chromosome 8 open reading frame 70 (C8orf70) was located at chromosome 8q21.13. The amplification of chromosome 8q21.1 is a common event in various cancers, such as prostate cancer, ovarian cancer, and mantle cell lymphoma,15-17 however, there was not any evidence to indicate that chromosome 8q21.1 was related to drug resistance. Our results showed that the expression of C8orf70 mRNA was not related to cisplatin resistance in glioma cell lines. The role of C8orf70 in U251/CP2 cells should be explored in the future.
Interleukin-7 (IL-7) is a cytokine that plays an essential role in the development, survival and proliferation of lymphocytes in humans.18 Previous research showed that IL-7 can protect cells from death by inhibiting apoptosis via suppression of the activity of pro-death proteins.18 IL-7 was not only detected in leukemia and lymphoma but also in solid tumors, such as colon cancer, esophageal carcinoma, Warthin’s tumor, head and neck squamous cancer, and breast cancer.8,19-23 IL-7 may induce the growth of breast cancer cells in vitro through a wortmannin-sensitive pathway.9 Recently, it was reported that IL-7 was moderately abundant in a pancreatic cancer resistant subline.24
Our aCGH study showed that IL-7 was amplified in U251/CP2 cells, an observation that was supported by RT-PCR and FISH. In the present study, we determined that IL-7 can reduce the sensitivity of glioma cell lines to cisplatin. The IL-7 receptor played a key role in the function of IL-7. IL-7R mRNA was expressed in all detected glioma cell lines, which indicated that glioma cells had the ability to accept IL-7 signaling. We hypothesized that IL-7 may protect U251/CP2 cells from cisplatin by promoting the growth of U251/CP2 cells. It was indeed determined that IL-7 stimulated the growth of glioma cells. Our results have shown that IL-7 mRNA expression was associated with the sensitivity of glioma cell lines to cisplatin. As a growth factor, IL-7 not only stimulated the proliferation of lymphocyte cells but also induced the growth of breast cancer cells. It was reported that IL-7 was moderately abundant in MDR pancreatic cancer cells.24 Studies showed that IL-7 can inhibit apoptosis,10,25 and consequently, the cisplatin resistance of glioma cells induced by IL-7 may be related to the inhibition of apoptosis, which had also been confirmed by flow cytometry and western blot analysis in this study. According to previous studies and our results, we hypothesize that glioma cells produce and secrete IL-7, which stimulates their own growth and prevents apoptosis through IL-7R, to protect them from cisplatin.
In conclusion, we identified that the gain of IL-7 is associated with cisplatin resistance, suggesting that IL-7 might be a potential predictive marker of cisplatin resistance in glioma patients. Our findings may contribute to an increased understanding of IL-7 overexpression in cisplatin-resistant glioma, and in the future, this will assist in designing pharmacological strategies for preventing, overcoming, or reversing cisplatin resistance in glioma.
Materials and Methods
Cell lines and cell culture
The human glioma cell lines, MGR1, MGR2, MGR3, SF767, SKMG-1, SKMG-4, T98G, U251, U373, U87 and UWR7, were cultured in DMEM medium (Invitrogen-Gibco) supplemented with 10% fetal calf serum (Invitrogen-Hyclone) in a humidified atmosphere containing 5% CO2 at 37°C. The U251/CP2 drug-resistant variant of the U251 cell line was established by stepwise selection after prolonged (> 10 mo) treatment of U251 cells with increasing concentrations of cisplatin (Sigma-Aldrich) in the medium. After 10 mo of culturing in the presence of cisplatin, the IC50 (inhibitory concentration to produce 50% cell death) values were 5.43 ± 0.49 μg/ml cisplatin for the U251/CP2 cells. To maintain the cisplatin resistance phenotype, cisplatin (2 μg/ml) was added to the culture medium for U251/CP2 cells.
Cell proliferation analysis
The cells were plated at 1,000 cells/well in 96-well plates and incubated for an additional 24 h. Different concentrations of recombinant human IL-7 (rhIL-7) (R&D Systems) were added into wells and incubated for 72 h in a humidified atmosphere containing 5% CO2 at 37°C. At the end of the incubation, viable cells were quantified using 3-(4,5-dimethylthiazol-2-yl)-2,5-diphenyltetrazolium bromide (MTT). Briefly, 20 μl of the MTT stock solution (5 mg/ml) was added to each well of an assay. After 3 h of incubation, the medium was removed and the converted dye was solubilized with isopropanol. The absorbance of the converted dye was measured at a wavelength of 540 nm. The conversion to cell number was based on a standard curve.
Cytotoxicity analysis
The cells were plated at 2,000 cells/well in 96-well plates and incubated for an additional 24 h. Next, the cells were treated with cisplatin or various concentrations of rhIL-7 for 72 h. The inhibition of cell-growth was evaluated at concentrations of 0, 0.39, 0.78, 1.5625, 3.125, 6.25, 12.5, 25, and 50 μg/ml of cisplatin. Viable cells were quantified for 72 h after the administration of anticancer drugs using the MTT assay. The percentage of cell survival (survival rate) was calculated by dividing the absorbance value of the treated sample by the absorbance value of the untreated control within each group. The concentration of cisplatin that was required to inhibit cell growth by 50% (IC50) was calculated from survival curves using the Bliss method.3
Cisplatin response testing for primary glioma specimens in vitro
Ninety-one fresh glioma specimens were obtained from surgery and were immediately submitted for cell culture and drug cytotoxicity testing. Briefly, glioma specimens that were surgically resected from patients were dissociated using collagenase and dispersed. The tumor cells were cultured in DMEM medium supplemented with 10% fetal calf serum in a humidified atmosphere containing 5% CO2 at 37°C. After culturing, cisplatin response testing was performed by the MTT assay as described in cytotoxicity analysis.
Array comparative genomic hybridization analysis (aCGH)
aCGH was performed on the 105K CGH oligonucleotide microarray (Agilent Technologies) as described.4 Briefly, 1–2 g of sample and a sex-matched reference DNA were labeled, respectively, with ULS-Cy5 and ULS-Cy3 at 85°C for 30 min (Genomic DNA ULS Labeling kit, Agilent). The purified labeled samples were mixed with human Cot-1 DNA, denatured at 95°C (Oligo aCGH hybridization kit), and applied to microarrays. The hybridization was conducted at 65°C for 40 h. The microarrays were then washed in Oligo aCGH wash buffer 1 at room temperature for 5 min and wash buffer 2 at 37°C for 1 min. After drying, the microarrays were scanned using a DNA microarray scanner G2565BA (Agilent), and the data (log2) were extracted from raw microarray image files using Feature Extraction software (version 9; Agilent). The data were analyzed using DNA analytics software (version 4.0; Agilent) with default filter settings. The aberration detection method 2 (ADM2) algorithm with centralization and fuzzy zero correction was used to define aberrant intervals.
RNA preparation and RT-PCR
The total cell RNA was extracted using TRIzol reagent (Invitrogen) according to the manufacturer’s protocol. Reverse transcription was performed with 2 μg of total RNA from each sample in a total volume of 20 μl using the RevertAidTM First Strand cDNA Synthesis Kit (Fermentas AB) according to the manufacturer’s protocol.
The sequences of the forward and reverse primers for each gene were listed in Table 1. Each primer was placed in a different exon to avoid amplification of contaminating genomic DNA. GAPDH was used as a loading control. Each PCR mixture contained 1 µl of cDNA, 5 µl Green GoTaq DNA polymerase (Promega), 0.5µl forward primer (10 µM) and 0.5 µl reverse primer (10 µM) in a final volume of 10 µl. PCR was performed as follows: 94°C for 2 min, 30 cycles at 94 °C for 30 sec, at annealing temperature (listed in Table 1) for 30 sec, and 72°C for 2 min. The PCR products were separated on a 1.8% agarose gel, visualized by ethidium bromide staining, and photographed with a Gel Doc XR (Bio-Rad Laboratories).
Table 1. PCR primer sequences.
| Name | Oligonucleotide | Sequence (5–3) | Size (bp) | Tm |
|---|---|---|---|---|
| CFHR1 |
Forward |
GTTATGAATGTAGGAGCCCTTATG |
158 |
55 |
| |
Reverse |
TGACAACGGGAATGAAGTAATG |
|
|
| CFHR3 |
Forward |
TGTGGGTTTCCTGTGCTAATG |
375 |
55 |
| |
Reverse |
GAGACCAGCCTTTCTCCGTA |
|
|
| C8orf70 |
Forward |
GATGGAGGGACTGGAAGAG |
353 |
53 |
| |
Reverse |
CAGGATCATAAGAAGGTGGAG |
|
|
| IL-7 |
Forward |
GAGTGACTATGGGCGGTGAGAG |
146 |
61 |
| |
Reverse |
GATGCTACTGGCAACAGAACAAGG |
|
|
| IL-7R |
Forward |
ATGCCTGGCTGGGAATGTC |
197 |
53 |
| |
Reverse |
CCTGAGCAACTGGGTTCAATG |
|
|
| GAPDH |
Forward |
CGCTCTCTGCTCCTCCTGTTC |
108 |
61 |
| Reverse | ATCCGTTGACTCCGACCTTCAC |
Table 2. siRNA sequences.
| Name | Sequence (5–3) | |
|---|---|---|
| IL-7 siRNA Sense |
5′ GCAUCAUCUGAUUGUGAUATT3′ |
|
| IL-7 siRNA Anti-Sense |
5′ UAUUCAGGCAAUUGCUACCTT 3′ |
|
| Negative Control Sense |
5′ UUCUCCGAACGUGUCACGUTT 3′ |
|
| Negative Control Sense | 5′ ACGUGACACGUUCGGAGAATT3′ | |
Table 3. IC50 for cisplatin in glioma.
| Cell line | IC50 for cisplatin (μg/ml) | |
|---|---|---|
| MGR1 |
2.59 ± 0.22 |
|
| MGR2 |
2.46 ± 0.19 |
|
| MGR3 |
4.83 ± 0.36 |
|
| SF767 |
0.57 ± 0.13 |
|
| SKMG-1 |
1.29 ± 0.13 |
|
| SKMG-4 |
1.14 ± 0.16 |
|
| T98G |
3.8 ± 0.33 |
|
| U251 |
1.12 ± 0.12 |
|
| U373 |
1.74 ± 0.16 |
|
| U87 |
1.73 ± 0.19 |
|
| UWR7 |
1.69 ± 0.11 |
|
| SF295 | 1.07 ± 0.12 |
Table 4. IC50 for cisplatin in glioma following IL-7 or siRNA treatment.
| Cell line | Treatment | IC50 for cisplatin (μg/ml) |
|---|---|---|
| U251 |
control |
1.12 ± 0.21 |
| 10 ng/ml IL-7 |
2.1 ± 0.21 |
|
| 40 ng/ml IL-7 |
3.18 ± 0.25 |
|
| SKMG-1 |
control |
1.18 ± 0.13 |
| 10 ng/ml IL-7 |
1.96 ± 0.16 |
|
| 40 ng/ml IL-7 |
2.73 ± 0.23 |
|
| U251/CP2 |
control |
5.05 ± 0.36 |
| siRNA |
2.53 ± 0.26 |
|
| T98G | control |
3.52 ± 0.28 |
| siRNA | 1.74 ± 0.14 |
Real-time quantitative PCR was performed using the 7900HT Fast Real-Time PCR System (Applied Biosystems). Briefly, the qPCR amplification was performed with 1 μl cDNA, gene-specific primers (10 μM), SYBR Premix Ex TaqTM (2×) (TaKaRa), ROX Reference Dye (50×), and dH2O, in a total reaction volume of 10 μl. After activation of Taq polymerase at 95°C for 10 sec, PCR was performed for 40 cycles, with each cycle consisting of denaturing at 95°C for 10 sec, annealing and extending at 61°C for 30 sec. To determine the specificity of the amplification reaction, a melting curve analysis of the amplification products was subsequently performed. The 2-ΔΔCT method was used to quantitate gene expression.
Fluorescence in situ hybridization
IL-7 gene amplification was determined by FISH performed by EXONBIO CO., LTD (Guangzhou). Briefly, the cells were plated onto slides and fixed by 4% paraformaldehyde at 50–70% confluence. The sections were pretreated in PBS for 20 min followed by protease digestion at 37°C for 26 min. An appropriate amount of hybridization solution containing directly labeled probes was applied, and the probe-target cells were codenatured for 5 min at 72°C using Hybridizer (DAKO Diagnostics) and allowed to hybridize for 19 h at 37°C. Non-hybridized probe was washed out in 72°C 2x SSC with 0.3% NP-40 solution for 2 min. Nuclei were counterstained with DAPI, covered with a glass coverslip and stored at −20°C until analyzed. Hybridized probes were examined manually using a fluorescence Zeiss microscope (Zeiss, Axio Imager.Z2) equipped with a single green, orange and triple band pass filter Dapi-FITC-Cy3.
siRNA transfection
For transfection, cells were plated in six-well plates (2 × 10⁵ cells per well) and were allowed to adhere for 24 h. IL-7 siRNA or Negative Control siRNA (Table 2) were synthesized by Shanghai GenePharma Co., Ltd and transfected into U251/CP2 and T98G cells using lipofectamine 2000 (Invitrogen), with the siRNA at a final concentration of 200 nM according to the manufacturer’s instructions. The cells were analyzed 72 h after transfection.
Western blot analysis
A mouse anti-IL7 monoclonal antibody was obtained from Abcam (Cambridge). Anti-GAPDH as well as anti-caspase-3 antibodies were obtained from Santa Cruz Biotech. For western blot analysis, the cells were washed with ice-cold PBS after treatment and lysed on ice using RIPA. After centrifugation at 13,000 × g for 5 min, the protein concentration of the supernatant was analyzed using a BCA assay kit. For the analysis of protein contents, 40 μg of total protein was electrophoresed on a 10% SDS-PAGE gel, transferred to PVDF membranes and the membranes were then incubated with the respective antibodies indicated above. Membranes were developed with a chemiluminescent reagent (Pierce Chemical Co.), and the bands were exposed to Biomax MR film (Eastman Kodak).
Apoptosis assay
Apoptosis was assayed using the Annexin V-FITC Apoptosis Kit (Keygen Biotech. Co. Ltd.) according to the manufacturer’s instructions. Briefly, the cells were harvested and washed twice with PBS. Next, each sample was centrifuged at 1,000 × g for 5 min and suspended again in 500 µl of binding buffer. Five microliters of Annexin V-FITC and 5 µl of propidium iodide (PI) working solutions were added. The samples were then analyzed by flow cytometry (FCM).
Statistical analysis
Each experiment was repeated at least three times. Numerical data were presented as the mean ± SD. The difference between means was analyzed using Students t-test. The correlations were determined with bivariate correlation procedures (Spearman correlation coefficient, p < 0.05). All statistical analyses were performed using SPSS17.0 for Windows (SPSS). The differences were considered significant when p < 0.05.
Acknowledgments
We would like to acknowledge Zheng-Zhi Zou for excellent technical assistance. This work was supported by the Science and Technology Project of Guangdong Province (No. 2005B50301005) and the National Natural Science Foundation of China (No. 30772551).
Disclosure of Potential Conflicts of Interest
No potential conflicts of interest were disclosed.
Footnotes
Previously published online: www.landesbioscience.com/journals/cbt/article/19592
References
- 1.Davis FG, Kupelian V, Freels S, McCarthy B, Surawicz T. Prevalence estimates for primary brain tumors in the United States by behavior and major histology groups. Neuro Oncol. 2001;3:152–8. doi: 10.1093/neuonc/3.3.152. [DOI] [PMC free article] [PubMed] [Google Scholar]
- 2.Stupp R, Mason WP, van den Bent MJ, Weller M, Fisher B, Taphoorn MJ, et al. European Organisation for Research and Treatment of Cancer Brain Tumor and Radiotherapy Groups. National Cancer Institute of Canada Clinical Trials Group Radiotherapy plus concomitant and adjuvant temozolomide for glioblastoma. N Engl J Med. 2005;352:987–96. doi: 10.1056/NEJMoa043330. [DOI] [PubMed] [Google Scholar]
- 3.Shi Z, Liang YJ, Chen ZS, Wang XW, Wang XH, Ding Y, et al. Reversal of MDR1/P-glycoprotein-mediated multidrug resistance by vector-based RNA interference in vitro and in vivo. Cancer Biol Ther. 2006;5:39–47. doi: 10.4161/cbt.5.1.2236. [DOI] [PubMed] [Google Scholar]
- 4.Huang J, Pang J, Watanabe T, Ng HK, Ohgaki H. Whole genome amplification for array comparative genomic hybridization using DNA extracted from formalin-fixed, paraffin-embedded histological sections. J Mol Diagn. 2009;11:109–16. doi: 10.2353/jmoldx.2009.080143. [DOI] [PMC free article] [PubMed] [Google Scholar]
- 5.Conze D, Weiss L, Regen PS, Bhushan A, Weaver D, Johnson P, et al. Autocrine production of interleukin 6 causes multidrug resistance in breast cancer cells. Cancer Res. 2001;61:8851–8. [PubMed] [Google Scholar]
- 6.Stassi G, Todaro M, Zerilli M, Ricci-Vitiani L, Di Liberto D, Patti M, et al. Thyroid cancer resistance to chemotherapeutic drugs via autocrine production of interleukin-4 and interleukin-10. Cancer Res. 2003;63:6784–90. [PubMed] [Google Scholar]
- 7.Wang Y, Qu Y, Niu XL, Sun WJ, Zhang XL, Li LZ. Autocrine production of interleukin-8 confers cisplatin and paclitaxel resistance in ovarian cancer cells. Cytokine. 2011;56:365–75. doi: 10.1016/j.cyto.2011.06.005. [DOI] [PubMed] [Google Scholar]
- 8.Silva A, Gírio A, Cebola I, Santos CI, Antunes F, Barata JT. Intracellular reactive oxygen species are essential for PI3K/Akt/mTOR-dependent IL-7-mediated viability of T-cell acute lymphoblastic leukemia cells. Leukemia. 2011;25:960–7. doi: 10.1038/leu.2011.56. [DOI] [PubMed] [Google Scholar]
- 9.Al-Rawi MA, Rmali K, Mansel RE, Jiang WG. Interleukin 7 induces the growth of breast cancer cells through a wortmannin-sensitive pathway. Br J Surg. 2004;91:61–8. doi: 10.1002/bjs.4449. [DOI] [PubMed] [Google Scholar]
- 10.Karawajew L, Ruppert V, Wuchter C, Kösser A, Schrappe M, Dörken B, et al. Inhibition of in vitro spontaneous apoptosis by IL-7 correlates with bcl-2 up-regulation, cortical/mature immunophenotype, and better early cytoreduction of childhood T-cell acute lymphoblastic leukemia. Blood. 2000;96:297–306. [PubMed] [Google Scholar]
- 11.Prasad M, Bernardini M, Tsalenko A, Marrano P, Paderova J, Lee CH, et al. High definition cytogenetics and oligonucleotide aCGH analyses of cisplatin-resistant ovarian cancer cells. Genes Chromosomes Cancer. 2008;47:427–36. doi: 10.1002/gcc.20547. [DOI] [PubMed] [Google Scholar]
- 12.Osterberg L, Levan K, Partheen K, Staaf J, Sundfeldt K, Horvath G. High-resolution genomic profiling of carboplatin resistance in early-stage epithelial ovarian carcinoma. Cytogenet Genome Res. 2009;125:8–18. doi: 10.1159/000218744. [DOI] [PubMed] [Google Scholar]
- 13.Hattinger CM, Reverter-Branchat G, Remondini D, Castellani GC, Benini S, Pasello M, et al. Genomic imbalances associated with methotrexate resistance in human osteosarcoma cell lines detected by comparative genomic hybridization-based techniques. Eur J Cell Biol. 2003;82:483–93. doi: 10.1078/0171-9335-00336. [DOI] [PubMed] [Google Scholar]
- 14.Struski S, Doco-Fenzy M, Trussardi A, Masson L, Gruson N, Ulrich E, et al. Identification of chromosomal loci associated with non-P-glycoprotein-mediated multidrug resistance to topoisomerase II inhibitor in lung adenocarcinoma cell line by comparative genomic hybridization. Genes Chromosomes Cancer. 2001;30:136–42. doi: 10.1002/1098-2264(2000)9999:9999<::AID-GCC1071>3.0.CO;2-T. [DOI] [PubMed] [Google Scholar]
- 15.Holcomb IN, Young JM, Coleman IM, Salari K, Grove DI, Hsu L, et al. Comparative analyses of chromosome alterations in soft-tissue metastases within and across patients with castration-resistant prostate cancer. Cancer Res. 2009;69:7793–802. doi: 10.1158/0008-5472.CAN-08-3810. [DOI] [PMC free article] [PubMed] [Google Scholar]
- 16.Dimova I, Orsetti B, Negre V, Rouge C, Ursule L, Lasorsa L, et al. Genomic markers for ovarian cancer at chromosomes 1, 8 and 17 revealed by array CGH analysis. Tumori. 2009;95:357–66. doi: 10.1177/030089160909500315. [DOI] [PubMed] [Google Scholar]
- 17.de Leeuw RJ, Davies JJ, Rosenwald A, Bebb G, Gascoyne RD, Dyer MJ, et al. Comprehensive whole genome array CGH profiling of mantle cell lymphoma model genomes. Hum Mol Genet. 2004;13:1827–37. doi: 10.1093/hmg/ddh195. [DOI] [PubMed] [Google Scholar]
- 18.Jiang Q, Li WQ, Aiello FB, Mazzucchelli R, Asefa B, Khaled AR, et al. Cell biology of IL-7, a key lymphotrophin. Cytokine Growth Factor Rev. 2005;16:513–33. doi: 10.1016/j.cytogfr.2005.05.004. [DOI] [PubMed] [Google Scholar]
- 19.Oka M, Hirose K, Iizuka N, Aoyagi K, Yamamoto K, Abe T, et al. Cytokine mRNA expression patterns in human esophageal cancer cell lines. J Interferon Cytokine Res. 1995;15:1005–9. doi: 10.1089/jir.1995.15.1005. [DOI] [PubMed] [Google Scholar]
- 20.Maeurer MJ, Walter W, Martin D, Zitvogel L, Elder E, Storkus W, et al. Interleukin-7 (IL-7) in colorectal cancer: IL-7 is produced by tissues from colorectal cancer and promotes preferential expansion of tumour infiltrating lymphocytes. Scand J Immunol. 1997;45:182–92. doi: 10.1046/j.1365-3083.1997.d01-384.x. [DOI] [PubMed] [Google Scholar]
- 21.Takeuchi T, Yamanouchi H, Yue Q, Ohtsuki Y. Epithelial component of lymphoid stroma-rich Warthin’s tumour expresses interleukin (IL)-7. Histopathology. 1998;32:383–4. doi: 10.1046/j.1365-2559.1998.0401h.x. [DOI] [PubMed] [Google Scholar]
- 22.Paleri V, Pulimood A, Davies GR, Birchall MA. Interleukins 7 and 12 are expressed in head and neck squamous cancer. Clin Otolaryngol Allied Sci. 2001;26:302–6. doi: 10.1046/j.1365-2273.2001.00475.x. [DOI] [PubMed] [Google Scholar]
- 23.Al-Rawi MA, Rmali K, Watkins G, Mansel RE, Jiang WG. Aberrant expression of interleukin-7 (IL-7) and its signalling complex in human breast cancer. Eur J Cancer. 2004;40:494–502. doi: 10.1016/j.ejca.2003.10.016. [DOI] [PubMed] [Google Scholar]
- 24.Zhao YP, Chen G, Feng B, Zhang TP, Ma EL, Wu YD. Microarray analysis of gene expression profile of multidrug resistance in pancreatic cancer. Chin Med J (Engl) 2007;120:1743–52. [PubMed] [Google Scholar]
- 25.Sade H, Sarin A. IL-7 inhibits dexamethasone-induced apoptosis via Akt/PKB in mature, peripheral T cells. Eur J Immunol. 2003;33:913–9. doi: 10.1002/eji.200323782. [DOI] [PubMed] [Google Scholar]


