Abstract
We observed and measured the fluid flow that was generated by an artificial cilium. The cilium was composed of superparamagnetic microspheres, in which magnetic dipole moments were induced by an external magnetic field. The interaction between the dipole moments resulted in formation of long chains—cilia, and the same external magnetic field was also used to drive the cilia in a periodic manner. Asymmetric periodic motion of the cilium resulted in generation of fluid flow and net pumping of the surrounding fluid. The flow and pumping performance were closely monitored by introducing small fluorescent tracer particles into the system. By detecting their motion, the fluid flow around an individual cilium was mapped and the flow velocities measured. We confirm that symmetric periodic beating of one cilium results in vortical motion only, whereas asymmetry is required for additional translational motion. We determine the effect of asymmetry on the pumping performance of a cilium, verify the theoretically predicted optimal pumping conditions, and determine the fluid behaviour around a linear array of three neighbouring cilia. In this case, the contributions of neighbouring cilia enhance the maximal flow velocity compared with a single cilium and contribute to a more uniform translational flow above the surface.
INTRODUCTION
Many eukaryotic cells have developed special structures on their surfaces, cilia, that enable motion or generate fluid flow above the cell’s surface. Some micro-organisms (like Paramecium) move by synchronised beating of the cilia; in humans, cilia are found in the trachea for moving mucus, or in the Fallopian tubes for transport of the ovum, to name just a few functions. Nodal cilia in the embryo play a crucial role in establishing the left-right body asymmetry in mammals1 with similar mechanisms existing in lower vertebrates.2
Cilia are hairlike structures and are typically 2–15 μm long at a diameter of only 150–300 nm and beat periodically with a frequency of some tens of Hz. Due to their small dimensions, the behaviour of the surrounding fluid is described by the so-called low Reynolds number regime, in which the viscosity effects prevail the inertia. According to Purcell’s scallop theorem,3 reciprocal (symmetric in time) motion in such a regime results neither in directed motion nor in generation of fluid flow. The beating pattern of the cilia is thus asymmetric and composed of two parts: the power stroke, during which the fairly stiff cilium is more or less straight, acts as an oar, and maximises the effect on the fluid; and a recovery stroke, during which the bent cilium sweeps the cell surface and minimises the effect on the fluid.4 The achieved asymmetry and non-reciprocity results in a generation of a net flow around the cilium and above a ciliated surface. Nodal cilia are shorter and therefore do not bend significantly during the recovery stroke. Their beat rather follows the mantle of a tilted cone.1 When the cilium is further away from the surface, it moves more fluid than when it is closer, and this provides the broken symmetry necessary for directed pumping.5
The mechanisms of flow generation, coupling between individual cilia, and in general hydrodynamic phenomena around a beating cilium have recently attracted considerable attention. Not only because the cilia are of fundamental importance in biology and physiology but also for practical microfluidic applications. Artificial cilia that are controlled by external fields can be used in microfluidic devices as micro-scale pumps and as mixers in such low Reynolds number systems. Several different techniques have been proposed so far for manufacturing artificial cilia with different degrees of success regarding the generation of fluid flow.
The first steps towards artificial cilia were made by Darnton et al., who created a bacterial carpet by attaching bacteria to a solid surface.6 The flow above the surface was rather complex mainly due to weak coordination between the individual flagella, and due to symmetric rotation, no net flow was observed. An improvement was made by driving the cilia externally, by magnetic or electric field, for example. Magnetic-polymeric composite materials were used to create nanorod arrays that were driven in a simple periodic motion by a moving permanent magnet.7 Electrostatically driven cilia made of metal-coated polymer films have been used as mixers8, 9 and outside the low Reynolds number regime as pumps.8 Electron beam has also been employed to actuate artificial cilia manufactured by soft lithography procedure.10
In one of our earlier papers, we reported on fabrication of self-assembled artificial cilia that were driven externally by a varying magnetic field.11 We have shown that an array of artificial cilia successfully pumped fluid in one direction and have measured the velocity profile of the flow above such surface. A similar approach was used by Sing and coworkers12 to assemble and manipulate microfluidic walkers. Shields and coworkers13 implemented a conical beating pattern on a large number of cilia made from flexible magnetic composite material. They observed two segregated regimes of fluid flow: directed motion above the cilia and mixing between them, with a relatively sharp boundary between the two. Theoretical studies analyzed different beating modes of magnetically driven cilia, including planar14, 15 and conical16, 17 patterns. Metachronal coordination can enhance the pumping performance,14, 18 which was experimentally realized in a system of densely arranged cilia actuated by a rotating permanent magnet.19 Some studies also report fluid actuation by larger, millimeter sized magnetic cilia.20, 21
Here we concentrate on a detailed description of fluid flow around one artificial cilium driven by an external magnetic field. Because the direction of the cilium largely follows that of the applied field, its shape stays almost straight and the beating pattern closely resembles that observed in nodal cilia. We investigate the generation of vortex and fluid transport around the cilium by mapping the fluid flow. A comparison between the flow at different parameters, such as asymmetry, frequency, and cilium length is made. Additionally, we also study flow around a small linear array of cilia, where a change in velocity field is expected due to combined contributions of neighbouring cilia.
EXPERIMENT
Sample preparation
To assemble and actuate the artificial cilium by an external magnetic field, superparamagnetic spheres were used in the experiment. In such spheres, magnetic dipole moment is proportional to the intensity of the external magnetic field, assuming the fields are low and magnetisation well below the saturated value. The induced magnetic dipoles then interact with each other and form long stable structures, chains, oriented parallel to the direction of the magnetic field. The beads that we used in the experiment were monodisperse superparamagnetic beads with a diameter of 4.4 μm (Dynabeads Epoxy M-450, Dynal Biotech, standard deviation in bead diameter ∼55 nm22) in water. To prevent aggregation of the beads, we coated them with BSA (bovine serum albumin), 10 mg/ml, for 4 h in ultrasonic bath.
In order to create an artificial cilium, one end of the assembled bead chain had to be attached to a surface (see Fig. 1). We once again employed the induced magnetic dipole moments in the beads and attached one bead of the chain to an anchoring site via magnetic interaction. For this purpose, we prepared a glass surface with an array of ferromagnetic nickel dots. The nickel anchoring sites were manufactured using the following photolithographic procedure: a microscope glass slide was coated with a 200 nm thick nickel layer by standard evaporation technique. An additional 5-micron layer of negative photoresist (SU-8 2025, Microchem, adhesion promoter TI Prime, Microchemicals GmbH) was deposited onto the slide. In order to obtain the required pattern of the anchoring sites, direct illumination technique was implemented.23 We used a UV laser (Omikron Laserage GmbH, Bluephoton LDM375.20.CWA.L, 375 nm, Zeiss LD Plan-neofluar 10×0.4 Korr objective) to illuminate the selected anchoring areas and cause cross-linking of SU-8 molecules. The position of the laser beam was steered by acousto-optic deflectors (A. A. Opto-electronic, DTSXY-400-405) and a beam steering controller (Aresis, BSC-160). After developing the photoresist, the sample was ashed in post-glow oxygen plasma for 60 s and hardbaked. In the final stage of the process, the nickel not covered by the photoresist was etched, first dipped in a cleaning solution (H2O:HNO3:HCl = 2:1:3) and finally etched with a standard chromium etchant (Sigma-Aldrich). The remaining photoresist was removed with acetone and by applying delicate mechanical force.
Figure 1.
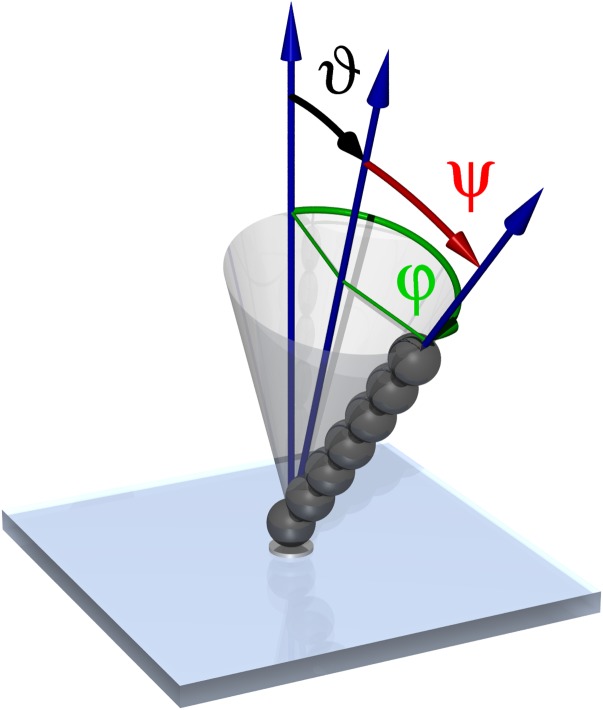
Artificial cilia were made by assembling superparamagnetic particles into chains that were held together and attached to the anchoring points on the glass plate by external magnetic field. The field was used to rotate the cilium along a tilted conical path, defined by the tilt angle of the cone ϑ and semi-cone angle ψ, with the angular frequency ω = dϕ/dt.
The procedure resulted in an array of individual nickel anchoring sites that were approximately 5 μm in diameter and arranged in a square lattice with 28 μm between nearest neighbours. To prevent adhesion between the treated glass slide and the spheres, the slide was additionally coated with BSA, 20 mg/ml, 5 h incubation.
To monitor the fluid flow around a beating cilium and observe the hydrodynamic patterns, small tracer particles were introduced into the system. The tracer particles were non-magnetic fluorescently labelled polystyrene spheres (Dragon Green, Bangs Laboratories, diameter 1 μm). Their concentration was approximately 6 × 10⁻⁴ particles per μm3, corresponding to a volume fraction of 3 × 10⁻⁴, which means that their influence on the fluid motion was negligible. A droplet of the mixture of larger superparamagnetic and smaller non-magnetic beads was placed on the treated glass slide, covered with a microscope cover slip, and sealed with glue to prevent evaporation of water and currents in the cell. The thickness of the cell (200 μm) was regulated by spacers, and to avoid possible wall effects, the flow was mapped in the central part of the cell.
Experimental set-up
The experiments were performed using combined magneto-optical tweezers build around an optical microscope.24 This set-up allowed precise manipulation of microparticles by optical tweezers, accurately controlled magnetic field in the sample and observation and data acquisition through the microscope. The microscope used in the experiment was an inverted optical microscope (Zeiss, Axiovert 200M, Achroplan 63/0.9W objective). For laser tweezers, we used a Nd:YAG laser (Coherent, Compass 2500MN), and the beam was steered by a pair of orthogonal acousto-optic deflectors (A. A. Opto-electronic, DTSXY-250-1064-002) and a beam-steering controller (Aresis, BSC-160). The tweezers were used only for assembly of the beads into chains of uniform length at desired positions and were switched off once the cilia were formed.
Magnetic field within the sample was generated by three mutually orthogonal pairs of water-cooled nearly Helmholtz coils, which insured an almost homogeneous magnetic field at the centre of the sample. By individually regulating electrical currents through the coils using a six-channel current source, we were able to vary the intensity as well as the direction of the magnetic field. Typical magnetic field used in the experiments was between 5 mT and 7 mT. Larger magnetic fields were required for actuation of longer cilia.
The motion of tracer particles was recorded with an Electron Multiplying CCD camera (Hamamatsu Photonics, C9100-13) and analysed off-line using a custom-written particle-tracking software to obtain their trajectories.
Measurement
The assembly of the cilium was done with optical tweezers. The beads were individually trapped and brought into the vicinity of the growing chain (or in the case of the first bead, in the vicinity of a nickel anchoring site). Once roughly placed, the magnetic field was switched on in the direction parallel to the chain that caused attractive interaction and formation of the stable cilium of length L. The direction of the magnetic field was then rotated along a cone, defined by the semi-cone angle ψ and the tilt of the cone ϑ, with the angular frequency ω as shown in Fig. 1. This is the simplest manner of mimicking the beating of the natural cilia, as the motion is both asymmetric and periodic and we have shown previously that this simplified manner suffices for generation of fluid flow.11
Once the cilia were rotating, paths of the fluorescent tracer particles were recorded. Several trajectories from different experiments were combined in order to obtain enough data without the particles influencing each other’s behaviour. Each trajectory was divided into parts that corresponded to the displacement during one complete cycle of the cilium stroke, and each part was then averaged into a single point. The average velocity between the neighbouring points was obtained from the average shift of the tracer in one cilium cycle, and the whole area around the beating cilium was mapped.
For a better comparison of generated flows for different parameters, average velocity in the vicinity of the beating cilium was obtained. Due to uneven distribution of tracer particles, averaging the data over the whole sample yielded unreliable results. We therefore concentrated on the vicinity of the cilium (four squares measuring 40 μm × 40 μm centred at the centre of the tilted cone) only and considered an equal number of measured velocities from each region that were as uniformly distributed as possible. We separately calculated the components of the velocity in the direction in which pumping of the fluid was expected, and the direction in which it was not.
Simulation
We describe the cilium as a chain of N equal beads one of which is anchored to the surface and all are subject to magnetic dipole-dipole, as well as hard-core repulsive interactions. In addition, each bead is subject to the gravitational force, reduced by buoyancy. All the procedures are described in detail in a previous paper.11 We describe the hydrodynamics using the mobility matrix formalism. If the particles were at large distances relative to their sizes, the elements of the mobility matrix would be determined by Blake’s tensor,25 which describes the flow field of a point force in the presence of a no-slip boundary. Because this is not the case in our system, we use the next higher approximation, which is the Rotne-Prager tensor26 in the presence of a boundary. We solve the equations of motion numerically using the Euler method. All parameters were obtained from the physical properties of the system, which means that the simulation result is independent of the experiment and involves no fit parameters.
RESULTS AND DISCUSSION
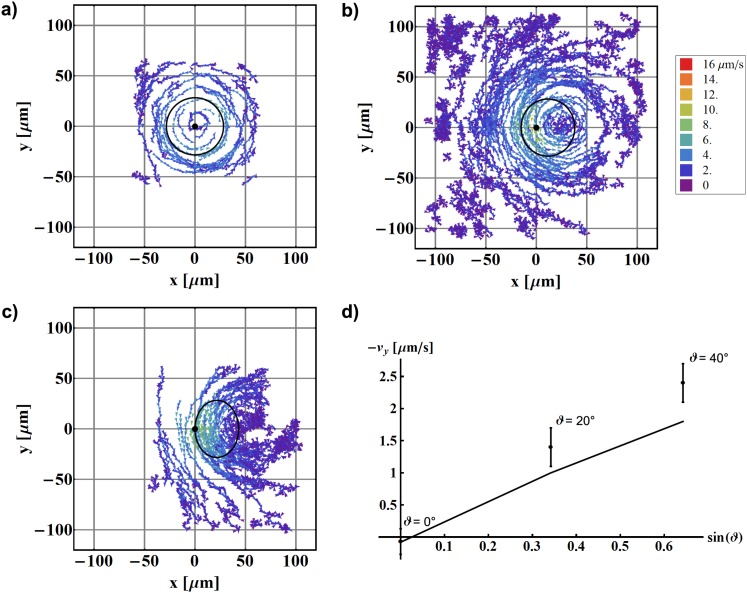
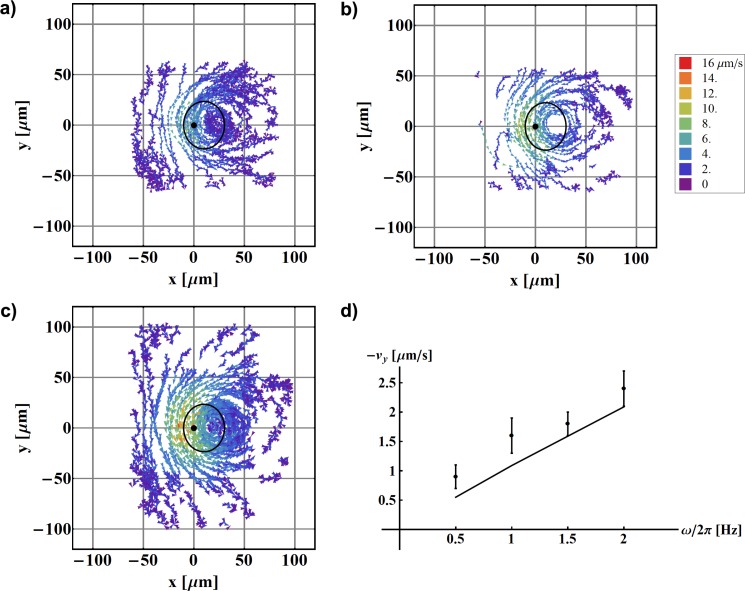
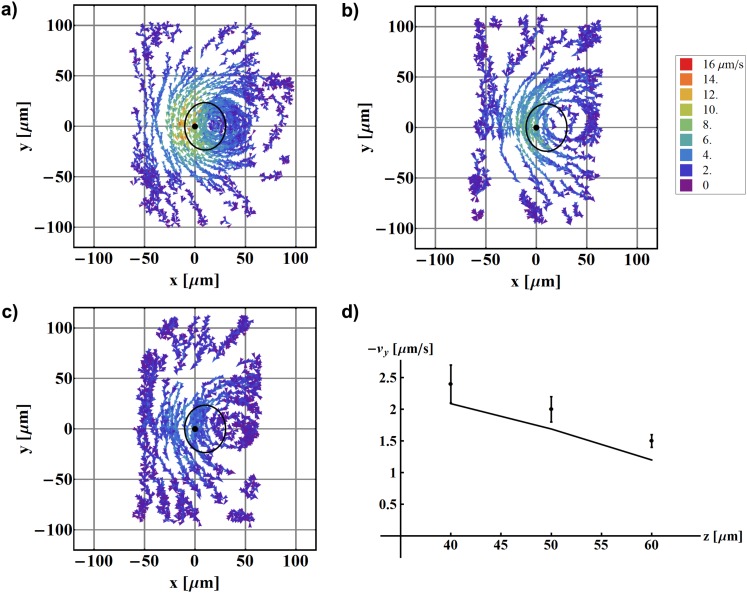
Obtained maps of fluid flow around one beating cilium at different experimental conditions are shown in Figs. 234. In all cases, the centre of the flow map (x = 0 and y = 0) coincides with the anchoring site of the cilium (black dot). The calculated projection of the tip of the cilium, which rotated in the anticlockwise direction, is also displayed as a black solid line. The velocities of the tracer particles are coloured corresponding to their value: the brighter the colour, the faster the particle and larger the observed flow velocity.
Figure 2.
Mapping of fluid flow around one beating artificial cilium as a function of cone tilt angle ϑ. The cilium is fixed at (0,0) and the black solid line denotes the calculated path of the cilium tip. (a) ; (b) ; (c) . All other parameters remain the same: L = 44 μm, ψ = 40°, ω/2π = 1 Hz, z = 57.2 μm. In (a) and (c) only traces of particles from a limited region above the cilium are shown; In (b) traces of more distant particles, where Brownian motion dominates, are also included; (d) the measured average velocities in the pumping direction (dots) and values obtained from the simulation (line). Both show linear dependence on as predicted by theory.
Figure 3.
Mapping of fluid flow around one beating artificial cilium as a function of rotational frequency. The cilium is fixed at (0,0) and the black solid line denotes the calculated path of the cilium tip. (a) ω/2π = 1 Hz; (b) ω/2π = 1.5 Hz; (c) ω/2π = 2 Hz. All other parameters remain the same: L = 30.8 μm, ψ = 49.6°, , z = 40 μm. (d) The measured average velocities in the pumping direction (dots) and predictions from the simulation (line). Both show linear dependence on ω.
Figure 4.
Mapping of fluid flow around one beating artificial cilium as a function of height above the surface z. The cilium is fixed at (0,0) and the black solid line denotes the calculated path of the cilium tip. (a) z = 40 μm; (b) z = 50 μm; (c) z = 60 μm. All other parameters remain the same: L = 30.8 μm, ψ = 49.6°, , ω/2π = 2 Hz. (d) shows the measured average velocities in the pumping direction (dots) and values obtained from the simulation (line).
One clearly sees a combined flow of vortical movement in the vicinity of the cilium and a translational net flow at larger distances when the cilium undergoes an asymmetric motion. Far away from the cilium, the motion of the particles is governed by the Brownian motion, which is apparent from the low velocity and random direction.
Asymmetry dependence
One of the main parameters that determine the performance and the pumping efficiency of a cilium is the asymmetry of the beating. Following Purcell’s theorem, non-reciprocity in the beating pattern is required in order to generate flow in fluids. In our simplified model, the cilium is rotated along a cone defined by the semi-cone angle ψ and the tilt of the cone ϑ. According to theoretical predictions,5 the pumping velocity is proportional to , yielding maximal velocity at ψ ≈ 55° and . These conditions, however, are very difficult to obtain experimentally as the cilium would touch the surface at the lowest point in the cycle. In the experiment, the maximum possible angle was found to be around . Taking into account this restriction, the optimal opening and tilt angles are ψ ≈ 49.6° and .
We have performed experiments at different tilt angles ϑ and observed the flow patterns and pumping of the fluid. The obtained results for a given cilium length are shown in Figs. 2a–2c. First, a control measurement was performed with the tilt angle . In this case, only vortical pattern was observed, centred at the centre of the cilium. No net pumping is detected, as the average velocities in both x and y directions equal 0 μm/s within experimental error. With increasing tilt angle, the pumping performance is enhanced, and one clearly sees an increase in the average velocity in the y direction, corresponding to an observable net flow, and practically no flow in the x direction. The observed effect is expected: taking into account the symmetry of the system, there should be no net flow in the x direction and only pumping in the y direction should be observed. The average y-component of the velocity as a function of the tilt angle ϑ is shown in Fig. 2d and compared with the prediction of a numerical simulation.
By comparing maximal flow efficiency at optimal tilt and semi-cone angle with the one obtained at , one observes a slight increase in maximal measured velocity. The difference in the average flow velocity, however, is within the experimental error of the measurement. This is also apparent from the calculated numerical values for pumping velocity that yield approx. 10% difference between the optimal ϑ and ψ in comparison with .
Mapping the fluid flow
Another important parameter that is directly reflected in the pumping of the fluid is the frequency of the cilium rotation. The obtained flow maps for three different frequencies are shown in Figs. 3a–3c and the average velocities in Fig. 3d. In this case, an agreement with the theoretical predictions is found, according to which the flow velocity should be proportional to frequency of the rotation of the cilium.
All the data shown so far have been recorded at a given height z above the glass plate that was chosen to be 30% of the cilium length above the tip of the cilium in the vertical position. The generated fluid flow and the net pumping velocity, however, depend strongly on the height z above the surface. This is best seen in Figs. 4a–4c where fluid flows are mapped at three different heights z. The average velocities corresponding to the data are shown in Fig. 4d, and a clear decrease in the velocity is observed with increasing z (cilium length is L = 30.8 μm). We estimate that the maximal height at which a measurable net flow is observed reaches beyond 100 μm. For larger heights, we expect that the average flow reduces to zero and the tracer particle movement is governed by the Brownian motion.
Array of cilia
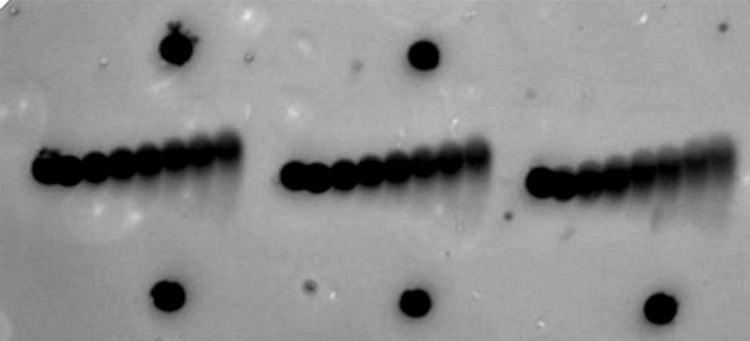
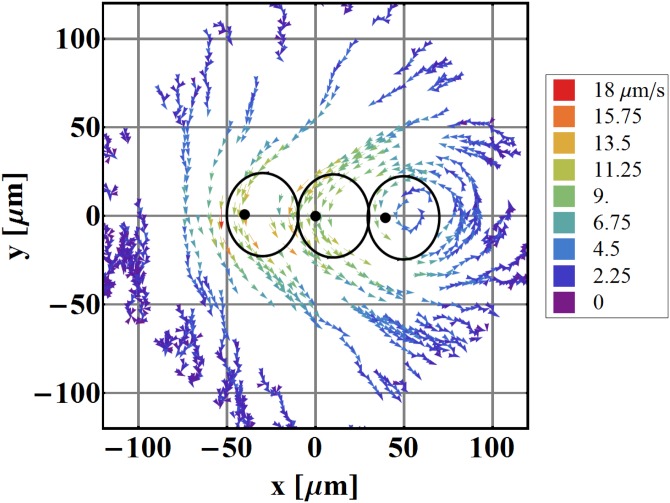
The next step towards an artificially ciliated surface is to create a linear array of individual cilia. For this purpose, we assembled three cilia on a glass plate as seen in Fig. 5. Here the motion of all cilia contributes to a combined fluid flow in the sample and the measured flow is shown in Fig. 6. Two phenomena are observed: first, the maximal fluid velocity is larger than in the case of one cilium only; and second, the flow is much more uniform. Vortical flow is only observed around one cilium (far right in Fig. 6) as this is where the array ends. Between the cilia, where two unequal competing flows collide, the net flow is in the direction of the larger flow but slightly reduced in comparison with the flow of one cilium only. At the other end of the array, however, the flow in the pumping direction is enhanced in comparison with one cilium only, and the flow around this cilium is much more uniform.
Figure 5.
A photograph of an array of three artificial cilia made of superparamagnetic spheres and attached to the glass surface on one side via nickel anchoring sites (dark dots, some are unoccupied). Smaller fluorescent tracer particles (bright spots) were used to map the fluid flow around the beating cilia. The length of each cilium is L = 30.8 μm.
Figure 6.
Mapping of fluid flow around three linearly arranged artificial cilia. Black dots denote the anchoring sites and the solid lines the calculated paths of the tips of the cilia. ω/2π = 2 Hz; L = 30.8 μm, ψ = 49.6°, , z = 40 μm. The velocity scale is different than in other images due to larger pumping effects.
From this image, it is quite clear that an even larger (or 2-dimensional) array of cilia would result in an unvarying flow above the ciliated surface. This would not be true for the flow at the boundaries, where on one side vortices are expected and on the other side an increased flow velocity would be observed.
CONCLUSIONS
To summarize, we have observed and measured the fluid flow generated by a single artificial cilium, or a small number of them. We could confirm that a symmetrically rotating cilium only generates a rotating flow and that the amplitude of the directed flow depends sensitively on the tilt angle of the cilium. We could also demonstrate directly that by increasing the number of cilia one gradually obtains a region of nearly homogeneous directed flow and that carpets of artificial cilia are suitable as pumps in microfluidic applications.
ACKNOWLEDGMENTS
The authors acknowledge funding by the Slovenian Research Agency, Grant Nos. P1-0192 and J1-2200. This work was supported in part by the European Social Fund of the European Union.
Paper submitted as part of the 2nd European Conference on Microfluidics (Guest Editors: S. Colin and G.L. Morini). The Conference was held in Toulouse, France – December 8–10, 2010.
References
- Hirokawa N., Tanaka Y., Okada Y., and Takeda S., Cell 125, 33 (2006). 10.1016/j.cell.2006.03.002 [DOI] [PubMed] [Google Scholar]
- Supatto W., Fraser S. E., and Vermot J., Biophys. J. 95, L29 (2008). 10.1529/biophysj.108.137786 [DOI] [PMC free article] [PubMed] [Google Scholar]
- Purcell E. M., Am. J. Phys. 45, 3 (1977). 10.1119/1.10903 [DOI] [Google Scholar]
- Gray J., Ciliary Movement (Cambridge University Press, Cambridge, UK, 1928). [Google Scholar]
- Smith D. J., Blake J. R., and Gaffney E. A., J. R. Soc. Interface 5, 567 (2008). 10.1098/rsif.2007.1306 [DOI] [PMC free article] [PubMed] [Google Scholar]
- Darnton N., Turner L., Breuer K., and Berg H. C., Biophys. J. 86, 1863 (2004). 10.1016/S0006-3495(04)74253-8 [DOI] [PMC free article] [PubMed] [Google Scholar]
- Evans B. A., Shields A. R., Carroll R. L., Washburn S., Falvo M. R., and Superfine R., Nano Lett. 7, 1428 (2007). 10.1021/nl070190c [DOI] [PubMed] [Google Scholar]
- den Toonder J., Bos F., Broer D., Filippini L., Gillies M., de Goede J., Mol T., Reijme M., Talen W., Wilderbeek H., Khatavkar V., and Anderson P., Lab Chip 8, 533 (2008). 10.1039/b717681c [DOI] [PubMed] [Google Scholar]
- Khatavkar V. V., Anderson P. D., den Toonder J. M. J., and Meijer H. E. H., Phys. Fluids 19, 083605 (2007). 10.1063/1.2762206 [DOI] [Google Scholar]
- Pokroy B., Epstein A. K., Persson-Gulda M. C. M., and Aizenberg J., Adv. Mater. 21, 463 (2009). 10.1002/adma.200801432 [DOI] [Google Scholar]
- Vilfan M., Potočnik A., Kavčič B., Osterman N., Poberaj I., Vilfan A., and Babič D., Proc. Natl. Acad. Sci. USA 107, 1844 (2010). 10.1073/pnas.0906819106 [DOI] [PMC free article] [PubMed] [Google Scholar]
- Sing C. E., Schmid L., Schneider M. F., Franke T., and Alexander-Katz A., Proc. Natl. Acad. Sci. USA 107, 535 (2010). 10.1073/pnas.0906489107 [DOI] [PMC free article] [PubMed] [Google Scholar]
- Shields A. R., Fiser B. L., Evans B. A., Falvo M. R., Washburn S., and Superfine R., Proc. Natl. Acad. Sci. USA 107, 15670 (2010). 10.1073/pnas.1005127107 [DOI] [PMC free article] [PubMed] [Google Scholar]
- Gauger E. M., Downton M. T., and Stark H., Eur. Phys. J. E 28, 231 (2009). 10.1140/epje/i2008-10388-1 [DOI] [PubMed] [Google Scholar]
- Khaderi S. N., Baltussen M. G., Anderson P. D., Ioan D., den Toonder J. M., and Onck P. R., Phys. Rev. E 79, 046304 (2009). 10.1103/PhysRevE.79.046304 [DOI] [PubMed] [Google Scholar]
- Downton M. T. and Stark H., Europhys. Lett. 85, 44002 (2009). 10.1209/0295-5075/85/44002 [DOI] [Google Scholar]
- Khaderi S. N., Baltussen M. G., Anderson P. D., den Toonder J. M., and Onck P. R., Phys. Rev. E 82, 027302 (2010). 10.1103/PhysRevE.82.027302 [DOI] [PubMed] [Google Scholar]
- Khaderi S. N., Craus C. B., Hussong J., Schorr N., Belardi J., Westerweel J., Prucker O., Rühe J., den Toonder J. M., and Onck P. R., Lab Chip 11, 2002 (2011). 10.1039/c0lc00411a [DOI] [PubMed] [Google Scholar]
- Hussong J., Schorr N., Belardi J., Prucker O., Rühe J., and Westerweel J., Lab Chip 11, 2017 (2011). 10.1039/c0lc00722f [DOI] [PubMed] [Google Scholar]
- Fahrni F., Prins M. W., and van IJzendoorn L. J., Lab Chip 9, 3413 (2009). 10.1039/b908578e [DOI] [PubMed] [Google Scholar]
- Timonen J. V., Johans C., Kontturi K., Walther A., Ikkala O., and Ras R. H., ACS Appl. Mater. Interfaces 2, 2226 (2010). 10.1021/am100244x [DOI] [PubMed] [Google Scholar]
- Fonnum G., Johansson C., Molteberg A., Mørup S., and Aksnes E., J. Magn. Magn. Mater. 293, 41 (2005). 10.1016/j.jmmm.2005.01.041 [DOI] [Google Scholar]
- Kavčič B., Babič D., Osterman N., Podobnik B., and Poberaj I., Appl. Phys. Lett. 95, 023504 (2009). 10.1063/1.3176969 [DOI] [Google Scholar]
- Kotar J., Vilfan M., Osterman N., Babič D., Čopič M., and Poberaj I., Phys. Rev. Lett. 96, 207801 (2006). 10.1103/PhysRevLett.96.207801 [DOI] [PubMed] [Google Scholar]
- Blake J. R., Proc. Camb. Phil. Soc. 70, 303 (1971). 10.1017/S0305004100049902 [DOI] [Google Scholar]
- Rotne J. and Prager S., J. Chem. Phys. 50, 4831 (1969). 10.1063/1.1670977 [DOI] [Google Scholar]


