Abstract
Microvascular network formation is a significant and challenging goal in the engineering of large three-dimensional artificial tissue structures. We show here the development of a fully patent, 3D endothelial cell (microvascular) microfluidic network that has a single inlet and outlet, created in only 28 h in a microdevice involving fluid flow equivalent to natural vasculature. Our microdevice features a tailored “multi-rung ladder” network, a stylized mimic of an arterial-to-venous pedicle, designed to also allow for systematic and reproducible cell seeding. Immunofluorescence staining revealed a highly contiguous endothelial monolayer (human umbilical vein endothelial cells) throughout the whole network after 24 h of continuous perfusion. This network persisted for up to 72 h of culture, providing a useful template from which the effects of surface chemistry, fluid flow, and environmental conditions on the development of artificial vascular networks ex vivo may be rapidly and robustly evaluated.
INTRODUCTION
A limiting factor in the field of tissue engineering is the current inability to vascularize large three-dimensional scaffolds, either during in vitro pre-culture or in vivo post-implantation. In the absence of a vascular network, metabolite supply and cell viability in a scaffold is compromised when diffusion distances are greater than 150–200 μm.1 As a result, tissue engineering has been largely limited to thin or avascular tissues such as skin or cartilage. Indeed, the ability to incorporate a microcirculatory network into the scaffold will facilitate the development of large 3D tissue constructs by ensuring adequate supply of critical metabolites and elution of waste products. From a practical perspective, such a construct should have a single inlet and outlet to allow rapid connection to the host blood supply upon implantation and thus facilitate immediate neo-vascularization. In addition, designing a network structure that mimics the most relevant architectural features of the vasculature and in doing so replicates the relevant kinematics of fluid flow in physiologically healthy vascular systems, is an important and critical step in realising vascularized 3D constructs.2, 3, 4
A very ambitious target in tissue engineering is to generate an in vitro microvasculature. Over the past decade, several investigators have pursued this target from a variety of avenues. However, while these studies have claimed the generation of 3D vascular network templates2, 4, 5, 6, 7, 8, 9 and endothelialized vessels,3, 6, 7, 8, 10, 11 no study to date has shown a completely patent, contiguous endothelial cell layer throughout a 3D “vascular” network, created under fluid flow equivalent to natural vasculature and having a single inlet and outlet, even for short term.
The objective of this paper was to, in using microfabrication, generate a 3D “vascular” network that allows rapid, uniform, and complete endothelialization and that may in the future be translated to tissue engineering applications. Microfabrication is the most commonly used method of engineering microvasculature. Its main advantage over other methods used in microvascular tissue engineering is that it can achieve a resolution of 10 μm, on the same length vessel width as the smallest capillaries.5, 8
The most popular polymer used in microfabrication is polydimethylsiloxane (PDMS).12 It is ubiquitous and inexpensive, but it is not biodegradable and has limited biocompatibility. Therefore, constructs fabricated using such a material will not be suitable for implantation. However, PDMS devices are useful for studying fluid dynamics in network designs and probing cell behaviour.5, 13, 14
In the study by Shin and colleagues,13 the vascular network designed by Weinberg and colleagues9 was incorporated into a PDMS device and seeded with immortalized human microvascular endothelial cells. After one week of perfusion, the cells appeared confluent at sections shown, and they were maintained in the channels for another week. While the study mentioned that cell attachment was observed at the top and bottom of channels using light microscopy, no specific results were presented. It would be interesting to visualize the level of endothelialization throughout the network since the design had a wide factor-of-100 variation in wall shear stress. Such a wide variation in wall shear stress was a feature in our multishear device.15 Indeed, we showed that endothelial cell attachment will vary over this range of shear stress and it will be difficult to achieve rapid, uniform, and complete endothelialization in such a network. Interestingly, the design by Weinberg and colleagues9 was also used in a study by Fidowski and colleagues,6 which involved culturing human umbilical vein endothelial cells (HUVECs) in a poly(glycerol-sebacate) device. However, a confluent endothelial monolayer was seen at only parts of the network during the 14 day culture. Realising the need for a uniform wall shear stress throughtout the network, Weinberg and colleagues9 designed another network where 95% of the vessels had a shear stress within the physiological range (15–30 dynes cm−2, 1.5–3 Pa). Nevertheless, this shear range may still be too wide for some cells, such as HUVECs.15
Wang and Hsu14 also recognised the need for each branch in a microvascular network design to have similar velocity profiles in order for oxygen and nutrient to be uniformly transported to all cells in the network. Their design principal was a network made up of multiple branches with no more than two vertical nodes in individual branch. The vascular network was generated using microfabrication with a number of materials, including PDMS, for cell culturing.4, 14 However, besides cell seeding studies that showed dynamic seeding to be more efficient than static seeding, their study, nor any subsequently have shown the degree of endothelialization in this network design.
In this work, we show the development, in less than 28 h, of a fully patent, microcirculatory network, composed of a contiguous monolayer of HUVECs, that mimics the architecture of, and fluid flow within, a natural arterial-to-venous pedicle. We propose that the microdevice offers significant utility to the investigation of optimal surface, flow, and environmental conditions necessary to establish 3D vascular networks ex vivo. This in vitro microcirculatory mimic is also seen as a useful research tool for angiogenesis studies and cancer drug screening and testing.
METHODS
Design and fabrication
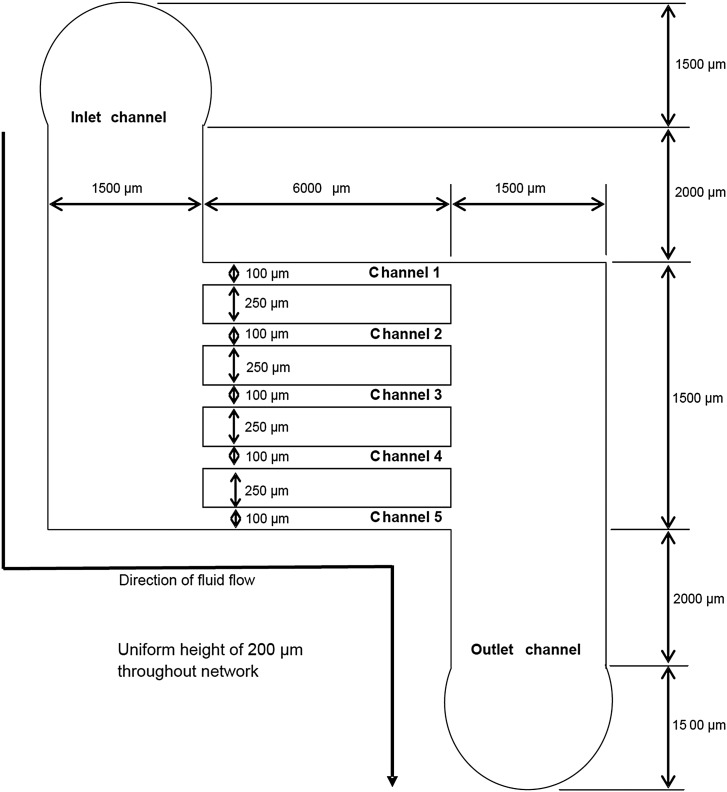
The vascular network design was a simple ladder-like structure with an inlet channel and an outlet channel connected by five microchannels (Fig. 1). It was specified to have a single inlet and outlet to allow, in the future, easy connection to host vascular supply upon implantation and thus facilitate immediate neo-vascularization. Futher, other design criteria included mimmicking natural vasculature dimensions and fluid dynamics for appropriate cell development, and the presence of uniform velocity profiles of similar magnitude in all its channels to allow uniform distribution of nutrients to all cells throughout the network.
Figure 1.
Schematic of the microvascular network design.
The dominant design principle for the specification of the architecture of the device was based on the specification that the pressure drop in the microchannels, ΔP2, was significantly greater in comparison to the pressure drop in the inlet channel, ΔP1, i.e., ΔP2 ≫ ΔP1. Initially, an arbitrary inlet channel flow rate of 2 μl min−1 (3.33 × 10⁻¹¹ m3 s−1) was set, and the dimensions of the channels were chosen to be within the size ranges of natural vasculature (diameter of arteries, arterioles, venules, and veins are 4000, 30, 20, and 5000 μm, respectively)1 and to match nominal in vivo diffusion distances2 (i.e., spacing between microchannels was set to 250 μm). The final dimensions of the device were obtained after a series of iterative calculations, adjusting the dimensions of the inlet, outlet, and branch channels until two criteria were met: (1) they were within the above listed arterial-to-venous dimensions; and (2) ΔP2 ≫ ΔP1. The inlet channel flow rate was assumed to split evenly into the five microchannels (i.e., fluid flow into each microchannel was 0.4 μl min−1, 6.67 × 10⁻¹² m3 s−1). The flow within a microchannel is given by Q=ΔP/R, where Q is the flow rate (m3 s−1), ΔP is the pressure drop across the channel (Pa), and R is the channel resistance (kg m−4 s−1). The resistance of a rectangular microchannel with aspect ratio of 2 (i.e., w ≈ h, where w is the width and h is the height) can be found by16
| (1) |
where μ is the viscosity of the media (i.e., 0.001 Pa s), and L is the length of the channel (m). After a series of iterative calculations, the dimensions for the inlet and outlet channels were set at: L = 1500 μm, h = 200 μm, and w = 1500 μm, giving an equivalent hydraulic diameter (Dh = 2wh/(w + h)) of 353 μm. Similarly, dimensions of the microchannels were set at: L = 6000 μm, h = 200 μm, w = 100 μm, and Dh = 133 μm. These final dimensions were thus within the size ranges of natural vasculature and resulted in values of ΔP1 being equal to 0.05 Pa and ΔP2 being equal to 3.5 Pa, meeting the required design criteria for the device.
Wall shear stress, τw, was estimated using17, 18
| (2) |
where m and n are empirical constants, with m = 1.7 + 0.5α−1.4 and n = 2 + 0.3(α − 1/3) (for aspect ratio α ≥ 1/3) or n = 2 (for aspect ratio α ≤ 1/3). Since the channels are rectangular, there are two wall shear stresses, horizontal wall shear stress (τwh) and vertical wall shear stress (τwv).
For the inlet and outlet channels, τwh was calculated to be 0.037 dynes cm−2 (0.0037 Pa) and τwv was 0.012 dynes cm−2 (0.0012 Pa). For the microchannels, τwh was calculated to be 0.18 dynes cm−2 (0.018 Pa) and τwv was 0.27 dynes cm−2 (0.027 Pa). The Reynolds number (Re = vDhρ/μ, where v is the velocity, and ρ is the density of the media (998.2 kg m−3)) was also calculated to ensure laminar flow and established Poiseuille flow profiles in the channels.
To validate the device design, fluid flow profiles in the device were obtained using micro particle image velocimetry (μPIV).19, 20 In order to obtain the most accurate velocity and wall shear stress values possible, the velocity profiles in the microchannels were characterized both in the horizontal and vertical planes. To clarify, a horizontal plane within a channel refers to the plane that runs horizontally from one side of the channel to the other. Therefore, a vertical plane within a channel refers to the plane that runs vertically from top to bottom of a channel. However, due to the planar network design of the device, only flow profiles in horizontal planes were captured using μPIV. Therefore, the vertical velocity profiles were indirectly obtained by scanning through the different horizontal planes. Velocity profiles across the horizontal and vertical planes were averaged to obtain “superficial velocity” profiles for the horizontal and vertical planes, respectively.
The inlet flow rate used for μPIV was 2 μl min−1. For all measurements, the fluid was seeded with red fluorescent particles of mean diameter 0.49 μm. A TSI PIVCAM 13-8 CCD (1280 × 1024 pixel resolution) camera synchronized with a dual-head Nd:YAG pulse laser was used to obtain sequential images. A Nikkon Plan Fluor 20×/0.5 DIC M/N2 microscope objective was used throughout the experiment. The time delay between two images was 40 ms. A total of 25 instantaneous velocity vector fields were extracted from the particle images and ensemble-averaged to calculate the mean local velocity. A 32 × 32 (pixel) interrogation window with 50–75% overlapping was used. Velocity fields were then obtained using MATLAB, and wall and fluid shear stresses were derived from plots of velocity versus displacement (i.e., τ =μdVz/dx = −2μVmaxx/((w/2)2) since Vz = Vmax[1 − (x2/((w/2)2))] where τ = shear stress, μ = viscosity, Vz = velocity in the plane of interest (i.e., horizontal or vertical planes of channel), x = position from center of velocity profile, Vmax = maximum velocity, and w = width of channel). The data presented represents the average of three separate experiments, with a new device used each time.
The device was fabricated using conventional microfabrication techniques involving SU-8 photolithography and PDMS soft lithography. Designs of the device were generated using AUTOCAD, and a chrome mask of the design was obtained (Bandwidth Foundry, NSW, Australia). The chrome mask was used in photolithography, and a 365 nm light source (OAI, San Jose, CA, USA) was used to yield masters composed of a positive relief of SU-8 photoresist on a silicon wafer. The pattern created on the silicon wafers was replicated in PDMS (i.e., silicone elastomer). Silicone elastomer (Sylgard 184, Dow Corning, Midland, MI) was mixed 10:1 (w/w) with silicone elastomer curing agent. The mixture was poured over the patterned wafer to completely cover the pattern and placed in the oven for 40 min at 60 °C to cure. The PDMS replica of the network design was cut out and finally bonded to a clean glass slide using an air plasma to produce a sealed microfludic network. To ensure a tight seal, the inlet and outlet were fabricated by curing silicone tubing into PDMS. The height and width of the channels were assessed using Optical Profilometer (Veeco NT100, Wyko). A two-point profile was established to analyze the cross-section of the channels at the middle of the network, showing the widths to be 100 ± 15 μm and heights to be 210 ± 15 μm. The measured dimensional values were used to reassess the range of wall shear stresses in the network design. For the microchannels, the range of wall shear stresses was recalculated to be: τwv = 0.2 to 0.4 dynes cm−2 (0.02 to 0.04 Pa) and τwh = 0.1 to 0.2 dynes cm−2 (0.01 to 0.02 Pa). Similarly, the range of wall shear stresses for the inlet and outlet channels were recalculated to be: τwv = 0.01 dynes cm−2 (0.001 Pa) and τwh = 0.03 to 0.04 dynes cm−2 (0.003 to 0.004 Pa).
Cells
HUVECs were harvested from human umbilical cords (under approved human ethics from the University of Queensland). The cells were isolated by perfusing the veins with a digests solution (0.2% w/v Collagenase Type 2 (Worthington) in Hank’s balanced salts solution (Sigma) for 10 min at 37 °C. Initial harvested cells were grown at 40 000 cells per well in 6-well plates (coated with 1% gelatin (Type B from bovine skin, Sigma)) in medium RPMI 1640 (Gibco) with 10% fetal bovine serum (Gibco), 100 μg ml−1 endothelial cell growth supplement (ECGS, BD BioSciences), 50 μg ml−1 heparin (Sigma), and 100 μg ml−1 penicillin/streptomycin. Cell culture was conducted in a humidified 5% CO2 and 95% air incubator at 37 °C. Cells from passage 2 were grown in tissue culture flasks with the same culture and medium condition as aforementioned. Only cells from passages 4 to 8 were used in experiments.
Perfusion
After bonding, the devices were sterilized by autoclaving and allowed to cool down overnight in a laminar flow hood. The channels of the device were then coated with fibronectin (human plasma, Sigma) via injection of a solution of 100 μg ml−1 fibronectin in PBS into the device and incubated for 1 h at room temperature. The channels were then washed with PBS to remove unattached fibronectin. A cell suspension of 1 × 10⁸ cells ml−1 was injected into the fibronectin coated channels and incubated at 37 °C for 1 h. Under static conditions, the cells were observed to settle on the bottom of the channels within 15 min and attach within 30–120 min. Thereafter, the device was injected with fresh cell suspension and rotated 90° after 1 h incubation until all four walls of the device channels were lined with cells. The device was then connected to a peristaltic pump, and silicon tubing was connected to the system to provide bubble-free oxygen supply. The network was perfused at an inlet flow rate of 24 μl min−1 (steadily ramped up from 0 ml h−1 in 1 min) for 24 h. The cells were then fixed and immunostained. The data presented represents the average of three separate experiments. Student t-test was peformed and the results are represented as mean ± SE.
Immunofluorescence labelling
For 3D images from confocal microscopy, the cells were stained for von Willebrand factor (vWF), actin stress fibres, and nuclei. The microdevice was rinsed with phosphate buffered saline. The cells were then fixed with 4% paraformaldehyde in PBS solution for 10 min and permeabilized with 1% Triton-X100 in PBS for 10 min. The device was incubated with 3% bovine serum albumin (BSA, Sigma) in PBS for 30 min to prevent nonspecific binding. The vWF of the cells was labelled with indirect immunofluorescence staining. First, polyclonal rabbit anti-human vWF antibody (DakoCytomation, Denmark) at a 1:400 dilution was used to incubate the cells for 45 min at room temperature (∼20 °C). Alexa Fluor 633 (λem = 647 nm) conjugated goat anti-rabbit IgG (Molecule Probes, USA) was used to label the cells as the secondary antibody at a dilution of 1:250 for 30 min at room temperature. Cells were thereafter rinsed with PBS. Alexa fluor 488 phalloidin (λem = 518 nm) was used to label the actin stress fibres of the cytoskeleton of the HUVECs at a dilution of 1:50 for 30 min at room temperature. Nuclei staining was carried out using Hoescht 33342 (Invitrogen, λem = 483 nm).
To analyze the integrity of the HUVEC monolayer, the cells were stained for and in the order of vWF, VE-cadherin, and nuclei. Von Willebrand factor and nuclei staining processes were the same as described above. After vWF staining, the device was incubated with 3% BSA for 30 min, again to prevent nonspecific binding. Indirect immunofluorescence staining was used to detect VE-cadherin of cells. Cells were incubated with polyclonal rabbit anti-human VE-cadherin antibody (Cell Signaling Technology) at 1:100 dilution was used to incubate the cells for 2 h at room temperature. Fluorescein isothiocyanate (FITC)-conjugated sheep anti-rabbit IgG (Chemicon, λem = 518 nm) was used to label the cells as the secondary antibody at a dilution of 1:200 for 30 min at room temperature.
Three-dimensional images, Z-stacks, were obtained using a laser scanning microscope LSM 710 (Carl Zeiss MicroImaging GmbH, Jena, Germany) equipped with a continuous wave argon ion laser (Ar-ML Laser). Raw image data were exported from the LSM 710 ZEN software (Carl Zeiss MicroImaging GmbH) to IMAGEJ software for time efficient 3D image reconstruction and assembly of the z-stack to images. Note that the images may appear non-uniform in intensity due to bleaching associated with confocal microscopy during 3D z-stacking.
Fluorescent images were acquired with a Qimaging CCD camera (Retiga Exi FAST 1394) connected to an Olympus BX61 inverted microscope. The fluorescent images obtained from the Qimaging CCD camera on VOLOCITY 5 software were exported to IMAGEJ software for simple analysis, including cell sizes (the area covered per cell). IMAGEJ software was also used to assess cell circularity, which is a measure of elongation. Each cell was outlined using the free hand selection tool of the software. The outline was then assessed by IMAGEJ for circularity with value of 1.0 indicating a perfect circle and decreasing values indicating increasing elongation.
RESULTS AND DISCUSSION
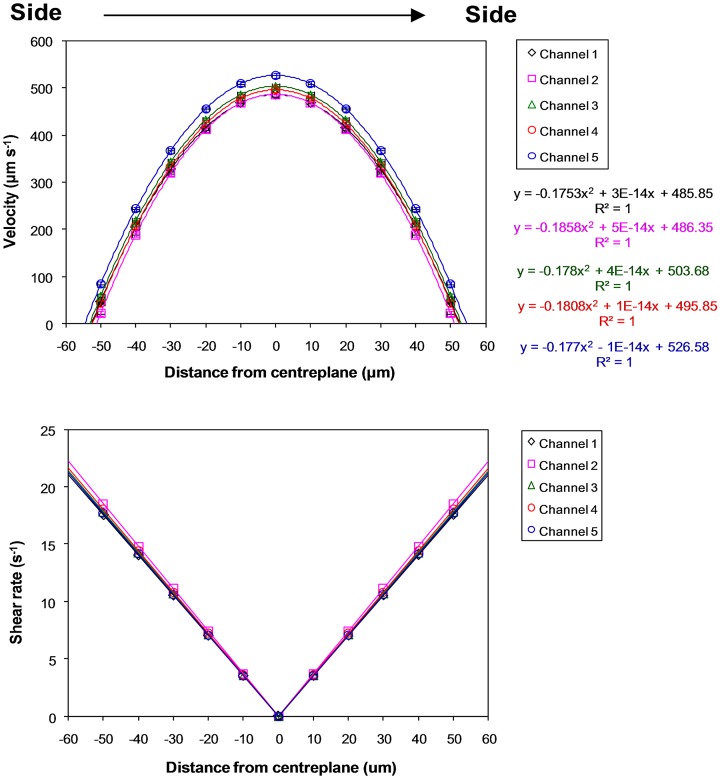
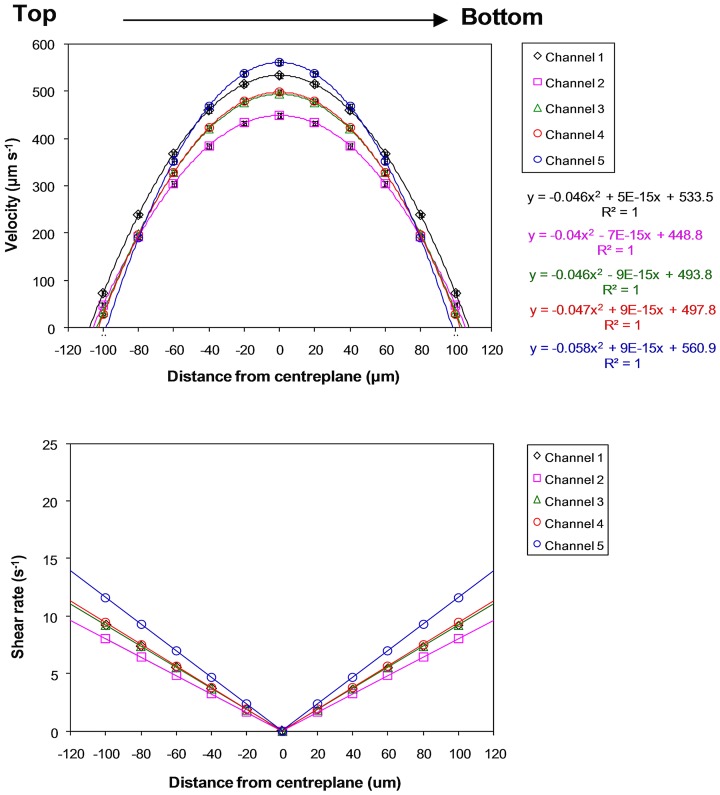
Fig. 2 shows that the measured superficial velocities (319 ± 20 μm s−1) within the microchannels closely agreed with the calculated superficial velocity (333 μm s−1). For further analysis, the horizontal and vertical velocity profiles were graphed and differentiated to obtain the velocity gradient for deriving wall and fluid shear rates and stresses (Figs. 34). Note that shear rates were converted to shear stresses by taking into account the (Newtonian) viscosity of the fluid, i.e., 0.001 Pa s. In short, derived shear stresses for the microchannels, τwv (0.17 ± 0.04 dynes cm−2, 0.017 ± 0.004 Pa) and τwh (0.1 ± 0.003 dynes cm−2, 0.01 ± 0.0003 Pa), closely agree with calculated wall shear stresses (0.18–0.27 dynes cm−2, 0.018–0.027 Pa). The calculated and measured wall shear stresses for the inlet and outlet channels are <0.05 dynes cm−2 (<0.005 Pa), thus validating the vascular network template design. However, since shear stresses are known to influence cell functions15, 16, 21, 22 and our previous work showed that 1–3 dynes cm−2 (0.1–0.3 Pa) is the promising shear range for culturing HUVECs (Ref. 15) in microchannels of similar dimensions, the inlet flow rate was ramped up to 24 μl min−1 in this vascular network to achieve shear stresses of 1.0–2.5 dynes cm−2 (0.1–0.25 Pa) in all of the microchannels.
Figure 2.
Measured superficial velocities from horizontal and vertical velocity profiles compared to calculated superficial velocity. Standard error bars are smaller than the data symbols.
Figure 3.
Horizontal-plane velocity profiles and derived shear rates at an inlet volumetric flow rate of 2 μl min−1 for microchannels in the microvascular microdevice. Distance from the centreplane is along the horizontal plane, from side to side, of channels. Standard error bars are smaller than the data symbols.
Figure 4.
Vertical-plane velocity profiles and derived shear rates at an inlet volumetric flow rate of 2 μl min−1 for microchannels in the microvascular microdevice. Distance from the centreplane is along the vertical plane, from top to bottom, of channels. Standard error bars are smaller than the data symbols.
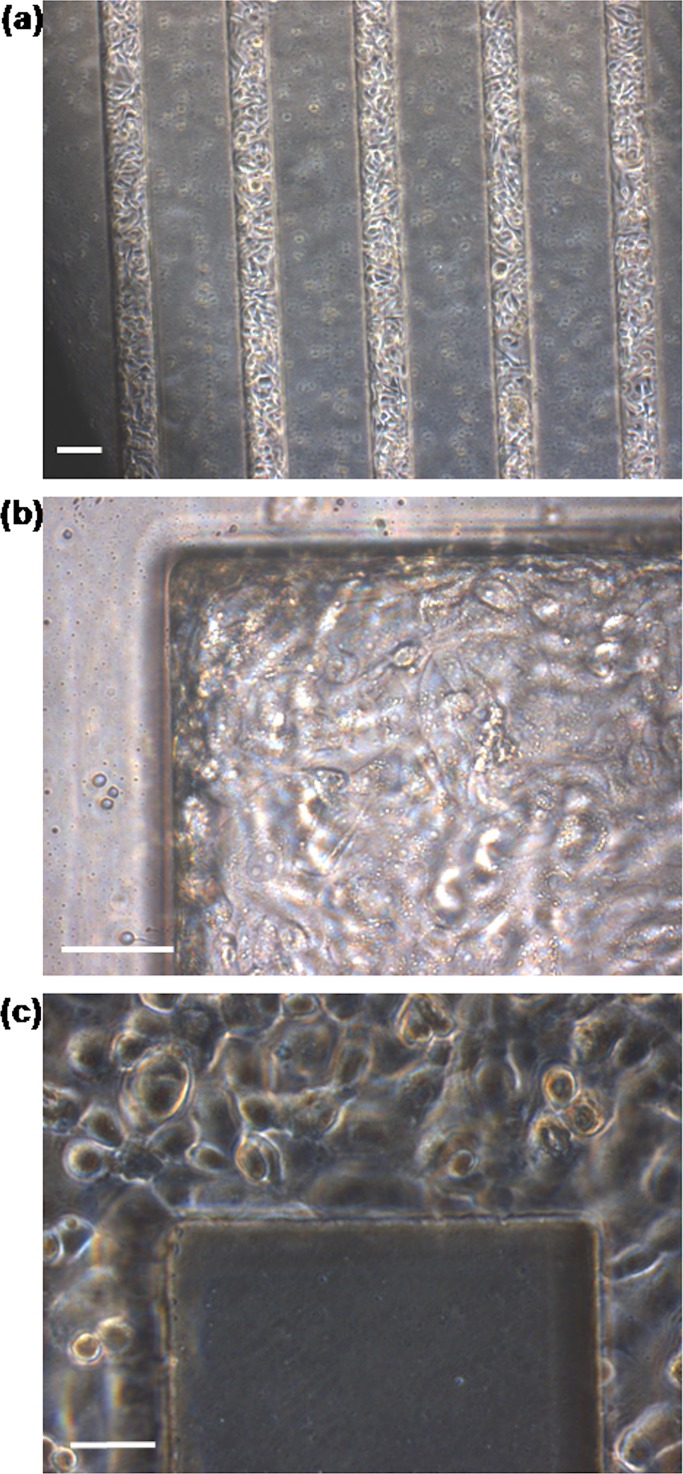
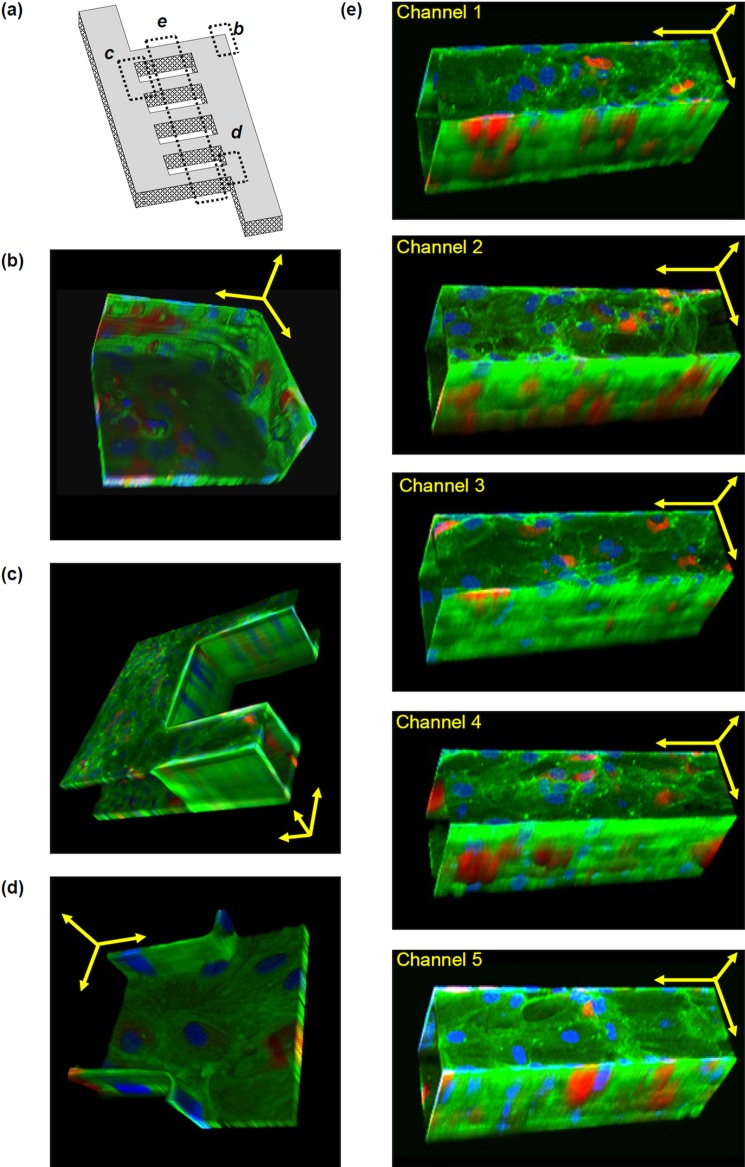
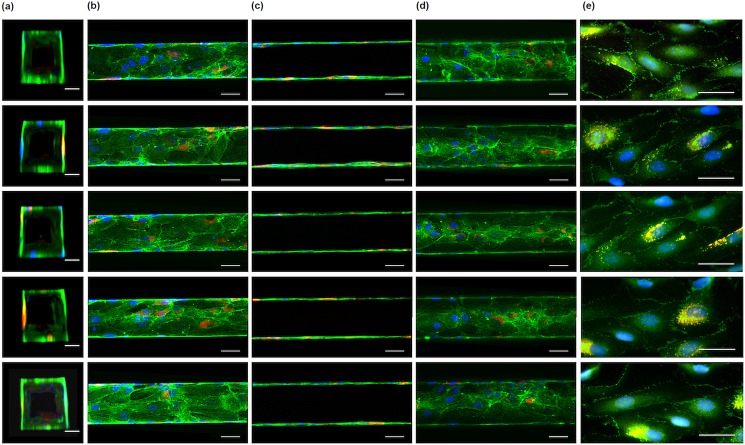
After 24 h perfusion, HUVECs appeared healthy, attached, and spread throughout the network (Fig. 5). To further analyze the extent of 3D endothelialization throughout the vascular network, HUVECs within the device were immunostained for vWF (red), actin stress fibres (phalloidon, green), and nuclei (Hoescht 33342, blue). vWF is a large multimeric plasma protein produced by endothelial cells, and it is involved in promoting platelet adhesion to damaged vessel walls.23 It is used in this experiment as a marker for endothelial cells. Confocal microscopy showed that HUVECs lined all four sides of the microchannels (Fig. 6). Furthermore, the cells appeared similar between the microchannels. Interestingly, while it has been suggested that it is preferable to create circular channels to better mimic natural microvascular vessels,24, 25 the cells actually bridged corners of the rectangular network in this study. This suggests that given an effective network design, hydrodynamics, and nutrients, the cells have the potential to self-assemble and form a patent microvasculature.
Figure 5.
Photomicrographs of HUVECs in microvascular microdevice after 24 h perfusion at an inlet flow rate of 24 μl min−1. (a) HUVECs appeared to form an even confluent layer throughtout all five microchannels. Scale bar: 100 μm. (b), (c) HUVECs lined corners of the microvascular network. Scale bar: 50 μm.
Figure 6.
Tilted 3D images of HUVECs at sections of the microvascular network. HUVECs were immunostained for von Willebrand factor (red), actin stress fibres (green), and nuclei (blue) and found to line all walls and corners of all channels. Von Willebrand factor is observed in all cells, but at different depths. Images only show von Willebrand factor at that plane of view. Since the 3D images are tilted, scale bars are provided only as estimation. Scale bars are shown as yellow arrows in x, y, and z axes. (a) Schematic to show where sections (b)-(e) are located on the overall network. (b) Corner of the network. Scale bar: 50 μm. (c) Between two channels. Scale bar: 100 μm. (d) Entrance into a channel. Scale bar: 50 μm. (e) Microchannels. Scale bars: 100 μm.
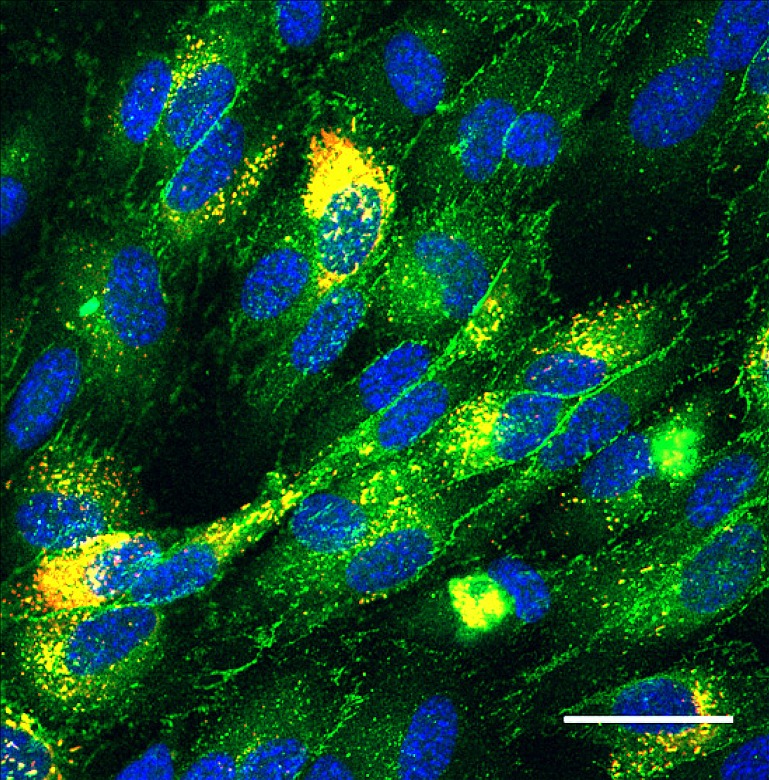
To investigate the integrity of the HUVEC monolayer, the network was stained for VE-cadherin, the major adherens junction protein in endothelial cells; by regulating cell-cell adhesion, this protein regulates vascular permeability and development.26 As shown in Figs. 78, VE-cadherin (green) appears throughout the 3D vascular network, indicating an endothelial monolayer with stable cell-cell adhesions.
Figure 7.
HUVEC lining all microchannels. (a)-(d) HUVEC were immunostained for von Willebrand factor (red), actin stress fibres (green), and nuclei (blue). HUVECs lined all four sides of the channels as shown in vertical cross-sectional (a), top horizontal cross-sectional (b), middle horizontal cross-sectional (c), and bottom horizontal cross-sectional (d) views of the channels. Scale bars: 50 μm. (e) The HUVEC monolayer was immunostained for VE-cadherin (green), von Willebrand factor (red), and nuclei (blue). Green and red channels overlap to give yellow. Scale bars: 50 μm.
Figure 8.
The HUVEC monolayer was immunostained for VE-cadherin (green), von Willebrand factor (red), and nuclei (blue). Green and red channels overlap to give yellow. Scale bar, 50 μm.
Morphological analysis showed that the cells are similar in size throughout the network [Fig. 9a]. This was expected due to there being similar flow profiles in each of the microchannels (Figs. 23). However, while the cells are similar between the microchannels in terms of cell perimeter [Fig. 9b] and circularity [Fig. 9c], significant differences in cell perimeter and circularity were found between the cells in the microchannels and those in the inlet and outlet channels. One explanation for this is that, due to higher shear stresses, the cells in the microchannels are more aligned and elongated with the direction of fluid flow than cells in the inlet or outlet channels. Hence, with elongation, the cells have greater perimeter and lower circularity.
Figure 9.
Quantitative analysis of cell morphology for HUVECs after 24 h perfusion. (a) Cell size of HUVECs after 24 h of perfusion; (b) cell perimeter of HUVECs after 24 h of perfusion; (c) cell circularity of HUVECs after 24 h of perfusion. A circularity value of 1.0 indicates a perfect circle, as the value approaches 0.0 it indicates an increasingly elongated polygon. Data are the mean ± SE.
Interestingly, when compared to results obtained in our previous investigation our multishear microdevice,15 HUVECs cultured in the microchannels used in this current study are more elongated (circularity ∼0.4) than those under similar shear stress range (i.e., 1–3 dynes cm−2) in our multishear microdevice (circularity ∼0.5). The two main differences in conditions between these two studies are: (1) the cells in the microvascular microdevice were perfused for 4 h longer, and (2) the cells were initially sub-confluent in the multishear microdevice, while the cells were confluent in the microvascular microdevice. The 4 h difference in perfusion period may partially explain these findings. However, a more likely explanation of the observed difference in cell morphology is that there was greater cell-to-cell contact in the confluent cell layer, allowing for more rapid orchestration and synchronization between the cells. This consequently resulted in a more rapid response to the imposed flow and shear, than in the case of sub-confluent cells.
The system in this study is currently limited to short-term culture, as the HUVEC monolayers were observed to lift off in sheets after 72 h. Numerous methods, including adjusting the frequency of medium exchange and concentration of growth supplements, were investigated in an attempt to maintain the HUVEC monolayer in culture for longer in the vascular network, but no improvements were seen. The system was also investigated with lower cell densities, but the cells in the channels were observed to also detach after 72 h. Indeed, it is possible that uncured oligomers are leaching out from the PDMS channels and into the the media over time,27 which could have a detrimental effect on the cells’ survival and development. Future studies will attempt to implement the validated vascular network design in a more “cell-friendly” scaffold material for long-term cell study. Alternatively, the PDMS device may be surface modified to improve cell attachment and survival.12
Nevertheless, to the best of our knowledge, achieving a highly endothelialized vascular network in only 28 h has never been achieved before. This was accomplished in this study by combining: (1) an effective vascular network design that has uniform velocity profiles in all its channels, allowing uniform distribution of nutrients to all cells and facilitating cells to rapidly form a microvasculature, and (2) suitable flow and shear stress level for culturing HUVECs in microchannels found in our multishear device.15 In addition, this study also showed that the cells have the ability to bridge corners, which is promising for the use of conventional microfabrication techniques in the development of microvasculature.
Once the vascular network has been established in a material with a stable surface for long-term cell study, it can be seen as an extremely useful tool to investigate vascular assembly, associated optimal surface, flow, and environmental conditions necessary to establish 3D vascular networks ex vivo. Furthermore, since confluent monolayers of endothelial cells replicate many functions of the endothelial barrier and that many of the mechanisms that regulate the formation of confluent endothelial monolayers are poorly understood,28 the rapid assembly of HUVECs to form a microvasculature may be desired in studies aimed at understanding the mechanisms affecting endothelial cell confluency. Overall, the microfabricated microvasculture presented in this study can be seen as a significant contribution to the development of a microvasculature in vitro and perhaps a step closer to realising large 3D tissue-engineered constructs.
CONCLUSIONS
We have shown that a fully artificial, patent endothelialized 3D microcirculatory network can be achieved in only 28 h of culture. This network was shown to persist for up to 72 h of culture. It provides a useful template from which the effects of surface chemistry, fluid flow, and environmental conditions on the development of artificial vascular networks ex vivo may be rapidly and robustly evaluated. Furthermore, such a simple but functional and flexible device platform, which enables the creation of a patent endothelialized microcirculatory network with physiologically relevant flow conditions throughout, may facilitate the optimization of strategies for ex vivo vascularization of 3D tissues.
ACKNOWLEDGMENTS
The authors wish to acknowledge Matthew Cook and Dr. Gary Brooke from the Mater Medical Research Institute and the Australian Institute for Bioengineering and Nanotechnology (AIBN) for providing HUVECs, and funding from Australian Research Council (ARC) Discovery Grants Scheme. This work was performed in part at the Queensland node of the Australian National Fabrication Facility, a company established under the National Collaborative Research Infrastructure Strategy to provide nano and microfabrication facilities for Australia’s researchers. The authors would like to thank Dr. Michael Doran for his helpful suggestions during the course of this investigation.
References
- Folkman J. and Hochberg M., J. Exp. Med. 138, 745 (1973). 10.1084/jem.138.4.745 [DOI] [PMC free article] [PubMed] [Google Scholar]
- Bellan L. M., Singh S. P., Henderson P. W., Porri T. J., Craighead H. G., and Spector J. A., Soft Matter 5, 1297 (2009). 10.1039/b819905a [DOI] [Google Scholar]
- Takei T., Sakai S., Ono T., Ijima H., and Kawakami K., Biotechnol. Bioeng. 95, 1 (2006). 10.1002/bit.v95:1 [DOI] [PubMed] [Google Scholar]
- Wang G. J., Chen C. L., Hsu S. H., and Chiang Y. L., Microsyst. Technol. 12, 120 (2005). 10.1007/s00542-005-0017-7 [DOI] [Google Scholar]
- Borenstein J. T., Terai H., King K. R., Weinberg E. J., Kaazempur-Mofrad M. R., and Vacanti J. P., Biomed. Microdevices 4, 167 (2002). 10.1023/A:1016040212127 [DOI] [PubMed] [Google Scholar]
- Fidkowski C., Kaazempur-Mofrad M. R., Borenstein J., Vacanti J. P., Langer R., and Wang Y., Tissue Eng. 11, 302 (2005). 10.1089/ten.2005.11.302 [DOI] [PubMed] [Google Scholar]
- Golden A. P. and Tien J., Lab Chip 7, 720 (2007). 10.1039/b618409j [DOI] [PubMed] [Google Scholar]
- Kaihara S., Borenstein J., Koka R., Lalan S., Ochoa E. R., Ravens M., Pien H., Cunningham B., and Vacanti J. P., Tissue Eng. 6, 105 (2000). 10.1089/107632700320739 [DOI] [PubMed] [Google Scholar]
- Weinberg E. J., Borenstein J. T., Kaazempur-Mofrad M. R., Orrick B., and Vacanti J. P., Mater. Res. Soc. Symp. Proc. 820, O5.4.1/W9.4.1 (2004). 10.1557/PROC-820-O5.4/W9.4 [DOI] [Google Scholar]
- Ko I. K. and Iwata H., Ann. N Y Acad. Sci. 944, 443 (2001). 10.1111/j.1749-6632.2001.tb03854.x [DOI] [PubMed] [Google Scholar]
- Neumann T., Nicholson B. S., and Sanders J. E., Microvasc. Res. 66, 59 (2003). 10.1016/S0026-2862(03)00040-2 [DOI] [PubMed] [Google Scholar]
- Makamba H., Kim J. H., Lim K., Park N., and Hahn J. H., Electrophoresis 24, 3607 (2003). 10.1002/elps.v24:21 [DOI] [PubMed] [Google Scholar]
- Shin M., Matsuda K., Ishii O., Terai H., Kaazempur-Mofrad M., Borenstein J., Detmar M., and Vacanti J. P., Biomed. Microdevices 6, 269 (2004). 10.1023/B:BMMD.0000048559.29932.27 [DOI] [PubMed] [Google Scholar]
- Wang G. J. and Hsu Y. F., Biomed. Microdevices 8, 51 (2006). 10.1007/s10544-006-6382-x [DOI] [PubMed] [Google Scholar]
- Chau L., Doran M., and Cooper-White J., Lab Chip 9, 1897 (2009). 10.1039/b823180j [DOI] [PubMed] [Google Scholar]
- Beebe D. J., Mensing G. A., and Walker G. M., Annu. Rev. Biomed. Eng. 4, 261 (2002). 10.1146/annurev.bioeng.4.112601.125916 [DOI] [PubMed] [Google Scholar]
- Shah R. K. and London A. L., Laminar Flow Forced Convection in Ducts (Academic, New York, 1978). [Google Scholar]
- Young E. W. and Simmons C. A., Lab Chip 10, 143 (2010). 10.1039/b913390a [DOI] [PubMed] [Google Scholar]
- Santiago J. G., Wereley S. T., Meinhart D. J., Beebe D. J., and Adrian R. J., Exp. Fluids 25, 316 (1998). 10.1007/s003480050235 [DOI] [Google Scholar]
- Lindken R., Rossi M., Grosse S., and Westerweel J., Lab Chip 9, 2551 (2009). 10.1039/b906558j [DOI] [PubMed] [Google Scholar]
- Davies P. F., C. F.Dewey, Jr., Bussolari S. R., Gordon E. J., and M. A.Gimbrone, Jr., J. Clin. Invest. 73, 1121 (1984). 10.1172/JCI111298 [DOI] [PMC free article] [PubMed] [Google Scholar]
- Urbich C., Dernbach E., Reissner A., Vasa M., Zeiher A. M., and Dimmeler S., Arterioscler., Thromb., Vasc. Biol. 22, 69 (2002). 10.1161/hq0102.101518 [DOI] [PubMed] [Google Scholar]
- Ruggeri Z. M., Thromb Haemost 82, 576 (1999). [PubMed] [Google Scholar]
- Abdelgawad M., Wu C., Chien W. Y., Geddie W. R., Jewett M. A., and Sun Y., Lab Chip 11, 545 (2010). 10.1039/c0lc00093k [DOI] [PubMed] [Google Scholar]
- Borenstein J. T., Tupper M. M., Mack P. J., Weinberg E. J., Khalil A. S., Hsiao J., and Garcia-Cardena G., Biomed. Microdevices 12, 71 (2010). 10.1007/s10544-009-9361-1 [DOI] [PubMed] [Google Scholar]
- Lampugnani M. G., Resnati M., Raiteri M., Pigott R., Pisacane A., Houen G., Ruco L. P., and Dejana E., J. Cell Biol. 118, 1511 (1992). 10.1083/jcb.118.6.1511 [DOI] [PMC free article] [PubMed] [Google Scholar]
- Regehr K. J., Domenech M., Koepsel J. T., Carver K. C., Ellison-Zelski S. J., Murphy W. L., Schuler L. A., Alarid E. T., and Beebe D. J., Lab Chip 9, 2132 (2009). 10.1039/b903043c [DOI] [PMC free article] [PubMed] [Google Scholar]
- Corvera S., DiBonaventura C., and Shpetner H. S., J. Biol. Chem. 275, 31414 (2000). 10.1074/jbc.M001708200 [DOI] [PubMed] [Google Scholar]


