Abstract
Enzymatic inhibition by product molecules is an important and widespread phenomenon. We describe an approach to study product inhibition at the single-molecule level. Individual HRP molecules are trapped within surface-tethered lipid vesicles, and their reaction with a fluorogenic substrate is probed. While the substrate readily penetrates into the vesicles, the charged product (resorufin) gets trapped and accumulates inside the vesicles. Surprisingly, individual enzyme molecules are found to stall when a few tens of product molecules accumulate. Bulk enzymology experiments verify that the enzyme is noncompetitively inhibited by resorufin. The initial reaction velocity of individual enzyme molecules and the number of product molecules required for their complete inhibition are broadly distributed and dynamically disordered. The two seemingly unrelated parameters, however, are found to be substantially correlated with each other in each enzyme molecule and over long times. These results suggest that, as a way to counter disorder, enzymes have evolved the means to correlate fluctuations at structurally distinct functional sites.
Keywords: allostery, protein dynamics, single-molecule enzymology
Single-molecule optical spectroscopy has emerged as an important tool for quantitative biological studies aimed at understanding the basic functionality of biological macromolecules and systems (1–3). In particular, recent experimental and theoretical studies have significantly improved our knowledge on enzymatic reaction mechanisms, they provided dynamic information that cannot be gleaned by ensemble techniques (4–6). An important and puzzling finding of some of these studies has been the disorder, either static or dynamic, of the reaction rates of individual enzyme molecules (7–9). Indeed, static disorder (i.e., a variation of the enzymatic turnover rate from one molecule to another) was already observed more than fifteen years ago (10, 11), and it was confirmed in more recent studies (12, 13). In addition, it was found that a single enzyme molecule may jump between several configurational states, each of which possesses a different reaction rate (14–17). These studies have raised important questions regarding the connection between conformational dynamics and chemical reactivity in biomolecular catalysts.
An issue addressed in all single-molecule enzymology experiments has been the method of confinement of the enzyme molecules to facilitate prolonged observation times. Many studies were carried out with the enzyme chemically or physically anchored to a solid support. Typical anchoring methods involve nonspecific adsorption or specific attachment mediated via noncovalent interactions; e.g., using biotin-avidin chemistry (18). Such immobilization procedures may introduce disorder into the system due to interactions of the tethered molecules with the surface, and they can give rise to artifacts (19). A very attractive alternative is to restrict individual molecules within small, optically transparent containers. Examples include lipid vesicles (20–24), self-assembled polymer nanocapsules (25, 26), protein shells of viral capsids (27), and femtoliter chambers chemically etched into the surface of glass optical fibers (28, 29).
Lipid vesicles have been used extensively as nanocontainers for enzymes in diverse biomedical applications (30). Vesicles are particularly useful and versatile, as they can be readily prepared in a large variety of sizes and compositions. In contrast to polymer nanocapsules and glass surfaces, vesicles present an environment more akin to cellular milieus that abound in membranes. An important issue for biochemical experiments within vesicles is the permeability of substrates and products across the lipid membranes forming the vesicular walls. Studies that focused on membrane permeation showed that small, uncharged molecules can penetrate a lipid bilayer, and diffusion across the bilayer depends on the structure and dynamics of the lipid molecules comprising the membrane (31). The intrinsic permeability of vesicular walls has allowed, in some cases, simple diffusion of the substrate from the exterior medium to the enzyme localized in the interior of the vesicles. Examples for that include urease and urea (32), amyloglucosidase and starch (33), and α-chymotrypsin and p-nitroaniline substrates (34).
The same lipid bilayer that allows relatively free diffusion of small uncharged molecules may present a substantial permeability barrier to charged, zwitterionic, and macromolecular species. This selective permeability of the lipid bilayer can lead to a situation where substrates may diffuse into the vesicles, while the exit of encapsulated product molecules is prevented. Such a phenomenon was postulated, for example, in the case of the urea-urease system where the product of the reaction is in the form of an ammonium ion that cannot escape from the vesicle (32). To further tune the permeability properties of vesicles, one could introduce pore-forming bacterial proteins naturally optimized for this purpose [e.g., porins (35, 36) or α-hemolysin (24)], or use the fact that the bilayer permeability is highest at the phase transition temperature (37, 38). Other approaches involve enzymatic modification of cholesterol-containing vesicles by externally added cholesterol oxidase (39), use of lipid/detergent hybrid membranes (40), or by protein-induced membrane destabilization (41).
In this paper, we study the reactions of individual enzyme molecules encapsulated within surface-tethered lipid vesicles. Passive diffusion of substrates into the vesicle is employed in order to observe enzyme operation in real time. The fluorescent product of the reaction accumulates inside the vesicles to micromolar levels that are unattainable in standard single-molecule experiments. Product accumulation allows us to demonstrate allosteric inhibition, one enzyme molecule at a time. Indeed, the product is shown to rebind to the enzyme at a site distinct from the active site and to inhibit the enzymatic reaction. We find that the uninhibited turnover rate of the enzyme and the number of product molecules required for inhibition are broadly distributed. Remarkably, there is significant correlation between the two parameters, indicating that the fluctuations at two distinct functional sites of an enzyme molecule are linked.
Results
Single Enzyme Molecules Trapped within Vesicles Are Active.
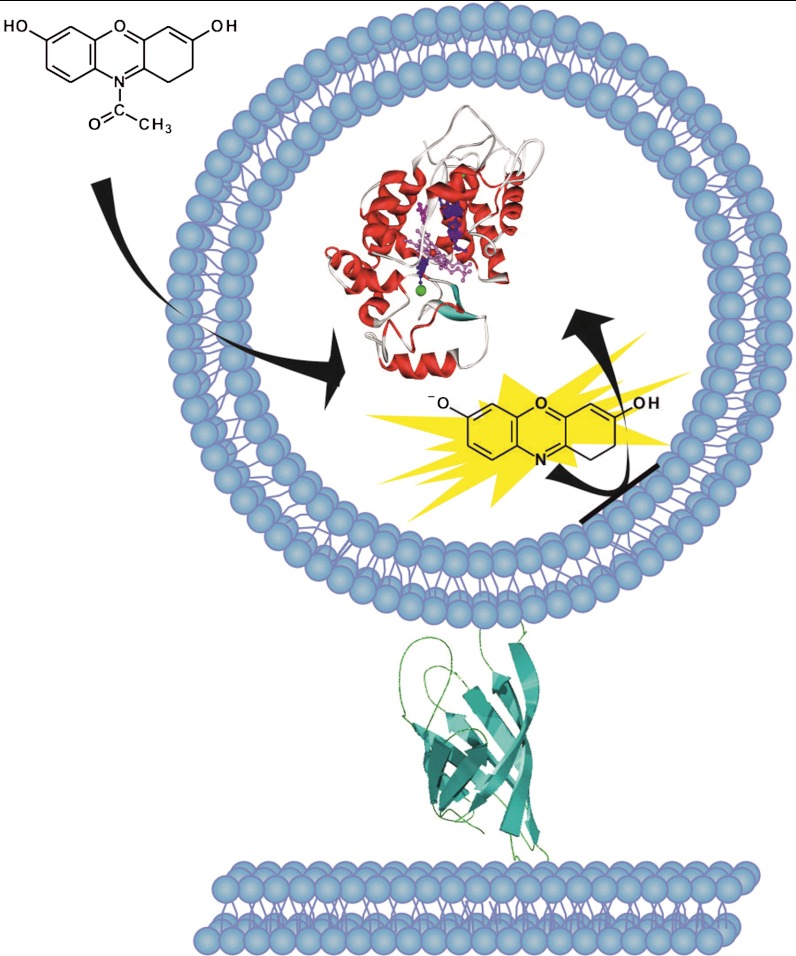
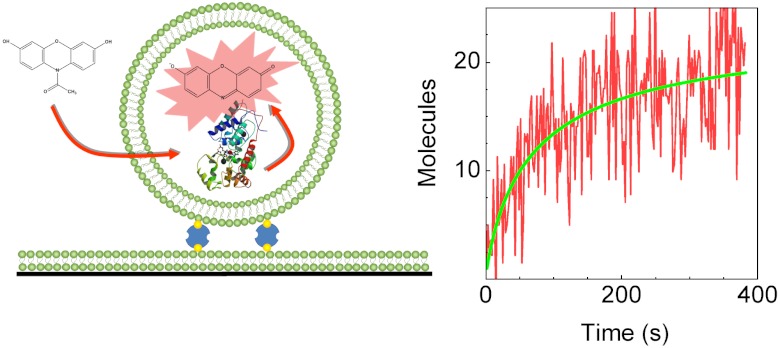
The general strategy of our experiment is outlined in Fig. 1. Lipid vesicles encapsulating individual HRP molecules were tethered to a supported bilayer covering the surfaces of a glass flow cell, using biotin-avidin chemistry (20). The structural disorder that may arise due to direct anchoring of enzyme molecules to the surface is, therefore, avoided when using this trapping method. The trapped vesicles nicely mimic cellular entrapment, as they consist of a biocompatible soft-lipid membrane enclosing a tiny fluid volume. We selected the concentration of HRP molecules (0.5 μM) used during encapsulation to guarantee that most vesicles contained one enzyme molecule. Experiments showed that in practice 25–30% of the vesicles might have contained more than one enzyme molecule (mostly two, see SI Text); however, this has no significant effect on the main conclusion of the paper.
Fig. 1.
An individual enzyme molecule within a lipid vesicle. A large unilamellar vesicle encapsulating a single HRP molecule is attached to a glass-supported lipid bilayer using biotin-avidin chemistry. Externally-added Amplex Red substrate molecules penetrate the vesicle and react with the enzyme, leading to creation of the fluorescent product resorufin that remains trapped in the vesicle interior.
To follow the progress of the enzymatic reaction, we used a strategy similar to that previously reported (29, 42), which is based on HRP-catalyzed oxidation of the nonfluorescent substrate Amplex Red (10-acetyl-3,7-dihydroxyphenoxazine) into the fluorescent product resorufin (7-hydroxy-3H-phenoxazin-3-one) in the presence of hydrogen peroxide. Amplex Red is an uncharged molecule that freely diffuses from the bulk aqueous medium across the lipid bilayer walls and into the aqueous interior of the vesicle, where an enzyme molecule can catalyze its oxidation reaction. Passive diffusion of Amplex Red across lipid membranes was previously used to report changes in H2O2 concentrations inside cells (43). Hydrogen peroxide can also cross biological membranes freely (44).
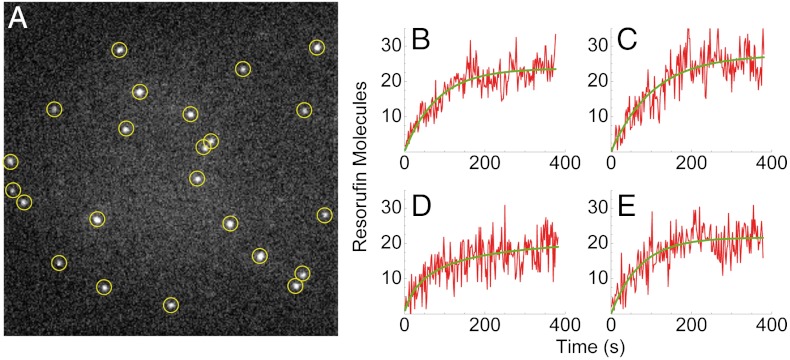
In contrast, we discovered that molecules of the product resorufin cannot cross the phospholipid bilayer at neutral pH due to their negative charge (45), which leads to their accumulation in the vesicle interior. Product generation by individual enzyme molecules could, therefore, be determined by monitoring the increase in fluorescence as the reaction progressed, following its initiation by adding Amplex Red and the cosubstrate H2O2 to surface-tethered vesicles. Fig. 2A shows a microscopic image of a typical sample where the bright spots correspond to the positions of individual vesicles in which the product molecules accumulated to a significant level. No such bright spots were formed when substrates were added to a flow cell containing surface-tethered vesicles without HRP molecules. Furthermore, addition of resorufin to the solution outside the vesicles did not lead to the formation of localized bright spots, indicating no significant adsorption of product molecules on the vesicle surfaces.
Fig. 2.
Fluorescent spots indicate enzymatic activity. (A) Microscope image of a sample with surface-tethered vesicles containing single HRP molecules after incubation with the substrate. The bright spots represent the positions of vesicles where fluorescent resorufin was produced and accumulated. (B–E) Representative time traces of the fluorescence intensity from individual vesicles as a function of time. Following an initial rapid rise, the fluorescence signal approaches a plateau.
We followed the progress of the reaction continuously using low excitation power and an exposure time of 100 ms every 2 s (for a movie showing the reaction progress of one sample, see Movie S1). Time traces showing the appearance of the fluorescence signal of individual vesicles containing enzyme molecules are shown in Fig. 2 B–E. Surprisingly, it was found that the rate of increase in the fluorescence signal of vesicles declined over time and, eventually, product formation stalled completely in all observed vesicles.
Product Molecules Allosterically Inhibit Individual Enzyme Molecules.
What could cause the apparent arrest of the enzymatic reaction of encapsulated HRP molecules? One option is that a competing reaction destroys resorufin molecules in a concentration-dependent manner and a steady state is reached between this reaction and the formation of new resorufin molecules by the enzyme. The competing reaction might or might not involve the enzyme molecule. For example, it was shown that resorufin can be further oxidized to a much less fluorescent compound resazurin (46), albeit with a much slower rate than its rate of formation (47). A second possibility is that for some reason the substrates become limiting precluding further reaction cycles. Finally, it is possible that the product resorufin directly inhibits the enzyme.
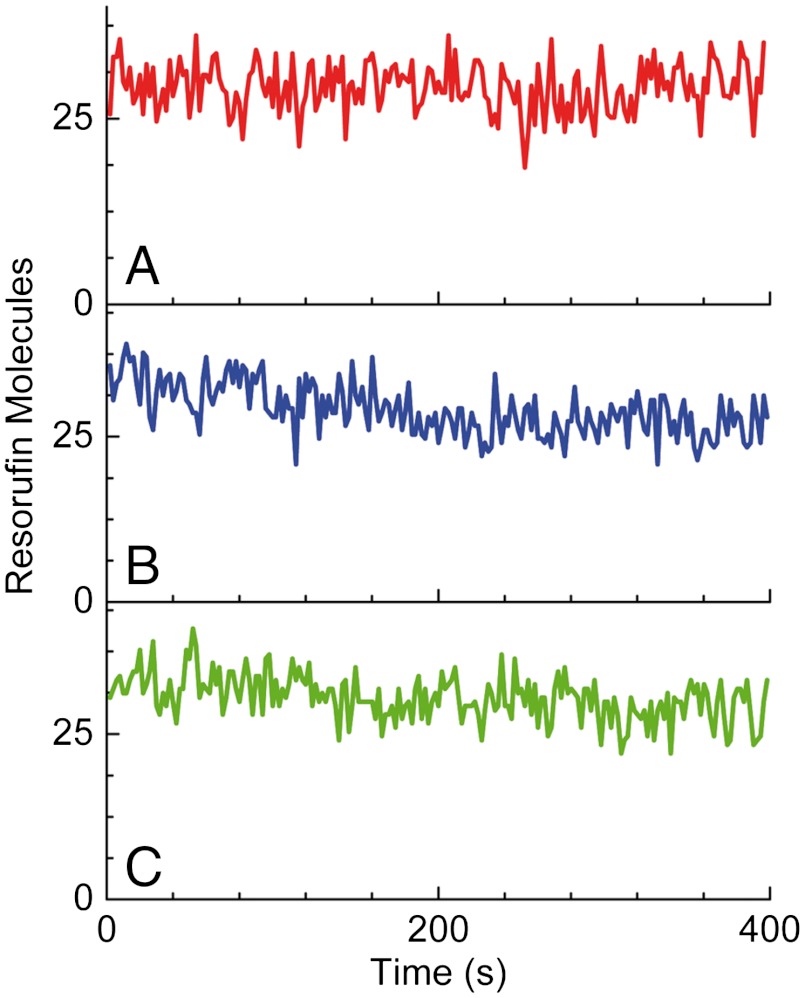
In order to distinguish between these options, we performed several experiments. First, we waited for the fluorescence signal of vesicles to reach a plateau and then washed away either one of the substrates (Amplex Red and H2O2), or both. The results of these treatments had very little effect on the fluorescence signal (Fig. 3), allowing us to discard the possibility of competing reactions as an explanation for reaction arrest. In the case that a competing reaction would lead to the plateau, we would expect this reaction’s rate to be as fast as the initial enzymatic rate; however, washing away the substrates leads, at most, to a small reduction in the signal, which is not commensurate with the above. This small signal reduction might be due to a minor leak of the product from the vesicles; e.g., due to acid-base equilibrium at the experimental pH.
Fig. 3.
The plateau level does not depend on the presence of substrates. Time traces of the fluorescence intensity of individual vesicles after the signal reached a plateau (A) in the presence of both substrates, (B) after removal of Amplex Red only, and (C) after removal of both substrates.
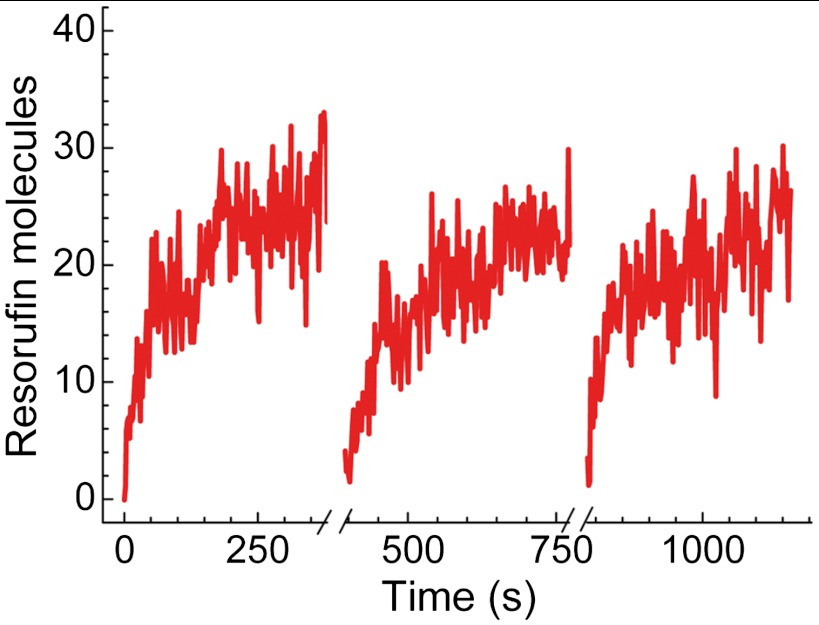
We then asked ourselves what happens if we eliminate product molecules. If substrate molecules are in some way limiting the reaction, then product removal should have no effect. To remove the product, we used strong transient laser irradiation that photodestroyed resorufin molecules. This was achieved by increasing the laser intensity to 2.5 kW/cm2 and applying this strong excitation level for a period of 10 s, which caused all the resorufin molecules created in the aqueous core of the vesicles to photobleach irreversibly, leading to a background-level fluorescence signal. After restoring the illumination to its original level, the fluorescence signal from the vesicles started increasing again in a similar manner to the first cycle. The signal continued to increase until it reached essentially the same level that it had reached previously (Fig. 4). This procedure could be repeated several times. We analyzed approximately 30 traces similar to the one in Fig. 4, and we found that the parameters characterizing them (see below) are essentially the same even after two photobleaching steps. Importantly, the observed intensity rise of the fluorescence signal from vesicles could only be reproduced in the presence of Amplex Red and H2O2. If these substrates were washed away, then the fluorescence signal was not regained. The results of this experiment show that the substrate is not limiting the reaction and, in fact, point towards product inhibition as the cause for the reaction coming to a stop.
Fig. 4.
Product photobleaching releases the enzyme from the inhibited state. A representative fluorescence time trace of a single vesicle reactor with repeated product photobleaching steps. Following each photobleaching step (which involves 10 s of strong laser irradiation), the enzyme molecule recovers from the inhibition and generates additional product molecules.
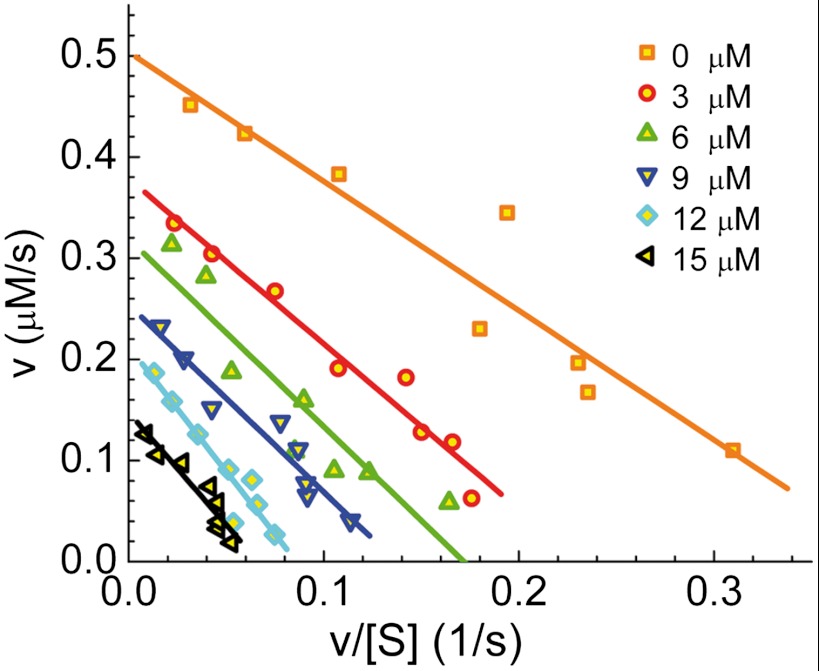
Several different types of enzyme inhibitors exist. In competitive inhibition, the only complexes formed are enzyme-substrate (ES) and enzyme-inhibitor (EI), because the inhibitor binds at the same site as the substrate(s). In uncompetitive inhibition, the complexes formed are ES and enzyme-substrate-inhibitor (ESI), as the inhibitor binds only to the enzyme-substrate complex, whereas in noncompetitive inhibition, the inhibitor binds independently of the substrate so that ES, EI, and ESI can all form. To elucidate the type of inhibition exerted by resorufin on HRP, we resorted to standard bulk enzymology experiments. We performed several series of enzymatic turnover rate measurements, each with the same concentration of Amplex Red and a different concentration of H2O2. A fixed concentration of the product/inhibitor resorufin, from 0 to 15 μM, was added in each series. Product formation (fluorescence increase) was measured in a spectrofluorometer over time, and the initial slope of each curve was used to determine the initial reaction velocity (v). The Eadie-Hofstee plot of v as a function of v/[S], where [S] is the concentration of H2O2, was used to determine the type of inhibition (48, 49). Fig. 5 presents the results of this analysis. Each line in the figure represents one series of experiments with a particular concentration of resorufin. The lines are essentially parallel to each other, indicating noncompetitive inhibition. Thus, it seems that binding of resorufin to a site in HRP outside the active site of the enzyme leads to inhibition of the enzymatic reaction. This is a form of allosteric inhibition, exerted in the current case by the product of the reaction itself. An inhibition constant (Ki) of 7.7 ± 0.6 μM is calculated from the curves in Fig. 5.
Fig. 5.
Bulk kinetic measurements of HRP enzymatic activity in the presence of resorufin. The results are presented as Eadie-Hofstee plots. Each line is the result of a series of experiments where initial enzymatic velocity is measured in the presence of varying H2O2 concentrations and a fixed initial concentration of the product resorufin. The parallel lines indicate noncompetitive inhibition. The Km and the turnover rate for the uninhibited reaction were found to be 1.30 μM and 33 s-1, respectively. The maximal velocity that corresponds to the intercept with the y axis drops from an initial value of 0.50 μM·s-1 in the absence of product to 0.17 μM·s-1 at the highest applied resorufin concentration. The Km values are essentially unchanged.
It is now clear why the reactions of individual enzyme molecules within vesicles eventually stall. As the reaction proceeds, the concentration of resorufin molecules increases and, as a result, the allosteric site on the enzyme molecule becomes increasingly occupied, gradually reducing the enzymatic reaction rate to a value close to zero.
The Kinetic Parameters of Individual Enzyme Molecules Are Distributed.
In order to extract parameters that are relevant to the enzymatic kinetics from single-molecule curves of the type shown in Fig. 2 B–E, it is necessary to show that the rate of increase of the fluorescence signal is related to the enzymatic turnover rate rather than the diffusion of substrates across the vesicle walls. In other words, one would like to show that substrate permeation is not rate limiting. It is well known that H2O2 readily permeates lipid membranes; however, the rate of diffusion of Amplex Red molecules across lipid membranes is not known. Two experiments show that Amplex Red diffusion is not rate limiting in our system. The first is the photobleaching experiment (Fig. 4). Photobleaching was always carried out well after the enzymatic reaction stalled; therefore, at the time of product photodestruction the substrate concentration within the vesicles was definitely at equilibrium with the outside concentration. If substrate diffusion were rate limiting, just after the photobleaching step the reaction should have proceeded initially with a fast rate and then slowed down. We have never seen such a biphasic progress curve. In addition, we performed single-molecule enzymology experiments in the presence of three different concentrations of H2O2, and we found that the rate of signal increase depended on the substrate’s concentration (Fig. S1). If Amplex Red diffusion were rate limiting, then we would expect very little dependence of the rate of signal increase on H2O2 concentration.
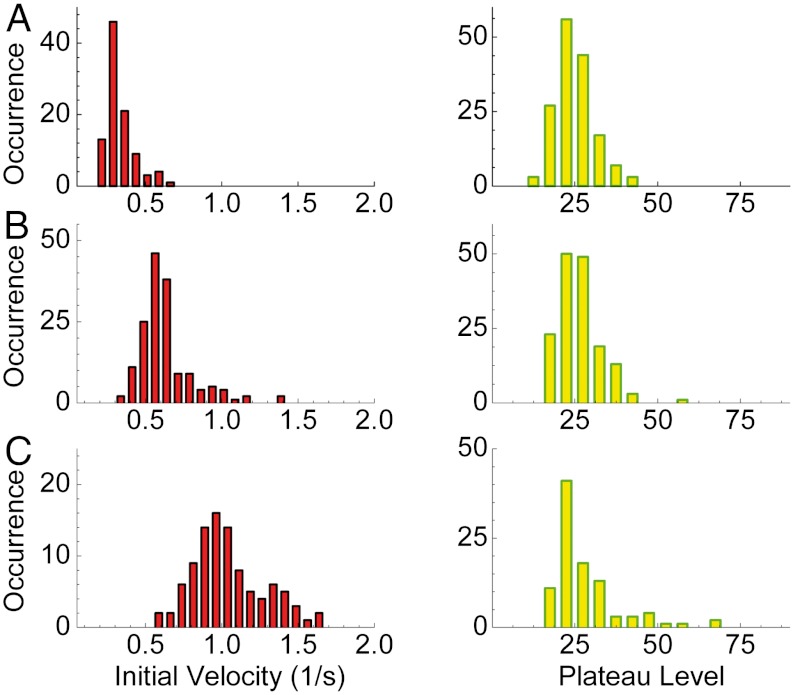
Having convinced ourselves that the rate of signal increase within vesicles faithfully reports the rate of product formation, we can now analyze single-vesicle signals and extract from these signals parameters that characterize the enzymatic and allosteric-inhibition reactions. Given the form of the curves, and the level of noise, we first fit each single-vesicle signal to a function of the form a[1 - exp(-bt)] (see Fig. 2). Based on this simple denoising procedure, one can readily obtain the value of the initial slope of each single-molecule trace, which is the initial enzymatic reaction velocity (i.e., the rate in the absence of inhibition). In addition, one can obtain the plateau level, which is the number of product molecules that fully stall the enzyme. Fig. 6 shows histograms of these two parameters at three different concentrations of the cosubstrate H2O2.
Fig. 6.
Distributions of kinetic parameters obtained from single-molecule traces. Left boxes show histograms of the initial velocities of single HRP molecules estimated from the slopes of the product buildup curves at early times. The right boxes show histograms of the plateau levels. The histograms are obtained from experiments performed at three concentrations of the substrate H2O2: (A) 50 μM, (B) 120 μM, and (C) 1 mM.
Clearly, both the initial velocity and the plateau level are broadly distributed. Values of the initial velocity are much smaller than the values measured in the bulk experiment, which is not surprising. It has been shown that the formation of resorufin from Amplex Red involves two steps: (i) the formation of two Amplex Red radicals in two consecutive steps of the enzyme, and (ii) a dismutation reaction involving these radicals to form one product molecule and one substrate molecule (29, 50). The radicals can escape from the vesicle or be deactivated through collisions with the phospholipid wall before they find each other. Therefore, a lower apparent rate of activity of the encapsulated enzyme is expected (29). To rule out a possible direct effect of membranes on enzyme molecules, we conducted standard bulk experiments where empty vesicles were added to the solution. No significant change in the enzymatic activity was observed in these experiments.
The width of the plateau level histograms can be at least partially attributed to variability in the volume of the vesicles. Dynamic light scattering measurements showed a 10% variation in the vesicle radii that translates to a 30% volume variation. Now, the relevant factor for enzyme inhibition is the concentration of the inhibitor rather than the number of its molecules. Thus, if the concentration is fixed, the volume variability implies that the number of molecules will be distributed. In principle, one should be able to correct for this effect by measuring the volume on a vesicle-by-vesicle basis (51, 52). This was not done in the current experiment; nevertheless, our analysis suggests that vesicle volume variability cannot account for the whole width of the plateau level distribution. The initial velocity histograms are not affected by volume variability because the substrate concentration does not depend on the vesicle size. Therefore, these histograms represent authentic variability between enzyme molecules.
In addition to the static disorder shown in the histograms, we found that dynamic disorder (14–17) also affects the single-molecule traces. To demonstrate dynamic disorder, we analyzed traces from approximately 30 experiments similar to the one shown in Fig. 4 where consecutive photobleaching steps were used to release the enzyme from inhibition. Each such experiment provided three initial velocity values. The plot in Fig. S2 shows that initial velocity values corresponding to consecutive photobleaching steps are correlated only very weakly and statistically insignificantly. This result indicates fluctuations of the initial velocity of the enzymatic reaction on a time scale shorter than the length of a trace. An accurate measurement of the time scale of dynamic disorder requires the observation of single-turnover events, which is not possible in the current experiment. We instead obtained an estimate for the dynamic disorder time scale using the following method. The growth function fitted to each trace (see Fig. 2) was subtracted from the trace, and the autocorrelation function of the residuals was calculated. The average autocorrelation function of approximately 70 traces was found to decay exponentially with a time constant of approximately 25 s, which is likely to be the time scale of the dynamic disorder.
A Kinetic Model of Allosteric Inhibition.
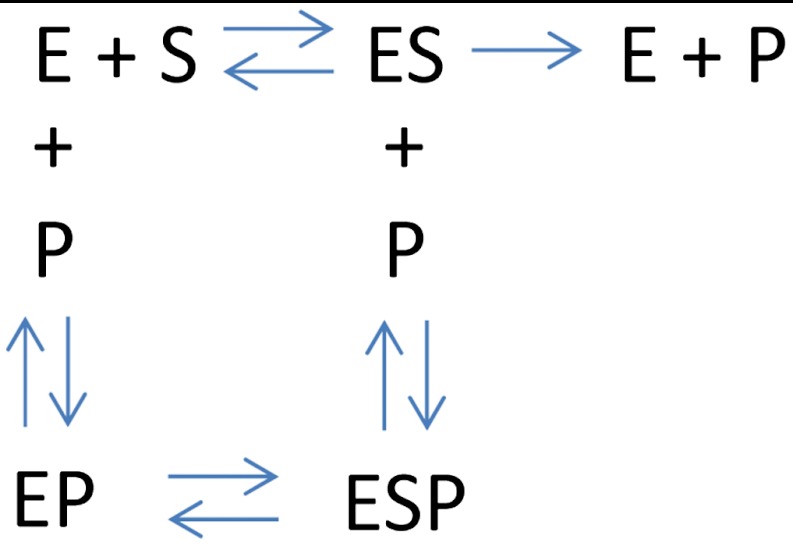
In order to better understand the source of the molecule-to-molecule fluctuations in the initial velocity and plateau level, we developed a kinetic model for noncompetitive inhibition of individual enzyme molecules within vesicles. The starting point of the model (see SI Text) is a standard scheme for enzymatic reactions with noncompetitive inhibition (Scheme 1) where S stands for the substrate, E for the enzyme, and P for the product. Because the substrate is always in large excess, we can ignore the unbound enzyme species E. Product molecules can reversibly rebind to the enzyme at a second site to form a ternary complex ESP. In other words, rebinding P to the enzyme does not preclude substrate binding; however, the presence of a P molecule at the allosteric site inhibits the enzymatic reaction. As the product accumulates within the vesicles, the enzymatic rate is gradually reduced. A set of equations can be written to describe this kinetic behavior in terms of two rate constants: kC, the catalytic rate of the enzyme and kI, the rate of product binding at the inhibitory site. Solving the kinetic equations under reasonable assumptions, we found that the time dependence of product concentration within a vesicle is described by the following equation:
| [1] |
where E0 is the total number of enzyme molecules per vesicle, which equals 1 in our experiment.
Scheme 1.
Enzymatic reaction in the presence of noncompetitive inhibition by the product. Product molecules can bind to the free enzyme or the substrate-bound enzyme; however, in the vesicles, the substrate is in large excess with respect to the enzyme, and the free enzyme species can be effectively ignored.
This function shows a very similar behavior to the function used above to denoise the data. Its initial slope, i.e. the initial velocity of the enzymatic reaction, is given by E0kC, and the number of product molecules attained at long times (the plateau level) is (2E0kC/kI)1/2. Therefore, the distribution of the initial velocity can be traced to fluctuations of the catalytic rate (kC). The observation that kC varies from one enzyme molecule to another is similar to previous reports (10–13). The model, however, also leads to an interesting and nontrivial prediction that has to do with the relationship between the variations of kC and kI. If these two rate constants that vary from one molecule to another are correlated with each other, then the model predicts that the initial velocity and the plateau level will also be correlated. Conversely, if the two rate constants are uncorrelated, no correlation should be observed between initial velocity and final product concentration.
Correlated Fluctuations in the Face of Dynamic Disorder.
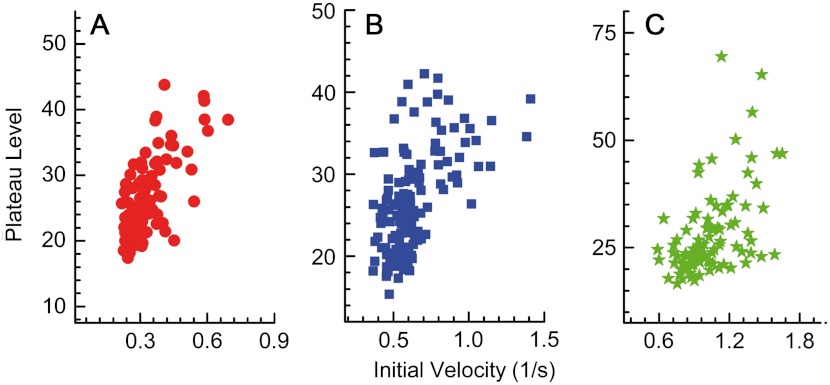
In Fig. 7, we present plots of the plateau level vs. the initial velocity for each concentration of H2O2. Although the plots show some scatter, the correlation is quite evident. A Pearson correlation calculation gives a value of 0.66 at 50 μM H2O2, 0.50 at 120 μM H2O2, and 0.52 at 1 mM H2O2. In all three cases, the correlation is highly significant with very small p values. This striking finding suggests that there is a correlation between the structural fluctuations of the active and allosteric sites of a given enzyme molecule in its various conformational states.
Fig. 7.
Initial velocities and plateau levels are correlated. Correlation plots of the two parameters extracted from single-molecule traces. (A) 50 μM H2O2, (B) 120 μM, and (C) 1 mM. The Pearson correlation values for the three plots are 0.66, 0.50, and 0.52, respectively.
The correlation of the initial velocity and plateau level in individual HRP molecules immediately indicates that the rate constants kC and kI are correlated. Note that the dynamic disorder demonstrated above implies that these microscopic parameters are randomized during the time that passes from the start of a kinetic trace until it reaches its plateau. If we assume that kC and kI fluctuate independently, then the correlation between them should be lost on the time scale of dynamic disorder and so should the correlation between the initial velocity and the plateau level. We verified this assertion by simple simulations in which sequences of values of kC and kI were selected from distributions similar to those of Fig. 6 or even significantly narrower. The Pearson correlation between kC and (kC/kI)1/2 was calculated from these sequences of values and found to be very small. For example, using distributions with a standard deviation of 10% of the mean (the experimental standard deviations are approximately 30% of the mean), the Pearson correlation was lower than 0.1. The only way to obtain the high correlation observed in the experiment was to assume that the fluctuations of kC and kI are synchronized, thus maintaining the ratio of these parameters essentially fixed over hundreds of seconds.
Discussion
Most single-molecule enzymology experiments to date were conducted under unconfined conditions (4–17). In such experiments, the very low concentration of enzyme molecules required to approach the single-molecule level precludes significant product buildup as these product molecules disperse in the whole volume of the experimental chamber. In contrast, we showed that when the enzymatic reaction is constrained to the restricted volume of a selectively permeable lipid vesicle, it is possible to attain micromolar concentrations of the product, high enough to cause product inhibition on the single-molecule level. This ability has proven to be particularly interesting in the case of HRP, as the fluorescent product resorufin inhibits the enzyme allosterically by binding at a site that is distinct from the active site.
Our study confirmed the presence of static disorder observed in other single-molecule experiments, which leads to a distribution of turnover rates. The current design of the experiment did not allow observation of individual turnover events; however, we did observe differences in the initial velocity from one molecule to another, a manifestation of static disorder. We also observed different values of the initial velocity of a single molecule measured at different times along its time trace, a manifestation of dynamic disorder. Similar differences were also observed in the plateau product levels. A notable finding of this study is that the initial velocity and plateau level are correlated with each other. In view of the dynamic disorder, the correlation must arise from synchronized fluctuations of the two kinetic parameters kC and kI. Because these kinetic parameters involve different sites on the protein, namely the active site and the allosteric inhibitory site, the current finding implies that these two structurally distinct sites fluctuate in a coordinated fashion. Although the mechanism underlying this correlation is not yet known, its very long-lived nature is particularly intriguing.
Allostery is defined as the outcome of the binding of an effector on the activity of a protein. Correlated conformational changes are, of course, at the heart of allosteric interactions. In recent years, computational and experimental methods have been advanced to display correlated motions of far sites on a protein (53, 54). The current work demonstrates a significantly more intimate connection between the allosteric and active sites, revealing synchronization of their fluctuations on time scales that are much longer than required for the simple effect of binding to propagate through a protein. As far as we know, correlations between two functional protein sites that survive long-time fluctuations have not been previously observed. Our finding is facilitated by the ability to probe individual enzyme molecules.
The current experimental scheme will be modified in the future to allow observations of single turnover events. One way to achieve such observations involves the introduction of pores into vesicular membranes to facilitate product escape and prevent its accumulation. Future experiments will allow us to measure more accurately the time scale of dynamic disorder of vesicle-encapsulated enzyme molecules. It will also be interesting to see how universal the current findings of correlated dynamics are and to what extent additional enzymes show similar phenomenology.
Methods
Preparation of Vesicles.
To prepare large unilamellar vesicles, L-α-phosphatidylcholine from a chicken egg (egg-PC, Avanti Polar Lipids) was mixed with biotinylated phosphoethanolamine (Avanti Polar Lipids) at a molar ratio of 498∶1 in 2-methyl-2-propanol and then lyophilized to remove all traces of the organic solvent. Empty vesicles, used for preparation of a supported bilayer, were made by rehydrating the dry lipid film with a 50 mM Tris·HCl buffer (pH 7.5) containing 100 mM NaCl, to achieve a total lipid concentration of 5 mg/mL. The vesicle emulsion obtained after hydration was thoroughly sonicated and extruded repetitively through a polycarbonate film with 100 nm pores (Anatop, Whatman). Vesicles encapsulating enzyme molecules were prepared by addition of 0.5 μM HRP (type II, Sigma Aldrich) to the solution prior to extrusion. The concentration of HRP was determined spectrophotometrically using an extinction coefficient of 1.02 × 10⁵ M-1·cm-1 at 403 nm. Similarly, vesicles loaded with resorufin (Sigma Aldrich) were prepared by hydrating the lipid film with a buffer containing various concentrations of the dye. Unencapsulated protein or dye molecules were separated from the vesicles on size exclusion spin columns (Illustra MicroSpin S-400 HR Columns, GE Healthcare). The vesicle size was measured by dynamic light scattering (Viscotec 802, Malvern Instruments), and it was found to be 124.5 nm (σ = 14.7 nm). The HRP-containing vesicles were stored at 4 °C and used for experiments within 24 h from preparation.
Samples for Single-Molecule Measurements.
Flow cells were assembled from two hydrogen fluoride-cleaned borosilicate glass coverslips (No. 1.5, Marienfeld). The coverslips were sealed together with melted parafilm stripes that formed a thin gap between them. Prior to use, a flow cell was thoroughly washed with the buffer (100 μL × 5, see buffer ingredients below). The following steps were taken in order to prepare a cell for the optical measurements: (i) A buffer solution containing biotinylated empty vesicles was introduced into the cell and incubated for 5 min to form a supported bilayer on the glass surfaces, (ii) the cell was then extensively flushed with buffer, and a 1 mg/mL streptavidin solution was introduced and incubated for 5 min. After additional washing, we introduced a solution of the enzyme-encapsulating vesicles. Immediately prior to the experiment, the flow cell was filled with the assay buffer that contained 10 μM Amplex Red (Invitrogen) and the desired concentration of H2O2. All experiments were conducted in 50 mM Tris·HCl buffer, pH 7.5, 100 mM NaCl, and 1 mM EDTA (Sigma Aldrich) that was added to chelate any divalent metal ions and prevent nonspecific photooxidation of Amplex Red. To minimize background fluorescence from any resorufin molecules outside the vesicles, we performed all experiments in the presence of bovine serum albumin (0.05 mg/mL, Sigma Aldrich) whose binding to resorufin was shown to reduce its fluorescence intensity (55).
Optical Detection of Single Enzyme Molecule Reactions.
Optical experiments were performed on a home-built total internal reflection fluorescence microscope based on an Olympus IX70 (Olympus) inverted microscope equipped with a high numerical aperture oil immersion objective (PlanApo 60x/1.45 oil). Excitation was accomplished by the evanescent wave of a 532-nm laser (Compass 315M, Coherent) sent through the objective. Fluorescent light was collected by the objective and directed by a dichroic mirror (540 DRLP, Omega Optical) through a bandpass filter (HQ 590/80, Chroma) to a back illuminated electron-multiplying CCD camera (iXon897, Andor Technology). Images were acquired at intervals of 2 s with exposure times of 100 ms per image, and the excitation intensity was 25 W/cm2. We verified that with this intensity photobleaching of resorufin was minimal. The time zero for each individual enzymatic reaction sequence in vesicles was set by photobleaching any product molecules already present before by increasing the illumination intensity to 2.5 kW/cm2 for 10 s. Similar photobleaching steps were used repetitively to generate data such as shown in Fig. 4. Fluorescent spots were identified in images using Matlab-written programs, and the temporal signal increase within each spot was registered. The signals were converted to a scale of resorufin molecule numbers using a calibration curve that was derived from measurements of vesicles loaded with resorufin standard solutions (see Fig. S3). All experimental data were obtained at room temperature.
Bulk Enzymology Experiments.
HRP at a concentration of 15 nM was incubated with 10 μM Amplex Red in the presence of various concentrations of H2O2 and resorufin in a volume of 1 mL. Measurements were performed using a spectrofluorometer (Fluorog, Horiba Jobin Yvon), with the excitation channel wavelength set to 532 nm and the emission channel wavelength at 615 nm. Substrate solutions were prepared immediately before placing the quartz cuvette into the spectrophotometer, and they were stirred continuously for the duration of the experiment. Each experiment was started by the addition of 10 μL of an HRP containing solution into the cuvette. The concentration of enzymatically generated resorufin was determined by calibrating the fluorescence intensities with resorufin standard solutions.
Supplementary Material
Footnotes
The authors declare no conflict of interest.
This article is a PNAS Direct Submission. D.R.W. is a guest editor invited by the Editorial Board.
See Author Summary on page 8368 (volume 109, number 22).
This article contains supporting information online at www.pnas.org/lookup/suppl/doi:10.1073/pnas.1116670109/-/DCSupplemental.
References
- 1.Weiss S. Measuring conformational dynamics of biomolecules by single molecule fluorescence spectroscopy. Nat Struct Mol Biol. 2000;7:724–729. doi: 10.1038/78941. [DOI] [PubMed] [Google Scholar]
- 2.Cornish PV, Ha T. A survey of single-molecule techniques in chemical biology. ACS Chem Biol. 2007;2:53–61. doi: 10.1021/cb600342a. [DOI] [PubMed] [Google Scholar]
- 3.Deniz AA, Mukhopadhyay S, Lemke EA. Single-molecule biophysics: at the interface of biology, physics and chemistry. J R Soc Interface. 2008;5:15–45. doi: 10.1098/rsif.2007.1021. [DOI] [PMC free article] [PubMed] [Google Scholar]
- 4.Min W, et al. Fluctuating enzymes: lessons from single-molecule studies. Acc Chem Res. 2005;38:923–931. doi: 10.1021/ar040133f. [DOI] [PubMed] [Google Scholar]
- 5.Gershenson A. Single molecule enzymology: watching the reaction. Curr Opin Chem Biol. 2009;13:436–442. doi: 10.1016/j.cbpa.2009.06.011. [DOI] [PubMed] [Google Scholar]
- 6.Claessen VI, et al. Single-biomolecule kinetics: the art of studying a single enzyme. Annu Rev Anal Chem. 2010;3:319–340. doi: 10.1146/annurev.anchem.111808.073638. [DOI] [PubMed] [Google Scholar]
- 7.Xie XS. Single-molecule approach to dispersed kinetics and dynamic disorder: probing conformational fluctuation and enzymatic dynamics. J Chem Phys. 2002;117:11024–11032. [Google Scholar]
- 8.Engelkamp H, et al. Do enzymes sleep and work? Chem Commun. 2006:935–940. doi: 10.1039/b516013h. [DOI] [PubMed] [Google Scholar]
- 9.Chen Q, Groote R, Schonherr H, Vancso GJ. Probing single enzyme kinetics in real-time. Chem Soc Rev. 2009;38:2671–2683. doi: 10.1039/b903638e. [DOI] [PubMed] [Google Scholar]
- 10.Xue Q, Yeung ES. Differences in the chemical reactivity of individual molecules of an enzyme. Nature. 1995;373:681–683. doi: 10.1038/373681a0. [DOI] [PubMed] [Google Scholar]
- 11.Craig DB, Arriaga EA, Wong JCY, Lu H, Dovichi NJ. Studies on single alkaline phosphatase molecules: reaction rate and activation energy of a reaction catalyzed by a single molecule and the effect of thermal denaturationthe death of an enzyme. J Am Chem Soc. 1996;118:5245–5253. [Google Scholar]
- 12.Edman L, Rigler R. Memory landscapes of single-enzyme molecules. Proc Natl Acad Sci USA. 2000;97:8266–8271. doi: 10.1073/pnas.130589397. [DOI] [PMC free article] [PubMed] [Google Scholar]
- 13.Rissin DM, Gorris HH, Walt DR. Distinct and long-lived activity states of single enzyme molecules. J Am Chem Soc. 2008;130:5349–5353. doi: 10.1021/ja711414f. [DOI] [PubMed] [Google Scholar]
- 14.Zhuang X, et al. Correlating structural dynamics and function in single ribozyme molecules. Science. 2002;296:1473–1476. doi: 10.1126/science.1069013. [DOI] [PubMed] [Google Scholar]
- 15.Velonia K, et al. Single-enzyme kinetics of CALB-catalyzed hydrolysis. Angew Chem. 2005;44:560–564. doi: 10.1002/anie.200460625. [DOI] [PubMed] [Google Scholar]
- 16.English BP, et al. Ever-fluctuating single enzyme molecules: Michaelis-Menten equation revisited. Nat Chem Biol. 2006;2:87–94. doi: 10.1038/nchembio759. [DOI] [PubMed] [Google Scholar]
- 17.Flomenbom O, et al. Stretched exponential decay and correlations in the catalytic activity of fluctuating single lipase molecules. Proc Natl Acad Sci USA. 2005;102:2368–2372. doi: 10.1073/pnas.0409039102. [DOI] [PMC free article] [PubMed] [Google Scholar]
- 18.Bayer EA, Skutelsky E, Wilchek M. The avidin-biotin complex in affinity cytochemistry. Methods Enzymol. 1979;62:308–315. doi: 10.1016/0076-6879(79)62235-8. [DOI] [PubMed] [Google Scholar]
- 19.Friedel M, Baumketner A, Shea JE. Effects of surface tethering on protein folding mechanisms. Proc Natl Acad Sci USA. 2006;103:8396–8401. doi: 10.1073/pnas.0601210103. [DOI] [PMC free article] [PubMed] [Google Scholar]
- 20.Boukobza E, Sonnenfeld A, Haran G. Immobilization in surface-tethered lipid vesicles as a new tool for single biomolecule spectroscopy. J Phys Chem B. 2001;105:12165–12170. [Google Scholar]
- 21.Rhoades E, Gussakovsky E, Haran G. Watching proteins fold one molecule at a time. Proc Natl Acad Sci USA. 2003;100:3197–3202. doi: 10.1073/pnas.2628068100. [DOI] [PMC free article] [PubMed] [Google Scholar]
- 22.Okumus B, Wilson TJ, Lilley DM, Ha T. Vesicle encapsulation studies reveal that single molecule ribozyme heterogeneities are intrinsic. Biophys J. 2004;87:2798–2806. doi: 10.1529/biophysj.104.045971. [DOI] [PMC free article] [PubMed] [Google Scholar]
- 23.Cisse I, Okumus B, Joo C, Ha T. Fueling protein DNA interactions inside porous nanocontainers. Proc Natl Acad Sci USA. 2007;104:12646–12650. doi: 10.1073/pnas.0610673104. [DOI] [PMC free article] [PubMed] [Google Scholar]
- 24.Benitez JJ, et al. Probing transient copper chaperone-Wilson disease protein interactions at the single-molecule level with nanovesicle trapping. J Am Chem Soc. 2008;130:2446–2447. doi: 10.1021/ja7107867. [DOI] [PMC free article] [PubMed] [Google Scholar]
- 25.Rosenkranz T, et al. Observing proteins as single molecules encapsulated in surface-tethered polymeric nanocontainers. ChemBioChem. 2009;10:702–709. doi: 10.1002/cbic.200800739. [DOI] [PubMed] [Google Scholar]
- 26.Chen Q, Schönherr H, Vancso GJ. Block-copolymer vesicles as nanoreactors for enzymatic reactions. Small. 2009;5(12):1436–1445. doi: 10.1002/smll.200801455. [DOI] [PubMed] [Google Scholar]
- 27.Comellas-Aragones M, et al. A virus-based single-enzyme nanoreactor. Nature Nanotechnol. 2007;2:635–639. doi: 10.1038/nnano.2007.299. [DOI] [PubMed] [Google Scholar]
- 28.Gorris HH, Rissin DM, Walt DR. Stochastic inhibitor release and binding from single-enzyme molecules. Proc Natl Acad Sci USA. 2007;104:17680–17685. doi: 10.1073/pnas.0705411104. [DOI] [PMC free article] [PubMed] [Google Scholar]
- 29.Gorris HH, Walt DR. Mechanistic aspects of horseradish peroxidase elucidated through single-molecule studies. J Am Chem Soc. 2009;131:6277–6282. doi: 10.1021/ja9008858. [DOI] [PubMed] [Google Scholar]
- 30.Walde P, Ichikawa S. Enzymes inside lipid vesicles: preparation, reactivity and applications. Biomol Eng. 2001;18:143–177. doi: 10.1016/s1389-0344(01)00088-0. [DOI] [PubMed] [Google Scholar]
- 31.Walter A, Gutknecht J. Permeability of small nonelectrolytes through lipid bilayer membranes. J Membrane Biol. 1986;90:207–217. doi: 10.1007/BF01870127. [DOI] [PubMed] [Google Scholar]
- 32.Cioci F, Lavecchia R. Urease-loaded liposomes as detoxifying microreactors: effect of ammonia accumulation on enzyme kinetics. J Liposome Res. 1993;3:725–735. [Google Scholar]
- 33.Li M, Hanford M, Kim J-W, Peeples T. Amyloglucosidase enzymatic reactivity inside lipid vesicles. Journal of Biological Engineering. 2007;1:4. doi: 10.1186/1754-1611-1-4. [DOI] [PMC free article] [PubMed] [Google Scholar]
- 34.Blocher M, Walde P, Dunn IJ. Modeling of enzymatic reactions in vesicles: the case of α-chymotrypsin. Biotechnol and Bioeng. 1999;62:36–43. [PubMed] [Google Scholar]
- 35.Winterhalter M, et al. Controlling membrane permeability with bacterial porins: application to encapsulated enzymes. Talanta. 2001;55:965–971. doi: 10.1016/s0039-9140(01)00494-5. [DOI] [PubMed] [Google Scholar]
- 36.Nasseau M, Boublik Y, Meier W, Winterhalter M, Fournier D. Substrate-permeable encapsulation of enzymes maintains effective activity, stabilizes against denaturation, and protects against proteolytic degradation. Biotechnol and Bioeng. 2001;75:615–618. doi: 10.1002/bit.10074. [DOI] [PubMed] [Google Scholar]
- 37.Monnard P-A, Deamer DW. Nutrient uptake by protocells: a liposome model system. Origins Life Evol B. 2001;31:147–155. doi: 10.1023/a:1006769503968. [DOI] [PubMed] [Google Scholar]
- 38.Cisse I, Okumus B, Joo C, Ha T. Fueling protein-DNA interactions inside porous nanocontainers. Proc Natl Acad Sci USA. 2007;104:12646–12650. doi: 10.1073/pnas.0610673104. [DOI] [PMC free article] [PubMed] [Google Scholar]
- 39.Ghoshroy KB, Zhu W, Sampson NS. Investigation of membrane disruption in the reaction catalyzed by cholesterol oxidase. Biochemistry. 1997;36:6133–6140. doi: 10.1021/bi962190p. [DOI] [PubMed] [Google Scholar]
- 40.Treyer M, Walde P, Oberholzer T. Permeability enhancement of lipid vesicles to nucleotides by use of sodium cholate: basic studies and application to an enzyme-catalyzed reaction occurring inside the vesicles. Langmuir. 2002;18:1043–1050. [Google Scholar]
- 41.Dimitrova MN, Matsumura H. Protein-induced leakage and membrane destabilization of phosphatidylcholine and phosphatidylserine liposomes. Colloid Surface B. 1997;8:287–294. [Google Scholar]
- 42.Edman L, Földes-Papp Z, Wennmalm S, Rigler R. The fluctuating enzyme: a single molecule approach. Chem Phys. 1999;247:11–22. [Google Scholar]
- 43.Ashtamker C, Kiss V, Sagi M, Davydov O, Fluhr R. Diverse subcellular locations of cryptogein-induced reactive oxygen species production in Tobacco Bright Yellow-2 Cells. Plant Physiol. 2007;143:1817–1826. doi: 10.1104/pp.106.090902. [DOI] [PMC free article] [PubMed] [Google Scholar]
- 44.Bowler C, Montagu MV, Inze D. Superoxide dismutase and stress tolerance. Annu Rev Plant Physiol Plant Mol Biol. 1992;43:83–116. [Google Scholar]
- 45.Sánchez-Martín RM, Alexander L, Bradley M. Multifunctionalized biocompatible microspheres for sensing. Ann NY Acad Sci. 2008;1130:207–217. doi: 10.1196/annals.1430.004. [DOI] [PubMed] [Google Scholar]
- 46.Brotea GP, Thibert RJ. Fluorometric determination of hydrogen peroxide using resorufin and peroxidase. Microchem J. 1988;37:368–376. [Google Scholar]
- 47.Towne V, Will M, Oswald B, Zhao Q. Complexities in horseradish peroxidase-catalyzed oxidation of dihydroxyphenoxazine derivatives: appropriate ranges for pH values and hydrogen peroxide concentrations in quantitative analysis. Anal Biochem. 2004;334:290–296. doi: 10.1016/j.ab.2004.07.037. [DOI] [PubMed] [Google Scholar]
- 48.Fersht A. Structure and Mechanism in Protein Science. New York: Freeman; 1999. [Google Scholar]
- 49.Segel IH. Enzyme kinetics. New York: John Wiley & Sons; 1993. [Google Scholar]
- 50.Dunford HB, Stillman JS. Function and mechanism of action of peroxidases. Coord Chem Rev. 1976;19:187–251. [Google Scholar]
- 51.Kunding AH, Mortensen MW, Christensen SM, Stamou D. A fluorescence-based technique to construct size distributions from single-object measurements: application to the extrusion of lipid vesicles. Biophys J. 2008;95:1176–1188. doi: 10.1529/biophysj.108.128819. [DOI] [PMC free article] [PubMed] [Google Scholar]
- 52.Heider EC, Barhoum M, Edwards K, Gericke K-H, Harris JM. Structural characterization of individual vesicles using fluorescence microscopy. Anal Chem. 2011;83:4909–4915. doi: 10.1021/ac200632h. [DOI] [PubMed] [Google Scholar]
- 53.Bahar I, Lezon TR, Yang LW, Eyal E. Global dynamics of proteins: bridging between structure and function. Annu Rev Biophys. 2010;39:23–42. doi: 10.1146/annurev.biophys.093008.131258. [DOI] [PMC free article] [PubMed] [Google Scholar]
- 54.Whitley MJ, Lee AL. Frameworks for understanding long-range intra-protein communication. Curr Protein Pept Sc. 2009;10:116–127. doi: 10.2174/138920309787847563. [DOI] [PMC free article] [PubMed] [Google Scholar]
- 55.Wittrup KD, Bailey JE. A single-cell assay of beta-galactosidase activity in Saccharomyces cerevisiae. Cytometry. 1988;9:394–404. doi: 10.1002/cyto.990090418. [DOI] [PubMed] [Google Scholar]


